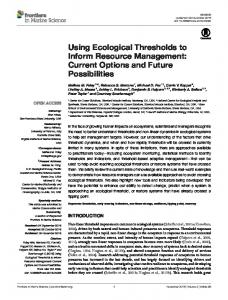
Using Ontologies to Relate Resource Management Actions to Environmental Monitoring Data in South East Queensland Jane Hunter1, Peter Becker1, Abdulmonem Alabri1, Catharine van Ingen2, Eva Abal3 1 TheUniversity of Queensland 2 Microsoft Research 3 South East Queensland Healthy Waterways Partnership
[email protected];
[email protected];
[email protected];
[email protected];
[email protected] Abstract The Health-e-Waterways Project is a multi-disciplinary collaboration between the University of Queensland, Microsoft Research and the South East Queensland Healthy Waterways Partnership (SEQ-HWP) (a consortium of over 60 local government, state agency, universities, community and environmental organizations). The aim of the project is to develop the underlying technological framework and set of services to enable streamlined access to the expanding collection of real-time, near-real-time and static datasets related to water resource management in South East Queensland. More specifically the system enables water resource managers to access the datasets being captured by the various agencies participating in the SEQ HWP Ecosystem Health Monitoring Program (EHMP). It also provides online access to the statistical data processing tools that enable users to analyse the data and generate online ecosystem report cards dynamically via a Web mapping interface. More recently we have focussed on the development of ontologies and semantic querying tools to integrate disparate datasets and relate management actions to water quality indicators for specific regions and time periods. This innovative semantic data integration approach enables scientists and resource managers to identify which actions are having an impact on which parameters and to adapt the management strategies accordingly. This paper provides an overview of the semantic technologies that we have developed to underpin the adaptive management framework that is the central philosophy behind the South East Queensland Healthy Waterways Partnership (SEQ HWP).
Keywords Environmental monitoring, ontologies, ecoinformatics, adaptive resource management
Introduction Climate change, urban development and population growth in South East Queensland are applying significant pressure to urban water supplies. Billion dollar investments are being made in new water projects, such as the South East Queensland Water Grid, with the aim to enhance and secure water supply to the region. However the potential benefits of these massive investments in physical infrastructure will not be fully realized, without the investment in corresponding cyberinfrastructure. Scientists, urban planners and policy makers require access to integrated water information management systems that enable them to track water movement, consumption and quality across the ―whole-of-water-cycle‖. They require access to high quality, complete datasets and accurate predictive models on which to base water management decisions. Understanding and satisfying the competing needs of water users, requires the integration of data and models that reflect the behaviour of many systems including: climate, rainfall, catchments, reservoirs, rivers, agricultural demand, industrial demand and urban demand. The linking of models requires a detailed understanding of: the questions being asked, the data that is available and the relationships between the datasets and models being employed. In parallel with the demand for more sophisticated querying and decision support interfaces, there is a trend towards wide-spread deployment of sensors capturing real-time
information including volume flows, water quality, images and video. These real-time and near-real-time, temporal and visual data streams require more sophisticated, high speed, data processing, indexing and archival services. This paper describes the Health-e-Waterways Project – a cross-disciplinary collaboration between information scientists and water resource managers and stakeholders that is developing the knowledge management infrastructure for adaptive whole-of-water-cycle management in South East Queensland. It begins by describing the challenges faced by South East Queensland Healthy Waterways Partnership (SEQ HWP) in managing the data associated with their Adaptive Management Strategy and Ecosystem Health Monitoring Program (EHMP). It goes on to describe the ontology-based knowledge management system developed by Health-e-Waterways to enable the integration and analysis of a wide range of data types. More specifically it describes the ontologies that have been developed, the system architecture and the query, reporting and visualization interfaces – that are enabling scientists and policy makers to identify trends in ecosystem health indicators both geographically and temporally and to understand the impact that water resource management actions are having on water quality.
The South East Queensland Healthy Waterways Partnership South East Queensland Healthy Waterways Partnership (SEQ HWP) was established in 2002 by government, industry and community stakeholders working in close cooperation to develop a whole-of-government, whole-ofcommunity approach to understanding and managing the region’s waterways. The key elements of the SEQ HWP strategy include: the implementation of targeted management actions (ranging from upgrades of sewage treatment plants to rehabilitation of riparian vegetation); a multi-disciplinary science, research and monitoring program that underpins the management action program and monitors its effectiveness; and the Healthy Waterways promotional and educational program (Bunn et al, 2007). Moreover the SEQ HWP is underpinned by an ―Adaptive Management‖ approach as illustrated in Figure 1. ―This approach recognizes that management intervention can’t be postponed until all of the information required to fully understand the situation is available‖ (Bunn et al, 2007). As a result, monitoring data is continually acquired through a comprehensive Ecosystem Health Monitoring Programme (EHMP) (EHMP, 2010), analysed and assessed to monitor the effectiveness of management actions, that are then adapted as required. The EHMP comprises two sub-programmes – the Estuarine and Marine EHMP and the FreshWater EHMP.
Figure1: The Adaptive Management Framework adopted by Healthy Waterways Partnership
The Estuarine and Marine EHMP began in 2000 and includes monthly monitoring of water quality parameters at 260 sites in coastal waterways from Noosa to the New South Wales border. This program monitors a range of physical/chemical and biological indicators including: turbidity, salinity, temperature, pH, dissolved oxygen, secchi depth, total nitrogen, total phosphorus, seagrass depth range and distribution, 15N (sewage plume) mapping, Lyngbya and coral. The Freshwater EHMP commenced in 2002 and includes twice-yearly sampling at over 120 sites on all of the major streams in the region. This involves the measurement of 5 indicators (physical/chemical, nutrient cycling, ecosystem processes, acquatic macroinvertebrates and fish) that are derived from 16 parameters (e.g., pH, 15 Temperature, conductivity, dissolved oxygen, nitrogen stable isotope N, algal bioassay, algal growth, number of taxa, proportion of alien fish etc) (Smith and Storey, 2001) (Smith and Grice, 2005). The EHMP delivers an objective regional assessment of the ecosystem health for each of South East Queensland's 19 major catchments, 18 river estuaries, and Moreton Bay (Figure 2). One of the major outcomes from the Program is an Annual Report Card which aggregates measured values of water quality to provide a simple grade (A-F) for each of these waterways (Annual Report Cards, 2009). This grade provides an effective way to communicate the relative health of waterways to the local and State Governments and the broader community, and to evaluate the effectiveness of management actions. To date, these annual report cards have taken 6 months of manual effort by a large team of scientists to retrieve, collate and analyze the data and produce graphical reports using Photoshop and Adobe Illustrator. As the size and heterogeneity of the datasets grows and the number of agencies contributing relevant data expands, this process becomes unsustainable.
Figure 2: Ecosystem Health Monitoring Program – freshwater and estuarine/marine monitoring sites Hence the aim of the Health-e-Waterways project is to develop underlying data management, integration, reporting and visualization services to streamline the generation of the Annual Report Cards, enable more interactive online access to the data and associated analytical services and in the long term support the Adaptive Management approach, shown in Figure 1.
Objectives of the Health-e-Waterways Project The primary objective of the Health-e-Waterways project is to enable and promote the sharing and collaborative integration and analysis of high quality information concerning water for the partners and stakeholders of SEQ HWP. Figure 3 (below) provides an overview of the components and architecture of the proposed system. A combination of semantic web technologies, scientific data servers, web services, GIS (Geographical Information Systems) visualization interfaces and scientific workflows is enabling the sharing and integration of high quality data and models, through a combined integrated water information management system and Web portal.
Figure 3. Health-e-Waterways System - Overview and Architecture The high-level, long term aim of the project is to provide a Web portal to the latest relevant data and models for Queensland scientific, education, government, community and commercial stakeholders with an interest in water research, conservation, and management. A range of security and access-control levels are also under development to enable different stakeholders to access different types and levels of data. For example, the aggregated report card grades are available to the general public but the raw data underpinning these is only accessible by SEQ HWP partners. During the first 3 months of the project, it became clear that there were critical components of the SEQ-HWP strategy that required immediate focus by the information scientists involved in the project. These included: Streamlining the generation of the Annual Report Cards - currently the Report Cards take 6 months to produce and comprise both a 4 page summary Report Card as well as a150 page Technical Report. These documents contain many graphs and figures that are manually collated and produced using tools such as PhotoShop. Our first objective was to enable the report card grades and associated graphs to be generated dynamically and systematically from the underlying integrated database via a Web interface. Database Registry - the EHMP databases, Management Action database and other relevant databases are stored on a variety of platforms and servers hosted by different organizations behind their organizational
firewalls. Our second objective was to enable these databases to be accessible and discoverable via a single web-based database registry and to be integrated and searchable via a common data model and web server. Semantic Querying, Reporting and Visualization Services – scientists and resource managers need to be able to easily identify whether specific management actions are having any impact or not. They require decision support tools to help them decide whether and how their management plans should be adapted. Currently this is a complex procedure that depends on manual collation of related data and information. A high priority aim was to provide querying and visualization interfaces that enabled relationships between management actions and corresponding changes in water quality to be identified.
In the remainder of this paper, we describe the methods we have adopted in implementing solutions to these high priority issues and also provide a discussion of the effectiveness of these methods.
Related Work In developing the Health-e-Waterways system, we first identified a number of existing initiatives and environmental science projects that recognize the critical role of semantic web technologies and Observational Data Models (ODMs) in providing seamless, multi-disciplinary access to observational data. These projects include: The Consortium of Universities for the Advancement of Hydrologic Science (CUAHSI) has developed an Observations Data Model (ODM) that is being applied to the storage and retrieval of hydrologic observations data (CUAHSI, 2009) (Horsburgh et al, 2008); SPIRE is a research project investigating how semantic web technologies can be used to support science in general and the field of ecoinformatics more specifically (Madin et al, 2007); The SWEET (Semantic Web for Earth and Environmental Terminology) has developed several ontologies to provide a common semantic framework for various Earth science initiatives (SWEET, 2009); The WATERS testbed (Montgomery et al, 2007) is constructing a national-scale network of observational and experimental facilities in the US, to enable systematic water measurements, data storage and curation, modeling and visualization. WATERS is using the CUAHSI ODM as the underlying data model. The SNaaS Framework (Sensor Network as a Service) is specifically developing ontologies to describe virtual sensors (Liu et al, 2009). These previous efforts have primarily focused on ontologies for integrating observational data associated with ecosystems. The EHMP ontology was developed through a 3-pronged approach that involved: a comprehensive analysis of existing database schemas (Hunter & Mauger, 2008); drawing on these existing data models; and inviting input from local domain experts. In addition, we have developed a ―Management Action‖ ontology that models management action data and enables management decisions to be linked to specific targeted ecosystem health indicators. This represents a significant and critical advance on previous efforts. A number of previous projects and efforts have focused on the application of ontologies, artificial intelligence or machine learning to knowledge management and decision-support in the context of hydrological ecosystems. However the majority of these approaches have focused on computational modeling. For example, Chau (2007) developed an ontology-based system for modeling water flow and quality. This system is based on numerical simulations (not near-real-time observational data) and uses inferencing to select the optimum model and parameters. Other related research efforts (Zhao et al, 2006) (Muttil and Chau, 2007) (Lee et al, 2002) have primarily focused on statistical and AI methods for identifying the ecologically significant variables associated with environmental models. For example, Lee et. al (2002) applied neural networks to the modeling of coastal algal blooms using longterm water quality data. Although some models have been developed for South East Queensland (Larsen, 2007), there is insufficient long term data available at this stage for scientists and policy makers to be able to reliably depend on the accuracy of these predictive models. Our approach is to apply semantic web technologies to enable scientists to explore and better understand relationships between ecosystem health indicators and management actions in the past – in parallel with the development of more accurate, localized predictive models. The next phase of our work will be to integrate these models to enable predictive queries.
Methodology The Health-e-Waterways development strategy comprises seven key components which build on top of a combination of semantic web technologies and web services to access, process and integrate data, maps and models held within both centralized and distributed hydrological databases: 1. Identification and prioritization of the key stakeholder user requirements, queries and datasets; 2. Development of a dataset registry that describes the key datasets, their source, spatio-temporal scope, metadata schema, size, formats etc; 3. Development of the common data models and ontologies to integrate both static and real-time data streams, visual, spatial and temporal data, legacy databases and newly generated datasets; 4. Design and implementation of the semantic interoperability layer on the scientific data server; 5. Development of a Web-based querying, visualization and presentation interface – that integrates GIS technologies with GoogleEarth-type interfaces, ontology-based queries and SensorMaps - to display the latest integrated data sets through a mapping interface; 6. Development of a secure Web Portal and WaterWiki that provides different levels of collaborative access to data, models, services, storage and compute power. Standardized authentication and access protocols will enforce controlled access to resources and software; 7. Development of a model registry and scientific workflow tools. This component will enable users to upload and share models as web services through a common model registry, link them using scientific workflows and execute them over grid computing infrastructure.
Database Survey and Registration The first phase of the project involved identifying those databases that are most critical and relevant to the water stakeholders of SEQ. In the long term the stakeholders want to be able to integrate the following datasets: Ecosystem Health Monitoring Program (EHMP) Database; Management Action Database; Climate data – rainfall, temperature, humidity from the Bureau of Meteorology; Vegetation data – from the Australian Herbarium; Biodiversity data – from the Atlas of Living Australia; Remote Sensing Satellite Imagery – MODIS (Moderate Resolution Imaging Spectroradiometer) data and images from NASA (National Aeronautics and Space Administration) are providing derived measurements inlcuding surface temperature and soil moisture; Atmospheric and Air quality data – available via FluxNet. In the immediate short term, the users wanted to be able to analyse the data being captured through the Ecosystem Health Monitoring program (EHMP) [5] and relate it to the Management Action Database (MAD). Our first activity was a detailed analysis of these databases and the generation of a report that describes these databases in detail and recommends the best approach for integration [8]. This report recommended the development of a dataset registry (that enables relevant data sets to be easily browsed and discovered) and associated registry services (that enable new datasets to be registered, described, uploaded and published). The report also recommends the development of a common data model/ontology to support the integration of these datasets through a common search interface. The ontologies that we have since developed in response to this recommendation are described in the next Section.
The EHMP Ontology The analysis of the existing databases enabled us to develop an Entity-Relationship model that incorporates all of the key top-level classes, properties and relationships. Figure 4 (below) illustrates graphically the model that has been determined by identifying the common top-level entities from the five key databases that we have analysed [8]. We used Protégé to develop the OWL version of the EHMP ontology. We also held numerous meetings with key scientists to interactively explain, refine and validate the ontology. The advantage of developing a model that is object-oriented and based on a common set of top-level entities is that it is extensible. As new databases become available, it will be relatively easy to incorporate these by refining and extending the existing model. Once the EHMP model was determined and agreed, we represented it as an OWL (Web Ontology Language) ontology. During the development of this common model, we drew on a number of preexisting water information models of relevance but refined and adopted to accommodate local terms and parameters:
The CUAHSI Community Observations Data Model (ODM) (Horsburgh, 2008) The OpenGIS Observations and Measurements Model (OGC, 2009) The SEEK Observation Ontology (OBOE) (SEEK 2008) WRON-RM (Water Resources Observation Network Reference Model) 0.1 (O’Hagan, et al, 2007). responsible_for Organization
Event
Action
Basin
applys_to
is_a
is_located_in Site Disturbance Habitat Type
Catchment impacts
has_type
is_located_in Lat/Long Grid
affiliated_with
contains
Habitat Unit
Site
located_at
located_at
Gauging Station
reside_in
apply_to Season/ Year
within
Device
generates
carry_out Personnel
Lab
SampleRun collected_by
collect
Sample
analysed_by
taken_by
Water Quantity
Water Quality Isotopes
reports
Fish
Indicators
perform
Macro Invertebrates
generates make
Measurement Algal Bioassay
calculate
Benthic Zone
Observation for_period
derived_from Report Card Grades
published_in
Annual ReportCard
Figure 4. Graphical representation of the EHMP ontology
The Management Action Ontology The South East Queensland Healthy Waterways Strategy for 2007-20121 comprises a set of twelve Action Plans: Five issue-based Action Plans o Point Source Pollution o Non-Urban Diffuse Source Pollution o Water Sensitive Urban Design o Protection and Conservation o Coastal Algal Blooms Three enabling Action Plans o Ecosystem Health Monitoring Program o Communication, Education and Motivation o Management Strategy Evaluation Four area-based Action Plans o Moreton Bay o Northern Catchments o Bremer Catchments o Logan Albert Catchments
1
http://www.healthywaterways.org/TheStrategy.aspx
Each Action Plan comprises a number of high level Management Outcomes and sets of Actions that are linked via specific Management Action Targets. Figure 5 below illustrates the classes and properties that comprise the MAD ontology. ActionPlanID
Action Plan
ActionPlanName Investment
TimeFrame
Description comprises
Goals/ Management Outcomes
Status
ActionName ActionID perform
affiliatedWith
responsibleFor Organization
Actions hasTarget
Management Action Targets
Action Contacts
participateIn Involved Partners
applyTo documents
isPartOf Catchment
Action Journal
SubActions
Figure 5: Graphical Representation of the MAD Ontology An illustrative example of an Action Plan (using fictional data) showing its Goal, Target and an associated Action is shown in the Table 1 below. Class Instance ActionPlan ―Bremer River Catchment Action Plan‖ Goal ―Management of Wastewater Treatment Plants‖ Action ―Upgrade of Rosewood Wastewater Treatment Plant‖ Target ―Total N of 5mg/L and total P of 2mg/L in effluent‖ Responsible Organization ―Ipswich City Council‖ Involved Partners ―Bremer Catchment Association‖ Catchment ―Bremer‖ TimeFrame ―2011‖ Investment ―$2million‖ Status ―Underway‖ PercentComplete ―50‖ LastUpdate ―20/09/2009‖ Table 1: An example of a Management Action Over 500 management actions have been stored in an Access database managed by SEQ HWP. One of the key objectives of Health-e-Waterways is to integrate the Management Actions Database (MAD) with the environmental monitoring data in order to identify whether the actions and associated investments are having any impact on the quality of the water – and whether the strategy needs to be adapted or not. At this stage, only the Actions associated with area-based Action Plans are able to be linked to specific regions and indicators. In the next sections, we describe how we integrate these datasets and visualize relationships through a GoogleEarth querying and reporting interface.
System Implementation and Architecture A significant challenge early in the project was the resolution of data access agreements with the custodians of the individual databases. This was a very time-consuming process that required numerous meetings and discussions with stakeholder groups to gain their trust and support. (We are working with the OAKLaw project (Fitzgerald & Long, 2008) to identify licenses that could be applied more generally to enable much easier and streamlined access to the databases via web services interfaces.) Once the data agreements were resolved, we were provided with copies of the datasets for local storage and re-use. We then developed XSLT (XSL Transformations) scripts to automate the mapping of the data from the legacy structure to the common model/ontologies and loaded the mapped data into a common data store. Figure 6 below illustrates the ICT components of the system architecture.
Figure 6: Architectural Components of the Health-e-Waterways System
The Freshwater and Estuarine Marine EHMP data sets, together with the Shape files (outlining the catchments, estuaries and bay zones) and the Management Action Database are stored in a PostgreSQL database. The ontologies described in the previous section are used as the common data model underpinning the database. The Open Source GeoStack (OpenLayers, GeoServer and PostGIS) is used to store, publish and access the data. OpenLayers was chosen because it provides an open source AJAX (asynchronous JavaScript and XML) solution for serving, displaying and layering map data in most browsers, using Open Geospatial Consortium (OGC) OGC Web Mapping Services (WMS). It enables fast development and easy customization and extension of the basic software services.
Dynamic Generation of Online Ecosystem Report Cards Initial stakeholder meetings identified the immediate need for a more efficient approach to the production of the annual EHMP Report Cards, published by SEQ HWP (EHMP Report Cards, 2009). Currently hard copies of the EHMP Report Cards (that report the ecosystem heath grades for catchments in SEQ) are printed and published annually. The process takes about 5 months with the most time-consuming step being the manual generation of the graphs and Ecosystem Health (EcoH) plots using Photoshop Illustrator. Politicians and planners from 20 different agencies (including the Queensland Environmental Protection Agency), 4 universities, 18 local councils and CSIRO (Commonwealth Scientific and Industrial Research Organisation), use the report cards to make decisions with respect to land use, water quality, allocations and investments in water recycling plants etc. The report cards provide a standardized method for understanding and comparing the health of catchments between regions and over time. To date, these report cards are largely produced manually, via the following process (as documented in (Smith & Grice, 2005)):
1.
2. 3. 4.
5.
Values for each of the 5 indicators (physical/chemical, nutrients, ecosystem processes, aquatic macroinvertebrates and fish) are calculated from the 16 indices recorded for each site and for two seasons (spring and autumn); Index values are compared against Ecosystem Health Guideline values to derive standardised scores that range from 0 (unhealthy) to 1 (healthy); Standardised scores are averaged across combinations of indices, sites and seasons to provide intelligible summaries for catchments and seasons; Graphical summaries of results are produced to enable the comparison of indices and indicators across reporting areas and between seasons: box and whisker plots, horizontal bar charts, and Ecosystem Health plots (EcoH plots). Summarisations of the EHMP results culminate in a report card grade from A to F.
For the past 6 months, we have been working with the SEQ-HWP staff who are responsible for generating the annual ecosystem report cards. The outcome is a set of software services that enable the report cards to be generated dynamically via R statistical processing tools and a Web-based mapping interface, overlaid on the integrated datasets. Figure 7 (below) shows the results of our collaboration. The interactive map interface enables users to select: Spatial regions of interest (e.g., particular catchments or sites) through a mapping interface (GoogleEarth or Microsoft VirtualEarth) ; Seasons and years of interest through a timeline; Concepts or indicators of interest through the EHMP Ontology.
Figure 7. GoogleEarth Interface to Online Ecosystem Report Cards A Report Card Grade is generated annually for each catchment, estuary and bay region. Clicking on a grade, displays the corresponding EcoH plots for the current and previous years (dynamically generated from the 5 indicators in the underlying PostGreSQL database) (See Figure 8). Clicking on an EcoH plot, displays the actual raw data (16 indices) used to generate the indicators and plots. The combined use of PostGIS and R statistical processing services enables fast statistical processing and aggregation of datasets and the dynamic generation of graphical mashups.
Figure 8: EcoH Plots for Bremer Catchment from 2004-2008 As users zoom in via the GoogleEarth interface, the locations of individual monitoring sites in each catchment are displayed. Users have the option to view either the EcoH plots or the raw monitoring data/sample data for individual sites (See Figure 9). Metadata and photos for each monitoring site can also be displayed by selecting the Info menu item. At this stage, these reporting services are only available to partners of SEQ HWP who can access them from the Health-e-Waterways Web Portal via a secure login id and password. In the next 6 months, we plan to implement more complex multi-level access controls that provide the public with high-level access to report card grades whilst SEQ-HWP partners are able to drill down to view very specific monitoring data for individual sites.
Figure 9: EHMP Freshwater Monitoring Data for an Individual Site
Visualizing the Impact of Management Actions In the long term, scientists, resource managers and policy makers want to be able to pose predictive queries such as: "If $10million is invested in landscape restoration works in the Bremer catchment today, what will be the ecosystem health outcomes in 2020?‖ Such predictive queries require the linking of complex models across the length of the waterway (from the upper catchment to middle and lower catchment, the estuary, coast and bay), so users can understand and simulate how changes propagate through the water flow cycle. Although such models are currently under development for SEQ, they are not yet at a stage where they can accurately predict the impact of
management actions on ecosystem indicators. More comprehensive and longer-term monitoring data is required for calibration and validation of the models which also require significant time and computational power to execute. In the meantime however, we are able to quickly and easily display management actions associated with a particular region, alongside the corresponding ecosystem health trends for that region. Figure 10 illustrates such a visualization for the Bremer catchment. The management actions are displayed above box plots showing trends for the five freshwater ecosystem health indicators (physical/chemical, nutrients, ecosystem processes, aquatic macroinvertebrates and fish) over the period from 2004-2007. This display provides sufficient information to answer queries such as ―Is the riparian revegetation in the Upper Bremer having any impact on water quality in the Bremer?‖ Figure 10 shows that in the past 3 years, the grade has improved from F to D due to improvements in the physical/chemical, nutrient cycling and fish indicators - presumably as a result of the riparian revegetation.
Figure 10: Juxtaposing Management Actions alongside EHMP Trends for the Bremer Catchment
Discussion The Health-e-Waterways project is still at a relatively early stage (we are currently into the fifth Phase of the seven phases described in the Methodology section), however the outcomes to date include the following components that are either re-usable or can easily be refined, extended and adapted for other regions or similar eco-informatics applications: A dataset registry that (that enables relevant environmental and hydrological data sets to be easily, browsed and discovered) and a set of associated registry services (that enable new datasets to be registered, described, uploaded and published); A set of OWL ontologies that represent ecosystem health monitoring data and management actions as common data models that are machine-processable and facilitate data integration and reasoning; A set of services that automatically map legacy datasets to the OWL data models and store/publish them in the PostGreSQL database; A set of optimized reporting services that can dynamically generate a range of graphical plots showing trends in ecosystem health indicators over time and regions (sites, catchments, estuaries and bay zones) at different levels of granularity and resolution; Flexible Web Map-based user interfaces (using GoogleEarth, Microsoft Bing Maps or Yahoo Maps) that enable water resource managers to interactively visualize and assess the impact of specific management actions on water quality indicators. Evaluation trials to date indicate that the technologies and services we have adopted and developed are delivering significant economic, scientific and environmental benefits. We have held a number of stakeholder meetings and demos to acquire feedback from SEQ-HWP users. These sessions have led to numerous refinements of the system
functionality and user interface. Rigorous Quality Assurance/Quality Control (QA/QC) tests have also been carried out. They identified a number of discrepancies between the legacy data that was manually calculated and our automatically computed results. These discrepancies were primarily due to different approaches in handling missing data and have since been resolved. Feedback from our scientific collaborators within the Environmental Protection Agency (EPA) and Department of Environment and Resource Management (DERM) has been extremely positive. EcoH plots and graphical reports that previously took weeks to generate manually, can now be generated dynamically via the Web interface. Users can immediately access and compare ecosystem health and water quality data over time and across catchments. They can drill down into report card grades to quickly and easily identify which particular parameters are performing badly and the possible causes. The ability to display Management Actions alongside related Ecosystem Health Indicators for a given catchment, enables policy makers to easily identify the impact of specific actions and investments, and to adapt them accordingly. This capability is critical to support the ―Adaptive Management‖ philosophy that underpins the SEQ HWP approach. However further input from the scientific experts panel is required in order to relate specific management actions and sub-actions to particular water quality parameters at specific sites. The current system does not yet take advantage of the inferencing capabilities available through technologies such as SWRL. Semantic and spatial inferencing could be usefully applied to automatically infer the anticipated impact of those actions on sites that are downstream e.g., sites that are downstream from a recently upgraded sewage treatment plant should show reductions in 15N. Ideally the system would intelligently analyse the monitoring data and highlight those management actions that are not having any perceived impact. The ICT framework that we have developed to date is an ongoing development, but the combined use of OWL ontologies and OpenGeoStack means that the system can easily be extended, refined, customized and adapted – to support the needs of different organizations, different regions, different terminologies or different sets of indicators or indices.
Future Work and Conclusions Significant further work and usability studies are required in order to rigorously evaluate the Health-e-Waterways system and refine and enhance its capabilities and functionality. In particular, over the next 12 months we are planning to focus on the following activities: Add ontology-based conceptual querying (using the SPARQL query language) to the GoogleEarth interface to enable more interactive and intuitive querying ―Which management actions are not meeting their targets in Cabbage Tree Estuary?‖ Add inferencing rules and geo-spatial reasoning (using SWRL) to the system to support richer querying ―Which monitoring sites downstream of Rosewood WasteWater Treatment Plant have shown improvements in nutrient cycling in the past year‖ Incorporate new datasets into the system including: near-real-time sensor data, vegetation data, land use data and MODIS (Moderate Resolution Imaging Spectroradiometer) satellite imagery; Develop animations that show the changes in water quality parameters over time and waterflow cycles; Develop simple services to encourage uploading and quality control of community data – the SPIRE project’s Spotter software (SPIRE, 2009) is of particular interest; Establish a Water Wiki for exchange of information between the SEQ-HWP partners; Incorporate annotation services to enable scientific experts to add comments, explanations and interpretations to the report card results and trend analyses; Add support for different levels of access as you zoom in to the data. For example, the specific latitude and longitude of the monitoring sites and the contact details of the individuals collecting the data, should not be displayed to the general public. Establish a model registry that enables users to upload and share models as web services, link them using scientific workflows and execute them over grid computing infrastructure.
Numerous state, national and international agencies are advocating the need for standardized frameworks and procedures for environmental accounting. The Health-e-Waterways system provides an ideal model for delivering a standardized approach to the aggregation of ecosystem health monitoring data and the generation of dynamic, interactive reports (that incorporate links back to the raw data sets). The recent development of a ―Management Action‖ ontology, now enables users to link management actions to monitoring data, to identify which actions and investments are having the most impact. The system we have described here will not only save agencies significant time and money in generating environmental accounts, but it can be used to guide and adapt regional, state and national environmental policies and water resource management decisions.
References Abal E. G., Greenfield P. F., Bunn S. E. & Tarte D. M. (2006). Healthy Waterways: Healthy Catchments –An Integrated Research/Management Program to Understand and Reduce Impacts of Sediments and Nutrients on Waterways in Queensland, Australia. Frontiers of WWW Research and Development – Proceedings of APWeb 2006: 8th Asia-Pacific Web Conference, Harbin, China, January 16-18 (pp. 1126-1135). Bunn S., Abal E., Greenfield P., & Tarte D. (2007). ―Making the connection between healthy waterways and healthy catchments: South east Queensland, Australia‖, Water Science and Technology: Water Supply, Vol 7(2), pp 93-100. Chau, K.W. (2007). ―An ontology-based knowledge management system for flow and water quality modeling,‖ Advances in Engineering Software, Vol. 38, No. 3, 2007, pp. 172-181. CUAHSI (2009). Hydrological Information System (HIS). Retrieved March 8, 2010, from http://his.cuahsi.org/ Ecosystem Health Monitoring Program (EHMP) (2010). Retrieved March 8, 2010, from http://www.ehmp.org/. Ecosystem Health Monitoring Program (EHMP) Annual Report Cards (2009). Retrieved March 8, 2010, from http://www.healthywaterways.org/EcosystemHealthMonitoringProgram/ProductsandPublications/AnnualReportCards.aspx Fitzgerald A. & Long,A. (2008). ―OAK Law Project Report - A Review and Analysis of Academic Publishing Agreements and Open Access Policies‖, February 2008. Retrieved March 8, 2010, from http://www.oaklist.qut.edu.au/files/OAK_Law_Review_and_Analysis_v1_20080212.pdf Horsburgh, J. S., Tarboton, D. G. Maidment D. R. & Zaslavsky, I. (2008). ―A Relational Model for Environmental and Water Resources Data,‖ Water Resources Research, 44: W05406, doi:10.1029/2007WR006392. Hunter J. & Mauger, B. (2008). ―Health-e-Waterways Database Survey Report‖, Retrieved March 8, 2010, from http://www.health-e-waterways.org/reports.php. Larsen, G. (2007) ―Modelling hydrodynamic processes within Pumicestone Passage, Northern Moreton Bay, Queensland‖, PhD Thesis. Retrieved March 8, 2010, from http://eprints.qut.edu.au/16634/1/Genevieve_Larsen_Thesis.pdf Lee J.H.W., Huang, Y., Dickman M., & Jayawardena A.W. (2003), ―Neural Network modelling of coastal algal blooms‖, Ecological Modelling, Volume 159, Issue 2-3, pp179-201. Liu, Y., Hill, D. Rodrigues, A. Marini, L. Kooper, R., Myers, J., Wu, X. & Minsker B. (2009), “A New Framework for OnDemand Virtualization, Repurposing and Fusion of Heterogeneous Sensors‖, Sensor Web Enablement Workshop 2009, The 2009 International Symposium on Collaborative Technologies and Systems , May 18-22, 2009, Baltimore, MD Madin, J., Bowers, S., Schildhauer, M., Krivov, S., Pennington, D. & Villa, F. (2007), "An Ontology for Describing and Synthesizing Ecological Observation Data." Ecological Informatics 2(3), pp 279-296. Montgomery, J.L., Harmon, T., Kaiser, W., Sanderson, A., Haas, C.N., Hooper, R., Minsker, B., Schnoor, J. Clesceri, N.L. Graham W. & Brezonik, P. (2007), "The WATERS Network: An integrated environmental observatory network for water research," Environ. Sci. Technol., vol. 41, pp. 6642-6647. Muttil, N. & Chau, K.W. (2007), ―Machine learning paradigms for selecting ecologically significant input variables,‖ Engineering Applications of Artificial Intelligence, Vol. 20, No. 6, pp. 735-744. Muttil, N. & Chau, K.W. (2006), ―Neural network and genetic programming for modelling coastal algal blooms,‖ International Journal of Environment and Pollution, Vol. 28, No. 3-4, pp. 223-238. Open Geospatial Consortium (OGC) (2009) Observations and Measurements Retrieved March 8, 2010, from http://www.opengeospatial.org/standards/om.
O’Hagan, R., Atkinson, R., Cox, S., Fitch, P., Lemon, D. & Walker, G. (2007), ―A Reference Model for a Water Resources Observation Network‖, MODSIM07, New Zealand, 2007 SEEK KR Ontologies (2006) Retrieved March 8, 2010, from http://seek.ecoinformatics.org/Wiki.jsp?page=KROntologies. Smith M. & Storey, A.W. (2001). ―Design and Implementation of Baseline Monitoring (DIBM3): Developing an Ecosystem Health Monitoring Program for Rivers and Streams in Southeast Queensland‖. Report to the South East Queensland Regional Water Quality Management Strategy, Brisbane. Smith M. & Grice A. (2005). ―Ecosystem Health Monitoring Program‖. In: E. G. Abal, S. E. Bunn and W. C. Dennison, Healthy Waterways, Healthy Catchments: Making the connection in south east Queensland. Moreton Bay and Catchments Partnership, Brisbane Queensland. pp 149-182. South East Queensland Healthy Waterways Partnership (SEQ HWP) (2009) Retrieved March 8, 2010, from http://www.healthywaterways.org/. Spire Research Group, Spire: Ontology Tool (SPOTTER) (2010), Retrieved March 8, 2010, from http://spire.umbc.edu/spotter/ SWEET (2009), Semantic Web for Earth and Environmental Terminology Retrieved March 8, 2010, from http://sweet.jpl.nasa.gov/. Wu, C.L. & Chau, K.W. (2006) ―Mathematical model of water quality rehabilitation with rainwater utilization — a case study at Haigang,‖ International Journal of Environment and Pollution, Vol. 28, No. 3-4, pp. 534-545. Zhao, M.Y., Cheng, C.T., Chau, K.W. & Li, G. (2006), ―Multiple criteria data envelopment analysis for full ranking units associated to environment impact assessment,‖ International Journal of Environment and Pollution, Vol. 28, No. 3-4, pp. 448464.