Teachers need other performance indicators, related to statewide tests, that ..... dents received speech or language services, and 2 students received both ...
EDUCATIONAL ASSESSMENT, 7(4), 303–323 Copyright © 2001, Lawrence Erlbaum Associates, Inc.
Using Oral Reading Rate to Predict Student Performance on Statewide Achievement Tests Lindy Crawford, Gerald Tindal, and Steve Stieber College of Education University of Oregon
In this study, a curriculum-based measurement (CBM) of reading aloud from narrative passages was used to predict performance on statewide achievement tests in reading and math. Scores on multiple-choice reading and math achievement tests were moderately correlated with scores on rate measures during the same year and rate measures administered 1 year previously. The results provide initial support for use of timed oral readings to predict students’ performance on statewide achievement tests. Usefulness of CBM in monitoring students’ progress toward preestablished benchmarks is supported, as well as the stability of the measures over time. Results are interpreted as a new application of research conducted on CBM during the past 2 decades.
Current educational reform efforts emphasize increases in student performance as demonstrated by scores on criterion-referenced statewide achievement tests. Often, these tests are administered on an infrequent basis, providing teachers with limited information about students’ ongoing progress toward mastering academic benchmarks. Furthermore, statewide achievement tests fail to provide teachers with diagnostic information related to student attainment of specific instructional goals. Despite these limitations, data from statewide tests are used to make high-stakes decisions about students’ academic proficiency. The widespread adoption of statewide tests, as well as the importance placed on test results, makes it imperative that students’ academic progress be closely monitored through the use of other measurement systems for at least four reasons:
Requests for reprints should be sent to Lindy Crawford, Educational Leadership, 5267 University of Oregon, Eugene, OR 97403–5262.
304
CRAWFORD, TINDAL, STIEBER
1. Statewide testing programs often involve a format that is difficult for teachers to replicate at the classroom level. 2. Decisions being made are so important that other confirming information is needed to complement the data. 3. Teachers need other performance indicators, related to statewide tests, that are available more frequently so that instructional programs can be improved in a timely fashion. 4. Statewide tests may be insensitive to change for low-performing students. For these reasons, we believe teachers need to adopt measurement systems capable of providing valid progress-monitoring data about the academic gains made by students. Such data would not replace statewide tests; rather, they would empower teachers to better utilize the outcomes from statewide tests. One progress-monitoring system with proven reliability and validity is curriculum-based measurement (CBM; Deno, 1985). CBM employs a set of standardized procedures to directly monitor students’ academic behavior over time (Deno, 1985). Research on CBM began approximately 20 years ago at the Institute for Research on Learning Disabilities at the University of Minnesota. In the early work, guided by Stan Deno, research focused on empirically validating performance measures that reflected several key features. 1. Each task had to be administered in a relatively brief time so students could be assessed frequently, as often as daily. 2. Tasks had to be easy to create with comparable alternate forms. 3. Several different individuals (teachers, instructional assistants, and parents) needed to be proficient in administering tasks, thereby requiring tasks to be easy to learn as well as reliable. In the area of reading, initial research supported the reliability and validity of CBM (Deno, 1985), and since then numerous studies have verified and expanded on these initial findings (Marston, 1989). For example, some research studies have demonstrated the usefulness of CBM for monitoring the reading progress of students to change instructional programs (Bradley-Klug, Shapiro, Lutz, & DuPaul, 1998; Fuchs, Deno, & Mirkin, 1984; Marston & Magnusson, 1985), and results of other studies have supported the use of CBM as a measure of reading comprehension (Fuchs, Fuchs, & Maxwell, 1988) and early literacy skills (Kaminski & Good, 1996). Over the past two decades, many teachers have used CBM to document improvement (or the lack thereof) in students’ rate of oral reading. Administration procedures are easy and very efficient. Typically, a student is presented with an intact passage to read and prompted to read aloud for 1 min during which the student’s correct words are tallied and errors are recorded. Students are usually timed
ORAL READING RATE AND STATEWIDE TESTS
305
on three different passages, and the median score for the three passages is reported. Data collected from these measures of reading rate are often used to inform a broad range of educational decisions including progress monitoring (Germann & Tindal, 1985), prereferral identification of students (Shinn, 1989), and classification decisions (Marston, Deno, & Tindal, 1983). In this study, we propose that expanding the use of CBM beyond classification determination and instructional decision making and into the realm of accountability assessment is a logical next step in its evolution as a useful and reliable classroom-based assessment system.
STUDY GOALS AND USE OF CBM This study generated longitudinal data on a cohort of students over 2 years as they progressed from second to third grade. Specifically, we analyzed the relationship between students’ rate of oral reading and their scores on statewide achievement tests in reading and math. This study differs from those conducted in the past in which the majority of teachers and researchers using CBM collected data during only 1 school year (see metaanalysis by Fuchs & Fuchs, 1986). Relatively few studies have reported on the collection of CBM data over multiple years (see, e.g., Dong-il, 1998). In this study, we proposed two research questions. The first question is “How strong is the relationship between oral reading rate and future performance on statewide reading and math achievement tests?” We focus on both skill areas for three reasons: (a) Math multiple-choice achievement tests require proficient reading skills, (b) earlier research has demonstrated that reading achievement is a strong predictor of math achievement (McGrew & Pehl, 1988; Roach, 1981), and (c) initial research on accommodations indicates that reading math multiple-choice tests aloud may help students with reading problems (Tindal, Heath, Hollenbeck, Almond, & Harniss, 1998). Furthermore, relatively little research has explored the use of CBM in predicting students’ mastery on criterion-referenced statewide achievement tests (Helwig & Tindal, 1999; Nolet & McLaughlin, 1997). Evidence of a strong relation between scores on the timed oral readings and scores on the criterion-referenced statewide achievement tests will help expand the use of CBM for predicting students’ attainment of preestablished academic benchmarks. Our second research question is “What levels of oral reading rate in the second and third grades best predict students’ scores on statewide reading and math tests in the third grade?” An answer to this research question may assist teachers in the identification of students needing more intensive instruction far in advance of their actual participation in statewide tests. Furthermore, establishing a range of reading rates that strongly predict students’ scores on statewide tests will provide teachers
306
CRAWFORD, TINDAL, STIEBER
with classroom-based information that can be frequently collected and used to adjust instruction. Technical Adequacy of CBM The validity of CBM in reading has been well established in a multitude of educational contexts using various norm-referenced achievement tests as criterion measures (Marston, 1989). The initial research dealt with reading tests and focused on criterion validity and reliability; later research addressed reading fluency as a predictor of math proficiency on multiple-choice tests.
Criterion validity with reading tests. The first study published by Deno, Mirkin, Chiang, and Lowry (1980) described the relationship among simple measures of reading and performance on standardized achievement tests. In their study, oral reading fluency, representing a count of the number of words read correctly per minute (using either passages or word lists), consistently was the measure with the highest correlation with standardized achievement tests. The authors found that for the 43 participating elementary school-aged students, reading aloud was highly correlated with test performance (r = .78, r = .80). This research was published 2 years later in a special education journal (Deno, Mirkin, & Chiang, 1982). Another study, initially published as a technical report (Fuchs & Deno, 1981), was later published in the professional special education literature (Fuchs, Fuchs, & Deno, 1982) and again validated CBM. Subsequent research on CBM focused primarily on reliability and criterion validity. One of the first follow-up studies was reported by Tindal, Marston, and Deno (1983) who documented the reliability of direct and repeated measures of oral reading rate. They found high coefficients for test–retest (.89–.92), alternate form (.76–.89), and interjudge (.99) reliability. More recent studies have supported earlier findings, strengthening the validity of timed oral reading as a measure of reading achievement. For example, Fuchs et al. (1988) reported that words read correctly in a 1-min sample correlated with the Stanford Achievement Test Reading Comprehension subtest (Gardner, Rudman, Karlsen, & Merwin, 1982) at a level of statistical significance (r = .91, p < .05). Furthermore, the number of words read correctly was also a strong indicator of performance on two other validated CBMs of reading—cloze comprehension tests (passages with every nth word removed, to be supplied by the student), and reading recalls. Marston (1989) summarized much of the criterion validity research, covering 14 separate investigations and many different criterion measures, most of which were published norm-referenced tests. He reported corrlation coefficients ranging from .63 to .90, with correlations clustering around .80. One of the largest studies to compare oral reading fluency with scores on standardized achievement tests was conducted by the National Assessment of Educa-
ORAL READING RATE AND STATEWIDE TESTS
307
tional Progress (NAEP) in 1992. In this study, NAEP assessed a random sample of fourth-grade students (n = 1,136) on reading fluency, defined as the expressiveness and ease of reading—not the rate of reading (United States Department of Education, 1995). NAEP reported that students who read the most fluently (rated 4 on a 4-point scale) scored much higher on standardized tests of reading proficiency than students who read less fluently (rated 1 on a 4-point scale). Data on statistical significance were not reported; however, fluent readers averaged a score of 249 on the reading proficiency tests, whereas nonfluent readers averaged a score of 179 (scale = 0–500).
Using reading CBMs to predict math performance. A second area of interest to this study was the relationship between oral reading rate and math achievement. Statewide math tests often consist of multiple-choice questions or problem-solving tasks (Council of Chief State School Officers, 1996) that require a certain level of reading proficiency, and the importance of proficient reading for successful test performance in math has been well established (Clarkson, 1983; Helwig, Rozek-Tedesco, Heath, & Tindal, 1999; Tindal et al., 1998). Espin and Deno (1993) reported low to moderate correlations (r = .32, r = .36) between timed, text-based reading and math achievement as measured by the Tests of Achievement and Proficiency (Scannell, Haugh, Schild, & Ulmer, 1986). However, reading aloud was more strongly correlated with scores on the achievement tests than scores on other classroom measures (comprehension questions and student grade point averages). Interestingly, a large discrepancy was found between correlations obtained with high-performing students (rs = .05 and .13, respectively) and those obtained with low-performing students (rs = .28 and .31, respectively). These discrepancies support the usefulness of timed oral readings in the classroom to closely monitor the progress of low-performing students as they work toward meeting statewide benchmarks in math. Summary. Research on CBM in reading demonstrates a moderate relation between oral reading rate and performance on norm-referenced achievement tests. Furthermore, reading rate is important not only in predicting reading achievement on published tests but also in serving as a measure of an access skill in completing math multiple-choice tests. The aim of this study is to expand on this research by exploring the ability of various reading rates to predict eventual performance on statewide achievement tests. Establishing a critical range of reading rates will extend the use of CBM as a viable classroom tool for monitoring students’ progress toward meeting statewide benchmarks in math. This purpose, however, is supplemented with an interest in extending the predictiveness beyond a single year. To accomplish this outcome, we turn our attention to the CBM literature on progress monitoring.
308
CRAWFORD, TINDAL, STIEBER
Using CBMs in Reading to Monitor Progress Establishing the technical adequacy of any measurement system is an important first step toward its acceptance by researchers and practitioners. The usefulness of any assessment procedure for teachers, however, often is judged by its ability to detect student growth. The CBM practice of timed oral reading has demonstrated its effectiveness in this area. For example, Marston and Magnusson (1985) measured reading progress over a 16-week period of time. The three dependent measures used in the study were scores on timed oral readings and scores on two subtests of the Science Research Associates (SRA) Achievement Series: vocabulary and comprehension (Naslund, Thorpe, & Lefever, 1978). The authors used correlated t tests to analyze student gains on all three measures and reported that scores obtained on timed oral readings were the most sensitive to student progress, p = .001. The SRA vocabulary test also demonstrated the ability to detect student progress, p = .01, whereas the SRA comprehension test did not reveal any significant differences. In a similar study, Marston et al. (1983) found that CBMs in reading were more sensitive to student growth than were norm-referenced achievement tests. The CBM in this study was a grade-level word list read by low-achieving students in Grades 3 to 6 during a 1-min period of time. The standardized test was the Stanford Achievement Test (SAT) reading comprehension subtest (Madden, Gardner, Rudman, Karlsen, & Merwin, 1978). Students completed both measures at the beginning of the study and then completed the same measures 10 weeks later. Using a paired t test analysis with effect size as the dependent variable, the authors found significant differences between the gains students made on the CBM in reading and the gains made on the SAT reading comprehension subtest, p < .001. Finally, studies conducted by Fuchs, Tindal, and Deno (1981) and Tindal and Deno (1981) focused on the sensitivity of oral reading rate to change over relatively brief periods of time. In both studies, researchers constructed word lists for sampling two domains (one at the grade level of the student and the other across grade levels). Findings from both studies indicated that the size of the domain (within or across grade levels) did not significantly affect results and that “a daily measurement system may be developed for reading instruction that can be used over an extended period of time without having to be revised or changed” (Tindal & Deno, 1981, pp. 9–10). Numerous other studies also have supported the use of CBM for progress monitoring and the evaluation of instructional outcomes (for a review see Tindal, 1988, 1998). It appears that CBM in reading may be an effective tool for teachers to use in monitoring growth. Some of this research is oriented toward revealing changes in short periods of time, and some of it is focused on adjusting instructional programs in a formative evaluation system. Any such use, however, requires that
ORAL READING RATE AND STATEWIDE TESTS
309
student behavior not be affected by irrelevant passage variance. In the context of generalizability, the changes in performance should be a function of the student, and not the task or the rater. Therefore, in designing this study, we were cognizant of the previous research that has been conducted on CBM in this area, and we briefly review it in the following section.
Research on Task Sampling A key issue to emerge in the early work on reading fluency was the need for ascertaining the effects of sampling reading passages drawn from diverse curriculum materials. In a study using oral reading rate as the outcome measure and slope over time as the metric, Tindal, Flick, and Cole (1993) looked at growth in several special education reading programs: Reading Mastery II® (Bruner, 1983), Reading Mastery III® (Bruner & Hanner, 1982), Distar I® (Englemann & Bruner, 1974), and Merrill Linguistic Readers® (Wilson & Rudolph, 1980). Students also were monitored over time in the reading materials used in general education in Scribner® (Cassidy, Roettger, & Wixson, 1987). They reported that “in general, few differences appear in oral reading fluency as a function of curriculum sampling” (p. 6). Fuchs and Deno (1992) conducted a study with a similar focus on curriculum differences but used a different methodology. Using measures of oral reading rate based on two different curricula (Ginn and Company, 1976; Scott-Foresman Systems, 1976), they reported similar correlations between each of these programs and a criterion measure—the Woodcock Reading Mastery Tests (Woodcock, 1973). Neither curriculum nor passage difficulty affected the correlation between the measures. An important additional outcome was that growth rates were similar and strong “when calculated on students’ scores from contrasting reading levels and series” (p. 240). Given this research, a later question addressed by Fuchs and Deno (1994) focused on whether testing material had to be drawn from the student’s instructional curricula to be “curriculum-based.” In a very persuasive manner, they reviewed the research and rejected the requirement for drawing test samples from instructional text as a necessary characteristic of CBM (sic). In summary, we approached this study from the perspective that CBMs in reading should serve us well in predicting reading performance on a statewide test. Furthermore, such measures of oral reading rate may be useful in making predictions of performance on a math multiple-choice test. Finally, given the stability of measures created from different curricula and the tendency of CBM to be sensitive to changes in student performance, we expected measuring students’ reading rates across 2 successive years to provide reliable as well as useful information.
310
CRAWFORD, TINDAL, STIEBER
METHOD Participants In this section, we describe both students and teachers. The setting for the study was a nongraded developmental program, so all students stayed with the same teachers for each of the 2 years.
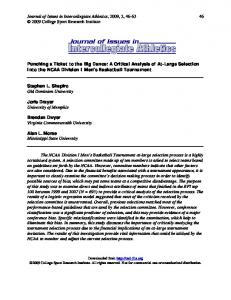
Students. Participants for this study represented six blended classrooms, consisting of second- and third-grade students. Classrooms were located within one rural school district in western Oregon. A total of 77 second-grade students participated in Year 1 of the study. Fifty-one of these students also participated as third-graders (Year 2). The study includes only the 51 students who participated in both years. Twenty-nine of these students were girls and 22 were boys, and they represented a sample that was predominantly White (94%). The majority of students were in general education (n = 42). Out of the 9 students receiving special education services, 4 students received assistance in at least one academic area, 3 students received speech or language services, and 2 students received both academic assistance and speech or language services. Students classified as special education students received most of their instruction in the general education classroom. Teachers. Six general education teachers and two specialists volunteered to participate in the study. Five of the general education teachers had at least 10 years teaching experience, and the two specialists had an average of 8 years of teaching experience. All of the teachers had their elementary teaching certifications with no additional endorsements. One specialist had a master of education degree, and the other specialist had a bachelor of arts degree. Measures To assess students’ reading rates, we chose three passages for use during each year of the study. Passages from the Houghton Mifflin Basal Reading Series (1989) were modified to contain approximately 200 to 250 words and to have cogent beginning and endings. See Figure 1 for an example of an examiner’s copy of a passage (student copies contained text only). Passages used in Year 1 were randomly selected from the second-grade basal reader, and passages used in Year 2 were randomly selected from the third-grade basal reader. We sampled passages from the Houghton Mifflin series because it had been adopted by the district and previously used in schools participating in the study. When deciding which curriculum to use, we relied on previous research demonstrating that passages drawn from a diverse sampling domain are comparable in their ability to measure reading rate as well as detect growth.
ORAL READING RATE AND STATEWIDE TESTS
311
FIGURE 1 Examiner’s copy of a reading passage, “A Special Trade” by Sally Wittman (Houghton Mifflin-Discoveries). Original version published by Harper Collins. Reprinted with permission.
Data derived from CBM in reading are reported as being very stable across large normative samples. For example, Hasbrouck and Tindal (1992) reported a median score for second-grade students, reading in the spring, of 94 words per minute (SD = 39), and Marston and Magnusson (1988) reported a mean score for second-grade students, reading in the spring, of 82 words per minute (SD = 39). A smaller but more recent study, consisting of 693 second-grade students, reported a mean reading rate
312
CRAWFORD, TINDAL, STIEBER
for students in the spring of 100 words per minute (SD = 47) and a standard error of measurement of 1.8 (Tindal, 2001). In all of these studies, the standard deviation was reported as being approximately one half of the mean score.
Test administration and scoring. CBM testing occurred on 1 day in January of each year of the study. Participating students were asked to orally read a set of three different passages to their teachers. Students were timed for 1 min on each passage, which was then scored by calculating correct words read per minute. A correct word was defined as any word read correctly, or self-corrected. An error was defined as any word read incorrectly, including word substitutions, or words supplied by the teacher. Word insertions or repetitions were ignored. Once the three passages were read and scored, totals were entered into a database, and an average score was calculated for the analyses in this study. Participating teachers were trained on how to administer and score the CBM during a 4-hr workshop in the fall of Year 1. Researchers for the study modeled administration and scoring procedures, and teachers practiced the techniques with a peer in a role-playing scenario. Each teacher was observed for accuracy of administration and scoring, and all were coached until they were proficient. In Year 2, test administration and scoring were reviewed with each teacher. Statewide testing. In March of the 2nd year of the study, third-grade students also were tested on statewide math and reading assessments—both were criterion-referenced tests containing multiple-choice questions and performance tasks (Oregon Department of Education, 1999). Results of the multiple-choice sections of the statewide reading and math tests are reported in standardized scores on a Rasch scale. The technical adequacy of the reading and the mathematics multiple-choice tests was included in a report dated from 1989 to 1992 (Oregon Department of Education, 1992). In this report, internal consistency for the third-grade reading test was .94 and .96 for 1991 and 1992, and .94 for each of these years in fifth grade. The internal consistency in mathematics for these same years was .95 and .96 in third grade and .94 and .96 in fifth grade. The standard error of measurement across forms for the 1991 test administration in reading ranged from 3.6 to 3.8 in third grade and 3.8 to 4.0 in fifth grade. The data in 1992 were comparable (3.9–4.1 in third grade and 4.0–4.2 in fifth grade). In mathematics for the 1991 administration, the SEM across forms was 3.2 to 3.3 in third grade and 3.3 to 3.4 in fifth grade. Slightly higher SEMs were reported in 1992: 3.4 to 3.5 for third grade and 3.5 to 3.6 for fifth grade. Data Analyses Descriptive statistics provide information related to group means for timed oral readings and for passing scores on the statewide math and reading assessments. Indi-
ORAL READING RATE AND STATEWIDE TESTS
313
vidual student gains in reading rate also are reported. We conducted three other analyses. The first analysis explored the correlation between the scores obtained on both measures within Year 2 (when students were in third grade). The second analysis used the scores obtained on timed oral readings in Year 1 (when students were in second grade) to predict scores obtained on the statewide tests during Year 2 of the study (when students were in third grade). Our third analysis explored the relation between students’ second-grade and third-grade reading rates and their performance on the statewide achievement tests using chi-square statistics.
RESULTS Three types of outcome are reported. First, descriptive statistics are reported for Year 1 and Year 2. Second, correlations between the timed oral readings and the statewide reading and math tests are reported. Third, chi-square analyses are preTABLE 1 Means and Standard Deviations for Study Variables Range Variable 3rd-Grade statewide reading assessment 3rd-Grade statewide math assessment 2nd-Grade correct words per minute 3rd-Grade correct words per minute Note.
M
SD
Min.
Max.
SEM
202.5
12.4
172
235
200.1
9.9
179
230
62.3
32.6
7
140
4.6
103.8
38.6
15
190
5.4
Scores on statewide assessments represent Rasch scale scores: N= 51.
TABLE 2 Correlations Between Correct Words per Minute and Statewide Reading and Math Assessments
Grade 3 CWPM Statewide reading assessment Statewide math assessment Note. minute.
Reading Assessment
Grade 3 CWPM
Grade 2 CWPM
— — .64
— .60 .46
.84 .66 .53
All correlations are significantly different from zero: N = 51. CWPM = Correct words per
314
CRAWFORD, TINDAL, STIEBER
sented, allowing us to determine which levels of oral reading rates are most predictive of performance on the statewide tests. Descriptive Statistics The means and standard deviations for the study variables are reported in Table 1. Results show that the mean for scores on the statewide reading assessment met the state-established criterion for a passing score (set at 201). However, the mean for scores on the statewide math assessment fell short of the established criterion by 2 points (set at 202). Scores ranged from 172 to 235 on the reading test and 179 to 230 on the math test. Out of the 51 students with scores reported, representing all students in the study, 65% passed the reading assessment, and 45% passed the math assessment. The data also show evidence of a large increase in the number of correct words read per minute by students in third grade compared to the number of correct words read the previous year. The mean gain in oral reading rate was approximately 42 correct words per minute. At the individual student level, 48 of the students made gains of 10 words per minute or more in oral reading rate between second and third grade, with 2 students gaining less than 10 words per minute, and only 1 student losing ground (–7 words per minute). There was no relationship between initial reading rate and amount of gain (r = –.003). Reading and Math Correlations A Pearson correlation coefficient was calculated between second- and third-grade oral reading rates, revealing a strong relationship (r = .84). Next, we calculated correlations to examine the association between students’ performance on the reading test in third grade and the number of correct words read per minute on timed oral readings (see Table 2). This relationship was moderate with correlations between second-grade timed oral readings and state scores slightly higher than those obtained in the third grade. Correlation coefficients for students’ performance on the math test in the third grade and their timed oral reading scores also were moderate, with the across-years correlation slightly higher than the within-year correlation. We found no significant differences between the within-year, and across-years correlations (Howell, 1987). Chi-Square Analyses To assess the ability of CBM in differentiating between students who passed or did not pass the statewide reading test, we constructed a 2 × 4 classification table for the within-year scores, and another for the across-years scores. We relied on previously established normative data to determine the values of each cell. Hasbrouck
315
ORAL READING RATE AND STATEWIDE TESTS
and Tindal (1992) collected normative data on 9,164 students across four grade levels. Their results are often cited when interpreting results of other CBM studies (Nolet & McLaughlin, 1997) and have been used by published curriculum materials (Read Naturally, 1999). Due to the broad acceptance of the validity of the Hasbrouck and Tindal norms, and the relatively small sample size reflected in this study, we decided to use their norms to create a context for interpreting our scores. The within-year data are reported in Table 3. In the norms established by Hasbrouck and Tindal (1992), students reading below the 25th percentile in the winter of third grade read between 0 to 70 correct words per minute. We used these rates to establish our first cell. The remaining three cells in our study reflect the remaining three quartiles in Hasbrouck and Tindal’s study and are represented by the following rates: (a) second cell, 71 to 92 correct words per minute; (b) third cell, 93 to 122 correct words per minute; and (c) fourth cell, 123 or more correct words per minute.
Reading. The within-year data highlight a general pattern between students’ reading rates and their scores on the statewide reading test. The strongest finding is that 81% of students reading at the third and fourth quartiles passed the statewide asTABLE 3 Within-Year Classification Table (Third-Grade CWPM to Third-Grade Statewide Reading Assessment) Correct Words per Minute 0 - 70 1 - 92 93 - 122 123 + Note.
N
Fails to Meet State Standard in Reading
%
Meets/Exceeds State Standard in Reading
%
7 12 16 16
5 7 5 1
9.8 13.7 9.8 2.0
2 5 11 15
3.9 9.8 21.6 29.4
N = 51. CWPM = Correct words per minute.
TABLE 4 Across-Years Classification Table (Second-Grade CWPM to Third-Grade Statewide Reading Assessment)
Correct Words per Minute 0 - 46 47 - 77 78 - 105 106 + Note.
N
Fails to Meet State Standard in Reading
14 21 11 5
10 8 0 0
N = 51. CWPM = Correct words per minute.
%
Meets/Exceeds State Standard in Reading
%
19.6 7.8 0 0
4 13 11 5
7.8 25.5 21.6 9.8
316
CRAWFORD, TINDAL, STIEBER
sessment. For third-grade students, 119 correct words per minute was the critical rate needed to pass the statewide reading test, evidenced by the fact that 94% of students reading more than 119 words per minute passed (16 of 17 students). A chi-square of 12.8 was calculated on the cells representing third-grade reading rates and the statewide reading test scores, demonstrating statistical significance, p = .005. The across-years data are reported in Table 4. In the norms established by Hasbrouck and Tindal (1992), students reading below the 25th percentile in the winter of second grade read between 0 to 46 words per minute. We used these rates to establish our first cell value. The remaining three cells in our study reflect the remaining three quartiles in Hasbrouck and Tindal’s study and are represented by the following rates: (a) second cell, 47 to 77 correct words per minute; (b) third cell, 78 to 105 correct words per minute; and (c) fourth cell, 106 or more correct words per minute. In the across-years analysis, oral reading rate parallels categories represented by the two levels of statewide test scores. Of the 37 students reading in the top three quartiles, 29 passed the statewide reading test (78%), whereas only 29% of the students reading in the first quartile passed. Of the students reading at least 72 correct words per minute in second grade, 100% passed the statewide reading test in third grade. A chi-square of 16.8 was calculated on the cells representing second-grade reading rates and the reading statewide test scores, demonstrating statistical significance, p = .001.
Math. We also constructed a classification table to explore the relation between reading rates and math test scores for the within-year and the across-years data. We used the same normative data to determine the values of each cell as were used in the reading analysis. The within-year data reported in Table 5 failed to generate definitive patterns between rates of reading and scores on the statewide math test. On rate measures, approximately twice as many students in the lowest two quartiles failed the math TABLE 5 Within-Year Classification Table (Third-Grade CWPM to Third-Grade Statewide Math Assessment)
Correct Words per Minute 0 - 70 71 - 92 93 - 122 123 + Note.
N
Fails to Meet State Standard in Math
7 12 16 16
4 9 7 6
N = 51. CWPM = Correct words per minute.
%
Meets/Exceeds State Standard in Math
%
7.8 17.6 13.7 11.8
3 3 9 10
5.9 5.9 17.6 19.6
317
ORAL READING RATE AND STATEWIDE TESTS
TABLE 6 Across-Years Classification Table (Second-Grade CWPM to Third-Grade Statewide Math Assessment)
Correct Words per Minute 0 - 46 47 - 77 7 8 - 105 106 + Note.
N
Fails to Meet State Standard in Math
14 21 11 5
10 11 4 1
%
Meets/Exceeds State Standard in Math
%
19.6 21.6 7.8 2.0
4 10 7 4
7.8 19.6 13.7 7.8
N= 51. CWPM = Correct words per minute.
test compared to the number who passed it. The opposite pattern is not as readily apparent in Quartiles 3 and 4, although more students passed the math test (n = 19) than failed it (n = 13). A chi-square of 4.4 was calculatedon the cells representing third-grade reading rates and the statewide math test scores, confirming a lack of statistical significance. The across-years data are reported in Table 6. In the across-years analysis, only 29% of those students reading in the first quartile in the second grade passed the math statewide assessment in the third grade, and approximately 50% of students in the second quartile passed. In the third quartile, 64% of students passed the statewide math test, and in the fourth and highest quartile, 80% passed. A chi-square of 5.2 was calculated onthe cells representing second-grade reading rates and third-grade math test scores, demonstrating no statistical significance.
DISCUSSION Interpretation of Results In this study, students’ rate of oral reading increased substantially from second to third grade, with an average gain of 42 correct words per minute. Gains in reading rate for students in this study align with previous research showing that younger students increase their reading rate at a much faster pace than older students (Fuchs, Fuchs, Hamlett, Waltz, & Germann, 1993). The primary years of schooling are heralded as being those most important for making progress in reading, and researchers have reported that students who can read well in first grade continue to do so, but students who do not read well have little chance of becoming proficient readers (Juel, 1988). On this note, a positive finding is that only 3 students made less than a 10 correct words-per-minute gain over the course of 1 year. An interesting finding is the lack of relation between initial reading rate and gains made in rate. For example, a student who read poorly did not make much
318
CRAWFORD, TINDAL, STIEBER
better or much worse progress than a student who read well during the 1st year of the study. This finding highlights the robustness of CBM, reaffirming earlier research reporting on CBM’s stability as a performance assessment across different populations of students (Marston & Magnusson, 1985). It also explains why there was relatively little movement between students’ normative rankings even though 98% of students made gains in reading rate. For example, students who read poorly in second grade made gains but not enough to change the distribution, remaining for the most part (86%) within the quartile in which they started or advancing only one quartile. The outlook is better for students who show some proficiency in the second grade, as approximately 70% of these students increased at least one quartile over the course of the study. A strong correlation exists between timed oral reading rates for students in second grade and their reading rates in third grade. This finding confirms the stability of CBM sampled from a large domain. We also found that rates obtained on timed oral readings were moderately correlated with scores obtained on criterion-referenced reading and math tests. The within-year results of this study are similar to results presented by Jenkins and Jewell (1993) who reported correlations ranging from .60 to .87 between read aloud measures and scores obtained on the Metropolitan Achievement Test (Prescott, Balow, Hogan, & Farr, 1984) for third-grade students. Of particular interest is the strength of the across-years correlations. Although differences between the within-year and across-years correlations were not statistically significant, the across-years’ correlation was stronger for both measures— reading and math. The correlation between oral reading rate and success on the math test is not surprising. The ability to read proficiently is essential to perform various tasks in math (Aaron, 1968), and proficient reading is necessary to access information presented on math tests containing word problems (Helwig et al., 1999). Because demands on the math portion of any large-scale test consisting of multiple-choice questions require a certain level of reading skill, it is logical that good readers do well and poor readers do poorly. Analyzing differences across the oral reading rates of individual students provided us a context for interpreting correlations. For example, the same correlations might have been obtained even if students made no growth over the course of the study, but this was not the case in our study, in which students made substantial gains in their rate of reading while retaining their normative ranking. The nonparametric analyses reveals a significant relation between reading rate and test performance on a statewide reading test. These findings align with the moderate correlations reported, as well as support new efforts for using CBM data to support current accountability efforts. Two important findings emerge from the nonparametric within-year analysis. First, 81% of students reading at the 50th percentile and above (as established by
ORAL READING RATE AND STATEWIDE TESTS
319
Hasbrouck & Tindal’s, 1992, norms) passed the statewide reading test. Second, in our study, a reading rate of 119 words per minute virtually ensured that a student passed the statewide reading test. In the across-years analysis, the most critical finding is that 100% of the students reading at least 72 correct words per minute in second grade passed the statewide reading test in third grade. In math, findings from the same set of analyses were not significant. Perhaps the most interesting finding in math is that 82% of the students reading at or below 54 correct words per minute (18 out of 22 students) in the second grade failed the statewide math test in the following year. Finally, interpretation of these results is tempered by some of the study’s methodological weaknesses. One limitation of the study is that all measures were administered by participating teachers. Although teachers were trained in the administration of reading timings and proficient in the administration of the statewide test, no formal reliability checks were performed to assure standardization. However, because students received their education in blended classrooms, the same teachers collected data for both years of the study. Any bias that may have occurred would have affected the strength of the overall correlations, but not the differences between the correlations. For example, if teachers were weak in their standard administration of timed oral readings during Year 1 of the study, they were probably weak during Year 2 of the study; thus reducing the reliability of the overall correlations, but not directly impacting the differences in the within-year, and across-years correlations. A small sample size is another limitation of this study. Because we wanted to make longitudinal comparisons, we chose to include only those 51 students who participated in both years. Our small sample size increased the standard error of measurement and tempers our ability to generalize findings to a larger population. Construction of the classification tables also warrants caution. We assigned cell values based on normative data generated from previous research. Research on the comparability of passages from a variety of sampling domains lends support to this decision; however, the analyses generated by our classification tables could have been strengthened by creating distinct normative data based on materials used in this study (requiring a larger, randomized sample). As it was, the mean reading rates of students in this study and the median reading rates of students reported in the Hasbrouck and Tindal (1992) study were different. For example, the mean reading rate for second-grade students in this study exceeded the median of 78 correct words per minute established by Hasbrouck and Tindal, whereas the mean reading rate of third graders in this study was lower than Hasbrouck and Tindal’s previously reported 93 correct words per minute.
320
CRAWFORD, TINDAL, STIEBER
CONCLUSIONS In this study, we extended the conditions of use of CBM into the arena of criterion-referenced statewide achievement tests, further supporting its use as a measurement tool capable of providing information about students’ current performance as well as their future performance. The longitudinal data presented in this study demonstrate that CBMs are sensitive enough to detect growth for almost every student, with 50 out of 51 students in this study improving their rate of reading over the course of one year. CBM procedures also seemed to lack bias in that the gains students made on the measures were not an artifact of their starting points, as we found no significant differences between the amount of gain made by students who had low initial rates and those that had high initial rates. Our results demonstrate that teachers can rely on the accuracy of CBMs in monitoring the reading progress of all students, regardless of skill level. There are obvious benefits for teachers who use CBM in reading to monitor students’ progress such as the ability to predict students’ future performance on statewide tests. Perhaps the most important finding of this study is the fact that 100% of the second-grade students who read at least 72 correct words per minute passed the statewide reading test taken the following year. In the third grade, 94% of the students reading more than 119 correct words per minute passed the statewide reading test taken during the same year. These clear and simple data communicate powerful information to teachers. We believe that in the clamor for the implementation of statewide tests, it is important that teachers not lose sight of the benefits derived from standardized, classroom-based assessments. ACKNOWLEDGMENTS This project was funded by the U.S. Department of Education (Office of Special Education Programs) through Project DEPARTURE Grant CFDA 84.023R. The opinions expressed herein do not necessarily reflect the position of the U.S. Department of Education or the College of Education at the University of Oregon, and no official endorsement by the department, college, or university should be inferred. We acknowledge Tracey Hall for her leadership in the completion of this project. We also thank participating teachers and students of the Bethel School District, Eugene, OR.
REFERENCES Aaron, I. E. (1968). Reading in mathematics. In V. M. Howes & H. F. Darrow (Eds.), Reading and the elementary school child: Selected readings on programs and practices (pp. 70–74). New York: Macmillan.
ORAL READING RATE AND STATEWIDE TESTS
321
Bradley-Klug, K. L., Shapiro, E. S., Lutz, J. G., & DuPaul, G. J. (1998). Evaluation of oral reading rate as a curriculum-based measure with literature based curriculum. Journal of School Psychology, 36, 183–197. Bruner, E. (1983). Reading mastery II. Chicago: Science Research Associates. Bruner, E., & Hanner, A. (1982). Reading mastery III. Chicago: Science Research Associates. Cassidy, J., Roettger, D., & Wixson, K. K. (1987). Scribner reading series. New York: Scribner. Clarkson, P. (1983). Types of errors made by Papua New Guinean students. Educational Studies in Mathematics, 14, 355–367. Council of Chief State School Officers. (1996). State mathematics and science standards, frameworks, and student assessments: What is the status of development in the 50 states? Retrieved July, 18, 1999, from http://www.ccsso.org/frmwkweb.html Deno, S. L. (1985). Curriculum-based measurement: The emerging alternative. Exceptional Children, 52, 219–232. Deno, S. L., Mirkin, P. K., & Chiang, B. (1982). Identifying valid measures of reading. Exceptional Children, 49, 36–45. Deno, S. L., Mirkin, P. K., Chiang, B., & Lowry, L. (1980). Relationships among simple measures of reading and performance on standardized achievement tests (Res. Rep. No. 20). Minneapolis: University of Minnesota, Institute for Research on Learning Disabilities. Dong-il, K. (1998, April). Specification of growth model and inter-individual differences for students with severe reading difficulties: A case of CBM. Paper presented at the annual meeting of the Council for Exceptional Children, Minneapolis, MN. (ERIC Document Reproduction Service No. ED418553) Englemann, S., & Bruner, E. (1974). Distar I (2nd ed.). Chicago: Science Research Associates. Espin, C. A., & Deno, S. L. (1993). Performance in reading from content area text as an indicator of achievement. Remedial and Special Education, 14, 47–59. Fuchs, L., & Deno, S. (1981). The relationship between curriculum-based mastery measures and standardized achievement tests in reading (Res. Rep. No. 57). Minneapolis: University of Minnesota, Institute for Research on Learning Disabilities. Fuchs, L. S., & Deno, S. L. (1992). Effects of curriculum within curriculum-based measurement. Exceptional Children, 58, 232–243. Fuchs, L. S., & Deno, S. L. (1994). Must instructionally useful performance assessment be based in the curriculum? Exceptional Children, 61,15–24. Fuchs, L. S., Deno, S. L., & Mirkin, P. K. (1984). The effects of frequent curriculum-based measurement and evaluation on pedagogy, student achievement and student awareness of learning. American Educational Research Journal, 21, 449–460. Fuchs, L. S., & Fuchs, D. (1986). Effects of systematic formative evaluation: A meta-analysis. Exceptional Children, 53, 199–208. Fuchs, L. S., Fuchs, D., & Deno, S. L. (1982). Reliability and validity of curriculum-based informal reading inventories. Reading Research Quarterly, 18, 6–26. Fuchs, L. S., Fuchs, D., Hamlett, C. L., Waltz, L., & Germann, G. (1993). Formative evaluation of academic progress: How much growth can we expect? School Psychology Review, 22(1), 27–48. Fuchs, L. S., Fuchs, D., & Maxwell, L. (1988). The validity of informal reading comprehension measures. Remedial and Special Education, 9, 20–28. Fuchs, L., Tindal, G., & Deno, S. (1981). Effects of varying item domain and sample duration on technical characteristics of daily measures in reading (Res. Rep. No. 48). Minneapolis: University of Minnesota, Institute for Research on Learning Disabilities. Gardner, E. F., Rudman, H. C., Karlsen, B., & Merwin, J. C. (1982). Stanford achievement test. Iowa City, IA: Harcourt Brace Jovanovich. Germann, G., & Tindal, G. (1985). An application of curriculum-based measurement: The use of direct and repeated measurement. Exceptional Children, 52, 244–265.
322
CRAWFORD, TINDAL, STIEBER
Ginn and Company. (1976). Reading 720. Lexington, MA: Author. Hasbrouck, J. E., & Tindal, G. (1992). Curriculum-based oral reading fluency norms for students in grades 2 through 5. Teaching Exceptional Children, 24(3), 41–44. Helwig, R., & Tindal, G. (1999). Modified measures and statewide assessments. Manuscript submitted for publication. Helwig, R., Rozek-Tedesco, M. A., Heath, B., & Tindal, G. (1999). Reading as an access to math problem solving on multiple choice tests. Journal of Educational Research, 93, 113–125. Houghton Mifflin Basal Reading Series. (1989). Journeys (grade 3). Discoveries (grade 2). Boston: Author. Howell, D. C. (1987). Statistical methods for psychology (2nd ed.). Boston: Duxbury. Ihnot, C. Read Naturally. (1999). Saint Paul, MN: Turman. Jenkins, J. R., & Jewell, M. (1993). Examining the validity of two measures for formative teaching: Read aloud and maze. Exceptional Children, 59, 421–432. Juel, C. (1988). Learning to read and write: A longitudinal study of 54 children from first through fourth grades. Journal of Educational Psychology, 80, 437–447. Kaminski, R. A., & Good, R. H., III (1996). Toward a technology for assessing basic early literacy skills. School Psychology Review, 25, 215–227. Madden, R., Gardner, E., Rudman, H., Karlsen, B., & Merwin, J. (1978). Stanford achievement test. New York: Harcourt Brace Jovanovich. Marston, D. (1989). A curriculum-based measurement approach to assessing academic performance: What it is and why do it. In M. R. Shinn (Ed.), Curriculum-based measurement: Assessing special children (pp. 18–78). New York: Guilford. Marston, D., Deno, S., & Tindal, G. (1983). A comparison of standardized achievement tests and direct measurement techniques in measuring pupil progress (Res. Rep. No. 126). Minneapolis: University of Minnesota, Institute for Research on Learning Disabilities. (ERIC Document Reproduction Service No. ED236198) Marston, D., & Magnusson, D. (1985). Implementing curriculum-based measurement in special and regular education settings. Exceptional Children, 52, 266–276. Marston, D., & Magnusson, D. (1988). Curriculum-based measurement: District level implementation. In J. Garcia, J. Zins, & M. Curtis (Eds.), Alternative educational delivery systems: Enhancing instructional options for all students (pp. 137–172). Washington, DC: National Association of School Psychologists. McGrew, K. S., & Pehl, J. (1988). Prediction of future achievement by the Woodcock-Johnson Psycho-Educational Battery and the WISC-R. Journal of School Psychology, 26, 275–281. Naslund, R. A., Thorpe, L. P., & Lefever, D. W. (1978). SRA achievement series. Chicago: Science Research Associates. Nolet, V., & McLaughlin, M. (1997). Using CBM to explore a consequential basis for the validity of a state-wide performance assessment. Diagnostique, 22, 146–163. Oregon Department of Education. (1992). Technical adequacy report. Unpublished manuscript. Oregon Department of Education. (1999). Assessment homepage. Retrieved August, 14, 2000, from http://www.ode.state.or.us//asmt/index.htm Prescott, G. A., Balow, I. H., Hogan, T. P., & Farr, R. C. (1984). Metropolitan achievement test (MAT-6). San Antonio, TX: Psychological Corporation. Roach, D. A. (1981). Predictors of mathematics achievement in Jamaican elementary school children. Perceptual and Motor Skills, 52, 785–86. Scannell, D. P., Haugh, O. M., Schild, A. H., & Ulmer, G. (1986). Tests of achievement and proficiency. Chicago: Riverside Publishing. Scott-Foresman Systems. (1976). Unlimited series (Rev. ed.). Glenview, IL: Scott-Foresman.
ORAL READING RATE AND STATEWIDE TESTS
323
Shinn, M. R. (1989). Identifying and defining academic problems: CBM screening and eligibility procedures. In M. R. Shinn (Ed.), Curriculum-based measurement: Assessing special children (pp. 90–129). New York: Guilford. Tindal, G. (1988). Curriculum-based measurement. In J. Graden, J. Zins, & M. Curtis (Eds.), Alternative educational delivery systems: Enhancing instructional options for all students (pp. 111–135). Washington, DC: National Association of School Psychologists. Tindal, G. (1998). Assessment in learning disabilities with a focus on curriculum-based measurement. In J. Torgeson & B. Wong (Eds.), Learning about learning disabilities (pp. 35–66). San Diego, CA: Academic. Tindal, G. (2001). [Normative oral reading fluency data for random sample of second-grade students]. Unpublished raw data. Tindal, G., & Deno, S. (1981). Daily measurement of reading: Effects of varying the size of the item pool (Res. Rep. No. 55). Minneapolis: University of Minnesota, Institute for Research on Learning Disabilities. Tindal, G., Flick, D., & Cole, C. (1993). The effect of curriculum on inferences of reading performance and improvement. Diagnostique, 18, 69–84. Tindal, G., Heath, B., Hollenbeck, K., Almond, P., & Harniss, M. (1998). Accommodating students with disabilities on large-scale tests: An experimental study. Exceptional Children, 64, 439–50. Tindal, G., Marston, D., & Deno, S. L. (1983). The reliability of direct and repeated measurement (Res. Rep. No. 109). Minneapolis: University of Minnesota, Institute for Research on Learning Disabilities. United States Department of Education. (1995). Listening to children read aloud: Oral fluency. Retrieved August, 7, 1999, from http://nces.ed.gov/pubs/95762.html Wilson, R. G., & Rudolph, M. K. (1980). Merrill linguistic reading program (3rd ed.). Columbus, OH: Charles Merrill. Woodcock, R. (1973). Woodcock reading mastery tests manual. Circle Pines, MN: American Guidance Service.