Journal of Paramedical Sciences (JPS)
Spring 2011 Vol.2, No.2 ISSN 2008-4978
Using partitioning and non-partitioning clustering algorithms for included proteins sequences in esophagus, stomach and colon cancer Yalda Zarnegar Nia1, Hamid Alavi Majd², Mona Azodi3, Nasibeh Khayyer1, Ali Akbar Khadem Maboudi2 1
Proteomics Research Center, Shahid Beheshti University of Medical Sciences, Tehran, Iran Department of Biostatistics, Faculty of Paramedical Sciences, Shahid Beheshti University of Medical Sciences, Tehran, Iran 3 Department of Biology. Faculty of Basic Science, Islamic Azad University Science and Research Branch, Tehran, Iran 2
*Corresponding Author: email address:
[email protected] (H. Alavi Majd)
ABSTRACT A thorough recognition of the nature and duties of the genes is based upon having adequate information about the proteins. However, the proteomic projects follow a slow trend; therefore, solving the protein-related problems has become as one of the most important challenges in bioinformatics. Consequently, the presence of tools which can enhance the structural recognition, classification, and interpretation of proteins will be advantageous. Statistical methods are among the tools to help solve bio-informatics problems. These methods may be used to help predict the third structures of proteins, study proteins collectively, as well as extract new interactions among the protein collections. One of the very efficient and useful methods in the collective study of protein subsets is the cluster analysis. In the present study, the recognized protein sequences related to esophagus, stomach, and colon cancers are analyzed through partitioning, non-partitioning, and fuzzy clustering methods. Needleman-Wunsch global alignment algorithm was used to determine pair-wise similarities. The evaluations have shown that the clusters obtained through using the AGNES method have produced more powerful structures; yet, it can be said that the PAM clustering method, compared to other ones, has produced the best results in predicting ability of the 3D structure of the unknown protein sequences. Keywords: Clustering; Protein Sequence; 3D structure; Gastrointestinal Cancers study of biomarkers, the effective causes of the disease can be directly learned [4]. With the advance of the high-throughput proteomic experiments, there is a need to study the proteins collectively. Collective analysis of the proteins at the time when they are in numerous numbers, and when one cannot study them individually, may be very useful. Moreover, there may be interesting patterns in each of the protein collections that may escape our attention when studied individually. Protein clustering is a method which can be so useful in the recognition of biomarkers and helping in their classification [5]. There have been numerous studies conducted on the clustering of protein sequences whose main objective is to help classification and prediction of biological functions as well as the recognition of new interpretation patterns among them. Among these, the most important
INTRODUCTION Today, cancers are considered as the most important causes of mortality among people. WHO figures shows that during the year 2000 more than 6 million people were inflicted with cancers, while 10 million other people were at the risk, and 6 million have died due to cancers. Regarding WHO figures again, during 2004, different types of cancers were among the top 10 causes of death around the world [13]. Gastrointestinal cancers are among the most prevalent cancers and are seriously lifethreatening, if they remain unrecognized or untreated. The recognition and study of cancer-related biomarkers which reveal themselves prior to disease symptoms will be very vital in the study of cancer mechanisms and their early recognition. For different reasons, proteins are considered as very good biomarkers and by the 9
Journal of Paramedical Sciences (JPS)
Spring 2011 Vol.2, No.2 ISSN 2008-4978
ones include the protein sequences related to cancers. Most of the methods used have included the graphical and hierarchical clustering whose efficiency has been proved well in numerous studies. Eva Boltenclustered the proteins graphically. The trespass property plays an important role in their method. In other words, the similarities between proteins A and B were determined in the presence of protein C in which case if proteins A and C on the one hand, and proteins B and C on the other are similar, then those of A and C will be similar too[6]. Sung Hee Parkused the elements of the protein secondary structure, and by using Kmeans clustering method, they clustered the proteins [7]. In order to study protein cluster efficiency in speeding up protein study, Bastosclustered protein sequences based on the similarity measures obtained from BLAST, and scrutinized the proteins gene ontology in each of the clusters. They learned that the center of each cluster can include the protein cluster information; thus, enhance the rapid analyses of the proteins[8]. Kelil, hierarchically clustered protein sequences based on a new alignment-independent similarity measure and named it CLUSS. This algorithm was efficient both for the sequences which could be aligned, and those which could not[9].In still another study in 2008, they presented a new algorithm called CLUSS2. This alignment-independent algorithm was useful for the protein clusters with multiple biological functions[10]. Fayech, clusteredprotein sequences nonhierarchically based on similarities obtained from Smith-Wetermanglobalalignment algorithm. The methods used in that study could function well in clustering protein sequences[11]. In the present study, partitioning around medoids (PAM), Fuzzy clustering andagglomerative nesting hierarchical clustering (AGNES)of the proteins related to the Gastrointestinal Cancers are conducted. As mentioned above, most of the performed studies have used hierarchical methods to cluster proteins sequences. We were interested to know if PAM clustering method has better performance in comparison with hierarchical methods. In addition to comparing the efficiency, precision, and potential of the three above methods in helping predict the unknown sequence structures, the present study has
sought to find smaller collections of sequences to study them more exactly and to find new and more precise interpretations about them.
MATERIALSAND METHODS Khaier, recognized 17 proteins (from among more than 500 identified proteins related to Gastrointestinal Cancers) which were related to the cancers of esophagus, stomach, and colon [12]. In our study, Needleman-Wunsch global alignment algorithm was used to determine pair-wise similarities between these proteins[13]. Our clustering methods included hierarchical and non-hierarchical ones. One of our nonhierarchical methods was partitioning around medoids (PAM). The algorithm used in our method is based upon finding krepresentative objects from among the data set. The krepresentative objects are called ‘medoids’. In other words, medoids are the representatives of the clusters which have to precisely represent the data structures. The representatives in each cluster have the minimum average dissimilarity with the other members of the clusters [14 & 15]. Following conducting clustering methods and obtaining the clusters, it may be possible to obtain a graphical representation based on PAM method which is called ‘silhouette’. The other non-hierarchical method used in our study was the fuzzy clustering method, which is based upon the fuzziness principle. It means that we do not have a clear decision and search to find the membership coefficients for each of the proteins in each cluster. This method is more useful in cases where some of the objects are in the midline of belonging to a specific cluster or where there is an overlap among them [14,15]. The hierarchical algorithms do not construct a single partition with k clusters, but they deal with all values of k in the same run. They are of two forms: agglomerative, and divisive. Our method in the present study includes agglomerative hierarchical clustering based on group average technique (AGNES). The results of this clustering have been shown in a dendrogram[14,15]. We calculated the efficient number of clusters based on maximizing the average silhouette width[16]. In order to study the amount of adjustment of the results of the hierarchical, PAM, and Fuzzy clustering, we used the cosine similarity measure. Furthermore, we 10
Journal of Paramedical Sciences (JPS)
Spring 2011 Vol.2, No.2 ISSN 2008-4978
have used Cophenetic Correlation, Dunn Index, as well as the wb. ratio in our study to compare the results[17-20]. Based on known functional annotations, we determined the quality of a clustering by measuring the percentage of correctly clustered protein sequences. Moreover, the potentials of clustering methods in predicting a protein structure of unknown sequence were being studied.
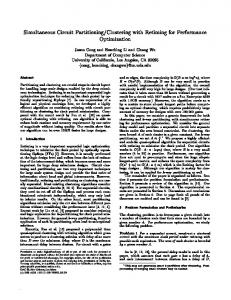
a weak one. The results of performing the PAM clustering show that the protein sequences 12 and 13 are placed in the same cluster and protein sequences 3, 4, and 6 are placed in another one. The three protein sequences 3, 4, and 6 are active in muscle cells, and all of them belong to the intermediate filament family. Considering Figure3, the non-fuzzy index for Fuzzy clustering based on global alignment was 0.50. It may be said that it has had an efficient function. As you can see in figure2,theaverage silhouette width for this cluster was 0.15, and it may be concluded that the structure of the nearest hard clustering based on the membership coefficients has been a weak one. Similar to the PAM clustering method, the protein sequences 12 and 13 are placed in the same cluster, and those of 3, 4, and 6 in another. As it can be seen in figure1, a great number of the sequences are placed individually, while upon the Fuzzy clustering method the condition of their belonging to clusters is better and more efficient. In other words, the present vagueness for deciding for their interpretation is reduced to a great extent. Considering the results obtained from measuring the cosine similarities which are shown in Table 2, it can be concluded that the highest agreement has been visible between two methods of PAM and AGNES. In order to compare and evaluate our clustering methods, indexes such as Dunn Index andwb-ratios were used. The results shown in Table 3, show that all the three methods have had close functions to each other, while the functions of the PAM and AGNES methods have been better. Following data analysis, it became clear that in the entire data set, 5 main functional groups, 6 main biological groups and 14 families were available. Similar protein sequences may have similar functions and enter in similar biological processes. Therefore, if N is considered as the total number of clustered proteins, C as the total number of the obtained clusters based on any of each of the clustering methods, and Pi as the maximum number of the proteins in each cluster belonging to the same functional group, then the clustering quality measure would be obtained as follows:
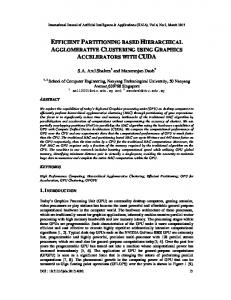
RESULTS The R-programming language was used to perform the clustering algorithms[21], and the necessary packages were downloaded from the bioonductor [21,22]. We performed Fuzzy, Agglomerative Nesting, and PAM clustering methods using obtained similarity measures from accomplishment of Needleman-Wunsch global alignment algorithm. Based on maximizing the average silhouette width for the entire data set, the efficient numbers of clusters for the PAM and Fuzzy methods were 14 and 5, respectively, while for the AGNES the best dendrogram cut was in 11 clusters. Table 1 shows the standard names of protein sequences and results obtained from PAM and AGNES algorithms and the nearest hard clustering based on the membership coefficients obtained from the fuzzy clustering method. Diagrams 1-3 depict the silhouettes and dendrogramobtained from conducting the three methods. The small quantities of the average silhouette width as well as agglomerative coefficient show that we did not obtain any powerful clustering structures. Considering Figure1, the cophenetic coefficient correlation for the AGNES clustering was 0.83, which shows its correct function. However, the structure obtained from this clustering method has been a weak one (Global: siD =0.16). In this clustering method, the sequences of the proteins 3, 4, and 6 are placed in the same cluster. Unfortunately, the structures of the sequences 3 and 6 were not determined. Considering the similarities among the three above protein sequences, it may be said that they have similar structures. Moreover, the protein sequences 12 and 13 are also placed in the same cluster. Both these two proteins belong to the annexin family. Considering Figure2, theaverage silhouette width for the PAM cluster was 0.13; therefore, it may be concluded that its structure has been 11
C P i i1 Qmeasure 100 N 0 Qmeasure 100
Journal of Paramedical Sciences (JPS)
Spring 2011 Vol.2, No.2 ISSN 2008-4978
NC MC1 1 1 100 NC i1 Cf(i)
The more this value is closer to 100; the higher the quality of the clustering will be[9]. Based on the results obtained from this calculation, which are shown in Table 4, the clusters obtained by the Fuzzy method possess a higher quality, and it may be said that the developed clusters have protein sequences with similar functions. Therefore, one may use these clusters to predict the function of an unknown protein sequence. In addition, similar proteins can have similar 3D structures. The protein clustering by the three PAM, AGNES, and Fuzzy methods may enhance the prediction of unknown function of a protein sequence. In order to find out how much our results are in agreement with the SCOP families separations, we used MCMisclustering effect score[23,24].
0 MC100 If Nc is equal to the total number of the established clusters, and Cf(i) is the number of different families clustered together within the i cluster, then the more MC is closer to zero, the results will be more agree with the SCOP classifications. As it can be seen from Table 3, the measure of mis-clustering effect in the PAM clustering is zero, which means that the obtained results under PAM clustering method is completely in agreement with the separations present at SCOP. It can also be seen that the function of the AGNES method has been acceptable too.
0.9 0.8 11 10
0.7 0.6
15 8
1
9 14
2
7
17
16
0.5 Height
0.4 3 0.3 12
13
0.2 6
4
Agglomerative Coefficient = 0.29
Figure 1. Dendrogram plot of AGNES clustering results
12
5
Journal of Paramedical Sciences (JPS)
Spring 2011 Vol.2, No.2 ISSN 2008-4978
clusters 14
n = 17 8 12 13 1 15 6 4 3 2 14 7 16 11 5 17 9 10
1 : 1 | 0.00 2 : 2 | 0.46 3 : 1 | 0.00 4 : 1 | 0.00 5 : 3 | 0.44 6: 7: 8: 9: 10 : 11 : 12 : 13 : 14 : 0.0
0.2
0.4
0.6
1 1 1 1 1 1 1 1 1
| | | | | | | | |
0.00 0.00 0.00 0.00 0.00 0.00 0.00 0.00 0.00
0.8
1.0
Silhouette width Average silhouette width: 0.13
Figure2. Silhouette plot of PAM clustering results
clusters
n = 17 5 11 10 15
5
1 : 6 | -0.08
8
9 13 12
2 : 2 | 0.49
1 7 2 17
3 : 4 | 0.05
6 4
4 : 3 | 0.49
3
14
5 : 2 | 0.16
16 0.0
0.2
0.4
0.6
Silhouette width Average silhouette 0.15 Figure width: 3. Silhouette
plot of Fuzzy clustering results
13
0.8
1.0
Journal of Paramedical Sciences (JPS)
Spring 2011 Vol.2, No.2 ISSN 2008-4978
Table 1. Standard names of proteins sequences and total clustering results
Name number
Clustering methods PAM AGNES FUZZY
Standard names
1 2 3 4 5 6 7 8 9 10 11 12 13 14 15 16 17
CAH2 SODM K2C8 VIME SPRC DESM PRDX2 ACTB A1AT HSPB1 S10A9 ANXA2 ANXA5 PCNA CALR PHB TAGL
Number of clusters
3 6 5 5 11 5 8 1 13 14 10 2 2 7 4 9 12 14
3 6 5 5 10 5 8 1 1 11 9 2 2 7 4 7 8 11
3 3 4 4 1 4 3 1 1 1 1 2 2 5 1 5 3 5
Table2. Results obtained from measuring the cosine similarities
Cosine measure PAM –AGNES 0.76 PAM –FUZZY 0.39 FUZZY – 0.52 AGNES
similarity
Table 3. Results obtained from measuring some indexes to compare the validity of clustering methods
Clustering methods
Dunn
wb ratio
silhoutte
PAM AGNES Fuzzy
1.26 0.85 0.61
0.45 0.61 0.89
0.13 0.16 0.15
Table 4. Results obtained from measuring Q-measure and MC to compare quality of clustering results Clustering methods Validation PAM AGNES FUZZY MC 0.00 0.136 0.42 Q-measure 0.41 0.58 0.76 14
Journal of Paramedical Sciences (JPS)
Spring 2011 Vol.2, No.2 ISSN 2008-4978
DISCUSSION CONCLUSION
In clustering the protein sequences, usually the goal is to develop powerful method in order to obtain results which are in accordance with SCOP classifications. As much as results are in agreement with SCOP classifications, the clustering method will be more precise in protein structure predicting. Kelil, developed hierarchical clustering methods, CLUSS & CLUSS2, in order to cluster protein sequences. They introduced new similarity measure named SMS, could be used for both non alignable and alignable sequences. Their method resulted clusters of proteins with similar molecular functions. The calculated Q-measure for their result was good enough to support their algorithm. In the result, CLUSS could be helpful for predicting the unknown functions of protein sequences[9,10]. In this study we used different clustering methods to compare their actions with each other. Furthermore we were interested to see if we could introduce a clustering method that can be flexible enough to be used as a suitable tool in predicting the 3D structure of proteins. By comparing the results, the fuzzy clustering was the best, considering Q-measure quantities. Nevertheless, regarding our data set, Q-measure couldn't be the only criteria for judging our clustering methods. The proteins in our dataset had very different types of molecular functions and they belonged to 14 family groups. As we can see in Figure1, there is a lot of single protein clusters, did not considered, in calculating the Q-measure. Adam Zelma developed STRALCP algorithm, which was a non hierarchical clustering method based on structural similarity measures obtained by LGA. He calculated MCMisclustering effect score to examine his method results accuracy. This score was 0.03 for their obtained clusters [24]. We calculated MC for the results of our three clustering methods. The MC for PAM clustering results was zero and it wasn't too bad for AGNES results. In fact PAM clustering method could produce clusters with minimum Misclustering effect score. The result encouraged us to consider PAM clustering algorithm as a sufficient and reliable tool for clustering protein sequences, providing suitable information for proteins classification. This method can be helpful for predicting 3Dstructure of unknown protein sequences.
Considering the results obtained from the present research, it can be seen that the PAM and AGNES clustering methods have provided similar results, and the evaluations have revealed that all the three methods have produced almost similar results, though the clustering structures under AGNES have been more powerful. It may be concluded that the PAM method has been more precise as it has introduced a representative for each of the clusters, while the AGNES method has been a bit simpler. However, the Fuzzy method has been able to modify the vagueness present in the PAM method. It may be concluded that the Fuzzy method has been better able to place the similar proteins with more probabilities near each other, and has given a lower chance to the unlike proteins. In fact, the Fuzzy method gave us the idea of more analyses of the proteins from any cluster which has more probability of belonging to that cluster. When one looks at the MC and Q-measures, one can realize that the PAM clustering method, though with smaller average silhouette, has produced an excellent outcome, regardless of the relative advantages that the Fuzzy and AGNES methods have had. Clustering is a tool which can help us in predicting protein structure of unknown sequences. Proteins 3, 6, 10, 15, and 17 were not determined in the PDB; therefore, the produced clusters may be suiTable predictors for the 3D structures of these sequences. In general, considering the obtained results from other researches, it can be stated that compared to other methods, the PAM clustering method has produced suiTable outcome. ACKNOWLEDGEMENT This article is a rewriting of an MSc Thesis, Yalda Zarnegar Nia
REFERENCES 1.Are the number of cancer cases increasing or decreasing in the world?, April 2008, Available from World health organization: http://www.who.int/features/qa/15/en/index.ht ml. 2.Parkin DM. Epidemiology of cancer: global patterns and Trends. ToxicolLett 1998; 227:102-103.
15
Journal of Paramedical Sciences (JPS)
Spring 2011 Vol.2, No.2 ISSN 2008-4978
Biochemistry and 3th international congress of Biochemistry and Molecular Biology 2009. 13. Needleman SB, Wunsch CD.A general method applicable to the search for similarities in the amino acid sequence of two proteins. JMolBiol 1970; 48(3): 443–53. 14. Leonard Kaufman, Peter J. Rousseeuw. Finding Groups in data– An Introduction to Cluster Analysis. John Wiley & Sons, Inc. Publication, 2005 15. glewood Cliffs, New Jersey;1988. 16. Cheryl Wolting, C Jane McGlade, David Trichler. Cluster analysis of protein array results via similarity of Gene Ontology Annotation. BMC Bioinformatics July 2006; 7. 17. Sneath P.H.A., Sokal R.R. Numerical Taxonomy: The Principles and Practice of Numerical Classification. Freeman, San Francisco 1973; 278 18. Haldiki M, Batistakis Y, Vazirgiannis M. Cluster validity methods, SIGMOD. Record 2002; 31: 40-45 19. Milligan G. W., Cooper MC. An examination of procedures for determining the number of clusters. Psychometrika 1985; 50: 159-179. 20. Gordon A. D. Classification, 2nd ed. Chapman and Hall, 1999. 21. Michael J. Crawley. The R Book. Imperial College London at Silwood Park, UK, 2007. 22. The R Project for Statistical Computing Available from: URL: http://www.r-project.org, Version 2.8. 23.Murzin A G, Brenner S E, Hubbard T, Chothia C. SCOP: a structural classification of proteins database for the investigation of sequences and structures, J. Mol. Biol 1995; 247: 536-540, Available from: URL/ http://scop.mrc-lmb.cam.ac.uk/scop. 24.Zemla A. LGA - A Method for Finding 3-D Similarities in Protein Structures. Nucleic Acids Research 2003; 31(13): 3370-337.
3.The10 leading causes of death by broad income group (2004), April 2011, Available from World health organization http://www.who.int/mediacentre/factsheets/fs3 10/en/index.html. 4. Khatri P, Draghici S. Ontological analysis of gene expression data: current tools, limitations, and open problems, Bioinfomatics. 2005; 21: 3587–3595. 5. Conrads T, Zhou M, Petricoin E, Liotta L, Veenstra T. Cancer diagnosis using proteomic patterns. Expert Rev. Mol. Diagn, 2003; 3: 411-20. 6.Eva Bolten, Alexander Schliep, Sebastian Schneckener, DietmarSchomburg, Rainer Schrader. clustering protein sequencesstructure prediction by transitive homology, Bioinformatics 2001; 10: 935-941. 7. Sung Hee Park1, Chan Yong Park1, DaeHee Kim, SeonHee Park, JeongSeopSim. Automatic Protein Structure Clustering Using Secondary Structure Elements 2005. 8. Hugo Bastos, Daniel Faria, CatiaPesquita, André OFalcão. Using GO terms to evaluate protein clustering, University of Lisbon. Department of Informatics. Campo Grande 2006; 1749-016. 9. AbdellaliKelil, Shengrui Wang. CLUSS: Clustering of protein sequences based on a new similarity measure, BMC Bioinformatics 2007; 8: 286 10. AbdellaliKelil, Shengrui Wang. CLUSS2: an alignment-independent algorithm for clustering protein families with multiple biological functions, Int. J. Computational Biology and Drug Design 2008; 2 11. Sondes Fayesh, Nadia Essoussi, Mohamed Liman. Partitioning clustering algorithms for protein sequence data sets, BioData Mining 2009; 2: 3 12.Khaier Nasibeh, Rezaei-Tavirani Mostafa, Rostami Amin. Proteomics analysis of included proteins in esophagus, stomach and colon cancer.10th Iranian congress of
16