JCS&T Vol. 3 No. 2
October 2003
Using Portable Monitoring for Heterogeneous Clusters on Windows and Linux Operating Systems* Daniel Kikuti
Paulo S. L. Souza
Simone R. S. Souza
Informatics Department (DeInfo), State University of Ponta Grossa (UEPG) Av. Carlos Cavalcanti, 4748 84.030-000 – Ponta Grossa – PR – Brazil {
[email protected] -
[email protected] -
[email protected]} * This work has the CNPq financial support, an entity of Brazilian Government directed for technologic and scientific development. * Preliminary results of this work have been presented at the VI Workshop on Distributed Systems and Parallelism of the Chilean Computing Week 2002.
There are basically two techniques of performance evaluation: modeling techniques and measurement techniques [4][12]. Modeling techniques abstract the most important characteristics of the system into a model. This model must use formal techniques of representation, which make possible the resolution of the model through simulations or analytically. Performance evaluations are extrapolated later to the real system (if it already exists), without affecting its behavior. Examples of modeling techniques are: queue nets, petri nets and statecharts [11].
ABSTRACT This paper describes the advances obtained with the XPVM-W95 2.0, a novel monitoring tool for parallel applications that employ PVM-W95 (PVM for Windows) as well as PVM for Linux. The tool provides, at runtime, the appropriate information about parallel virtual machine configuration, parallel applications and workload from each node. The three more important aspects of the XPVM-W95 are: friendly graphical interface, portability and ability to deal with heterogeneity. These items were improved by version 2, mainly when considering the modularity rearrangement. Experiments demonstrate that XPVM-W95 has a stable behavior and reached the objectives proposed. XPVM-W95 allows a great portability of its source code and also allows the monitoring using different metrics. Empirical studies, realized by means of one single application, demonstrated an intrusion of 17,0% on Windows and 0,13% on Linux.
Measurement techniques allow collecting data directly in a computing system and, potentially, they can obtain more accurate data than obtained by the solution of models. However, the measurement acts directly in the system, many times disputing resources with the applications being appraised. In this way, the measurement can affect the obtained results. The three principal measurement techniques are: prototypes, benchmarks and monitoring [4][12]. Prototypes are simplified implementations of the system, which try to maintain its essential features. Benchmarks are programs used as patterns for performance evaluation. They are widely used with comparison purposes and usually evaluate particular features of a computing system.
Keywords: Monitoring, PVM, Windows, Linux, Clusters. 1.
INTRODUCTION
Parallel computing practice is encouraged mainly by the need to obtain shorter response-time. PVM (Parallel Virtual Machine) is a message-passing environment for parallel processing in heterogeneous environments. By means of PVM, hosts1 connected by a network may be considered as a parallel platform (a cluster), with both good performance and lower cost [6][10].
Monitoring is the third measurement technique. It gathers data directly from the executing computing system, allowing, potentially, higher precision than all the other mentioned techniques. Monitoring is a generic method that could be used in several areas of computing and in different problems [4][12]. Gathering data at runtime of the system can distort the results. Thus, monitoring must guarantee that the overload is low as much as possible.
Activities involved in computing processes must be evaluated, in order to certify if they correspond to the expectances considering efficiency and reliability [8].
This paper describes the advances obtained with the XPVM-W95 2.0, a monitoring software-tool for parallel applications that employ PVM-W95 (Parallel Virtual Machine for Windows Operating System) and it is in accordance with the principles previously discussed [9][10]. The main objective of
1
The terms host, node, processor and machine are used as synonymous in this work.
-15-
JCS&T Vol. 3 No. 2
October 2003
hardware, when compared with software version. Both implementations above collect information in different levels [8]. In a general way, a monitor by hardware does not have access to the information related to the application, and vice-versa.
this work is providing, at runtime, the appropriate information about the performance of the distributed platform (the parallel virtual machine) and about the parallel applications too. When designing the first version of XPVM-W95 [5], some aspects were pointed out. The tool should be able to inform, at runtime, how the current configuration of the virtual machine is, which tasks are being executed and where they are running. It should also notify about the workload of each host, thus helping the correct distribution of the tasks, considering their particular features.
Hybrid monitors try to join the advantages of both, presenting a combination between software and hardware. Monitors by firmware include the monitoring into the processor microcode [8]. The mechanism that activates the monitoring is another important feature of the monitors. It can be by event or time. A monitor based on events is activated when a relevant activity happens (for instance the inclusion of a new node in the platform). A monitor based on time (or in sampling) is periodically activated. This usually occurs when the rate of observation is high. Monitors based on events are used with low rates of observation, due to the overload.
The version 2 of XPVM-W95 kept on the main aspects of version 1, however, the source code and the information updating among modules were restructured, in order to minimize the intrusion caused by the tool. The monitoring of the platform workload was also redefined (source code and user interface), in order to enable the portability of the XPVM-W95 for other operating systems, like Linux.
Data collected by monitors can be presented and analyzed at runtime, characterizing an on-line monitor. Batch monitors, on the other hand, just allow the data analysis after gathering conclusion.
Some features of XPVM-W95 are based on XPVM (PVM graphical interface for UNIX systems), but they have completely distinct implementations and also some different functionality [7]. Besides of the information already available through XPVM, the tool proposed here shows information in a graphical way to allow the analysis of workload of each host. It is expected from this tool to diffuse the monitoring of parallel machines among programmers that utilize the PVM on Windows Operating System, as well as on other platforms, such as Linux.
Considering the information described in this section, the monitoring tool proposed in this work has the following classification: it is implemented by software; the mechanisms that active the monitoring are based on events - in same cases - and also on time – in other cases – (see section 3); and it is an on-line monitor.
This paper is organized in 6 sections. Section 2 describes some of the monitoring activity main features, which are necessary to classify our proposal according to an accepted taxonomy. Section 3 approaches the design options and also the implementation details of XPV-W95. The results obtained from this software tool are discussed in Section 4. Ending this paper, Sections 5 and 6 present respectively the main difficulties and the conclusions of this work. 2.
3.
THE XPVM-W95 TOOL
XPVM-W95 is a monitoring software tool for parallel platforms, not commercial and with open source. Through XPVM-W95, the collected information is showed by means of a friendly graphical user interface (GUI). The tool is interactive in order to provide a better interaction between users and PVM. Users are able to choose which information is more useful to be displayed and, with the information, users can tune the environment according to their requirements.
MONITORING ACTIVITY
The capacity of dealing with platform heterogeneity is another feature of the XPVM-W95. To reach this aim, the XPVM-W95 source code is modular and each module was built using portable software tools, such as ANSI C and TCL/TK. The most dependent module of the platform is the workload monitoring, which needs operating system support directly.
Monitoring can be implemented by software, hardware, firmware or in a hybrid way [11]. Monitors by software are normally used to evaluate basic softwares (such as operating systems) or applications. They have the flexibility as the main profit with a relatively low cost. However, monitors by software dispute resources with the system and can present a larger overload, when compared with monitors by hardware. Monitors by hardware use devices coupled to the system, which will capture the necessary data. As the device monitor is separated from the system being monitored, it will cause a practically null overload. The lack of flexibility and the higher implementation cost are usually the main disadvantages of monitoring by
The ANSI-C language was chosen because it offers enough resources to the development of this project, it is widely disseminated in the academic environment and it is also used in PVM source code. It allows the tool to be easily carried to other platforms, considering the features of each operating system and the language version available. Another factor that contributed to the language choice was
-16-
JCS&T Vol. 3 No. 2
October 2003
mainly when rearrangement.
the availability of free versions of the compiler. TCL (Tool Command Language) is a script interpretation language. It is able to provide the same functionality that is available in other command languages currently used in shells. TCL is a multi-platform and has a wide variety of built-in commands. TK is a tool kit initially designed to the X-window system. It allows the creation and manipulation of widgets2 through TCL commands. TK is a popular tool kit due to its flexibility and easy development of systems. Another positive aspect is the capability of controlling the interaction between applications, including their look and feel and their functionality.
considering
the
modularity
USER
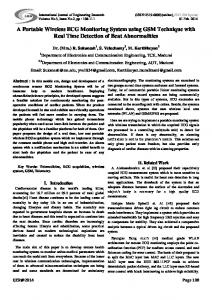
XPVM-W95 (.exe) FRONT END Visual Elements from Graphical Interface C ANSI + TCL/TK
XPVM-W95 has three scopes of monitoring: PVM tasks, parallel platform and workload in each host that compose the platform. PVM tasks monitoring informs which tasks are being executed and which have already finished, how much processing time each task has spent and where they are or have been executed. This functionality permits the user to have a notion about the task distribution through the virtual machine. It is also possible to observe the amount of time that each task has consumed.
BACK END MODULE Functionality C ANSI WORKLOAD SERVER Information about each host
Parallel platform monitoring shows information about the current parallel platform configuration. It describes, for each node: architecture, name and state (idle or running some task). Workload monitoring of each host offers information about workload generated from other applications in the system, not only PVM applications. This monitoring makes the users able to figure out whether a certain host is supporting their applications properly or not. The metrics used are related to processor utilization, which includes the number of running processes and the processor utilization percentage. Memory metrics are also used, showing information about the percentage of utilization or the amount of available memory. Workload metrics are gathered directly from the operating system and this functionality has been implemented in a separated module. Thus, this gathering does not keep on consuming the machine resources unless the user requests it. This modularization favors the portability too, because each module is responsible for gathering information about the host on which it is running, in compliance with the operating system and the architecture.
PVM KEEPER PVM functions
Node 0
Node 1
Node N
Workload (.exe)
Workload (.exe)
Workload (.exe)
Process (physical) boundary Function (logical) boundary
Figure 1 –XPVM-W95 structure. Front End and Back End modules from version 1 remained, in order to assure the portability. Front End is responsible for the interaction with user and Back End is responsible for the functionality [5]. However, this division is not physical anymore in two executable processes. According to showed in Figure 1, the tool presents an executable code only, which contains both interface and functionality (except the workload gathering). The division of the modules is logic only and it refers to the grouping of common functions (or procedures). The activity of workload gathering remained as a separate process (workload.exe), due to its operating system dependence. The workload.exe is responsible for isolating the tool from operating system particularities.
The three more important aspects of the XPVM-W95 implementation are: friendly graphical interface, portability and ability to deal with heterogeneity. These items were improved by changes realized in source code of the version 2,
This new structure provided a clearer and organized code for the tool, besides a better efficiency when loading and executing it [2]. Another advantage obtained from this union of the modules was the overload reduction caused by the Integration Front End / Back End, which is realized now by means of simple parameters passing among functions inside of
2
Widget is an element of a determined class that has particular appearance and behavior. Examples of widgets are buttons, menus, scrollbars, text box, etc.
-17-
JCS&T Vol. 3 No. 2
October 2003
host. The second aim was to determine how intrusive the XPVM-W95 is, when using a simple application and executing on Windows as well as Linux.
the same process. Front End was developed using ANSI-C and TCL/TK. The portion of Front End written using C loads all TCL visual components, which are responsible for the interaction with the user. The portion in C of Front End also is responsible for the interaction with Back End. The visual components are loaded directly from .tcl files and they do not possess any code written in C language.
In order to determine the overload produced by the tool, experiments were realized on a cluster with 5 nodes, interconnected by an IEEE 802.3 10BASET network. Table 1 shows a description of these nodes. The operating systems used at the experiments were Windows 98 and Linux 2.4.5.
Although the Front End implementation has been done using the positive aspects of TCL/TK, this does not hinder the future use of other language, for example Java, GTK+ (GUIMP Tool Kit), Qt (acronym to cute), LessTif, and others. This freedom to choice the language is possible due to the standardization of the call to the modules and the use of arguments in both Front End and Back End.
Quantity
Processor
Memory
02
Pentium III – 850 Mhz
192MB
02
Atlon – 1.1 Ghz
512MB
01
Pentium III – 733 Mhz
128MB
Table 1 – Cluster used in the experiments.
Back End was developed using C-ANSI and must always attend the requests coming from the Front End. When an event is triggered at the Front End, it is translated into a TCL command that calls the appropriate ANSI-C function. The Back End receives this request from ANSI-C function, performs the necessary activity and returns the results to the Front End.
The diagram showed at Figure 2 shows information about the current parallel platform (on Windows) configuration and represents (with icons) the architecture of each machine and its name. This diagram also represents the host state, using colors (white, if it is idle, or green, if at least one task is being executed on it). The user just needs to click on the icon related to that host in order to get information about the number of tasks that are being executed or which is the identifier of a particular host. The upper left field informs the time interval to collect information. This field is available in all charts and the user can edit it to control the intrusion factor (overload).
Back End module is divided in two other modules: Workload Server and PVM Keeper (Figure 1). The PVM Keeper module is responsible for supplying and updating the data presented in the Network View and Time Space View charts (both belonging to the Front End module). PVM Keeper is also responsible for all functions of PVM Console. The main functions of the PVM Console attended by PVM Keeper are: to start the execution of the PVM Daemon (PVMD), to add/remove hosts, quit PVM, kill tasks, list tasks that are running, send signals to tasks and spawn new PVM tasks. Workload Server module is responsible for receiving the workload information from all nodes, grouping these data and later sending them for Front End module. The workload data from each node are obtained directly from the operating system, by means of modules workload.exe, executed remotely in each node of the platform (Figure 1). Although XPVM-UNIX inspired the development of XPVM-W95, the structure of this differs in many aspects from that. The main differences are the approach to this implementation, concerning separation between the functionality and the interface; and the performance analysis, bringing information about external applications. 4.
Figure 2 –Platform representation diagram.
RESULTS
Figure 3 shows the chart “Space Time View”. This chart informs which tasks are running on the virtual machine in relation to the space of time that each one consumes during their execution. It is a simple bars chart that contains, on the left side, information
The preliminary experiments realized in this work had two purposes. The first one was to demonstrate the tool behavior regarding to the applications running on PVM and on the load analysis of each
-18-
JCS&T Vol. 3 No. 2
October 2003
about the tasks that are running, which consists of the name (when started by spawn command) and its task ID (TID). On the right side, the tasks are displayed in the shape of bars, having their width changed according to the time that they remain executing. On the upper right side there is a field that informs the amount of time elapsed since the moment that space time view started until the moment that there are no tasks executing. On the bottom side there is the amount of time related to the position of moveable vertical bar.
Figure 4 – Run queue Figure 5 shows information about the percent of processors utilization per elapsed time. This chart is useful to analyze the behavior of some host when executing a specific task. The intersection of the vertical and horizontal lines determines the information about the instant of time (in seconds) and percent of utilization that is displayed at the bottom. The slices field divides the percentage (scale of y axis) in n parts and can be easily changed by user to provide a better visualization.
Figure 3 – Space-time view When new PVM tasks arrive, information about each one is displayed just below the last task already registered. In the bars chart there is a vertical line (considering Figure 3, it is the vertical line at the right side) that moves continuously while at least one task is running, indicating the total time elapsed. The other vertical line (at the left side) has a free orientation and is controlled by the user. It shows the amount of time elapsed until any specific moment. The following charts are representations of the workload of each host, according to a selected metric. The tool uses two metrics to analyze the processors workload: number of processes in the run queue (Figure 4) and percentage of processor utilization (Figure 5). Two metrics are used to evaluate the memory utilization: percentage of used memory (Figure 6) and total memory used (in MB) (Figure 7). The purpose of these charts is to offer necessary information in order to allow a better distribution of tasks on the platform. It is important to observe that these charts were obtained from Windows as well as from Linux platforms, fact that shows the tool portability.
Figure 5 – Percentage of processor utilization
The chart showed in Figure 4 classifies each host as idle (white), moderate (green) or overload (red). Thresholds are used to define the three ranges. These thresholds can be determined by the user, allowing a better flexibility due to its capacity of being fitted on the particular user needs. Column bars change according to the number of processes in run queue. The information above the columns refers to host name and also to number of processes in run queue per total of processes executing on that host.
Figure 6 shows information about the percent of memory utilization. Each column informs: host name, used memory and total of physical memory. Horizontal bar helps to visualize the percent of utilization printing it at the bottom of chart. The chart showed in Figure 7 allows visualizing the behavior of each host along the time, as well as its current state. With this chart, a group of applications
-19-
JCS&T Vol. 3 No. 2
October 2003
recognizing handwritten numeral strings [1]. The VQpar algorithm was chosen as benchmark because it consumes a great amount of both processor cycles and main memory. The results of the intrusion obtained to this work, represent the average of 30 executions for each experiment.
can be analyzed considering the memory use. This chart also contains two lines - a vertical and other horizontal, whose intersection informs the elapsed time till that point and the percentage of used memory.
The average intrusion of the tool when executed on Windows was 17,0%. When executing on Linux, the same intrusion was just 0,13%. The largest intrusion verified on Windows can be attributed to two main factors. The first one is the low performance of the communication realized among nodes that are controlled by Windows [9]. The second one is the overload generated by the TCL/TK when used on Windows. In the empirical studies realized at our laboratories, the TCL/TK for Windows had a behavior significantly slower than its version for Linux. It is important to observe that the intrusion is directly dependent on the selected charts and on the time-interval to collect the information. Gathering workload data from hosts in shorter time intervals, majors the necessary communication to group the information (this communication overload has been not measured in this work). The results presented here show that the XPVM-W95 portability was reached. XPVM-W95 could be executed on two distinct platforms without changing any part in its source code. Other important point is that, although the XPVM-W95 has been initially developed for Windows, its behavior for Linux has been more efficient.
Figure 6 – Percent of memory utilization considering the last updating.
5.
DIFFICULTIES FOUND
The main difficulties found during the development of this work were relative to gathering the workload data on Windows Operating System. The Windows 9x used by PVM-W95, and consequently also used for the monitoring tool, has some restrictions concerning to the collection of information about the load of the computational platform. An example of these limitations is the difficulty to obtain the number of processes that are executing on a host at a certain instant [3]. Having only the information returned by the Windows 9x API, it is not possible to determine which processes are running, sleeping or blocked waiting I/O. Consequently, the correct comparisons between workloads of different nodes become more challenging. In order to overcome this constraint, the monitoring tool employed as a load index, for example, the percentage of CPU utilization available to the user. The problems verified when using the Windows Operating System, were not detected when using the Linux Operating System.
Figure 7 – Percent of memory utilization considering a time line The calculus of the overload generated by the tool was determined by means of the execution of the VQpar application. This application implements a parallel approach for the K-means VQ algorithm, which is used in a two-stage HMM-based system for
Another issue to be considered is that the tool is based on version 3.3 of PVM and, thus, some of the trace facilities provided at version 3.4 are not present
-20-
JCS&T Vol. 3 No. 2
October 2003
[7]. This difference does not impose any limitation for XPVM-W95 concerning the final result; however it imposes some extra work to collect PVM information. Thus, to overcome the absence of some functionalities (that are present on PVM 3.4), the XPVM-W95 utilizes the pvm_tasks() function to obtain information about the tasks and the pvm_notify() function to learn about when a task has finished. The diagram of the virtual machine is created through the information returned by the pvm_config() function, which obtains the number of hosts and their respective configuration. Through the pvm_notify() function, the tool is informed about when a host has been added to or removed from the virtual machine. 6.
7.
REFERENCES
[1] A.S. Britto, R. Sabourin, F. Bortolozzi and C.Y. Suen, “A two-stage HMM-based system for recognizing handwritten numeral strings”, Proc. of the Inter. Conf. on Document Analysis and Recognition, Seattle, USA, 2001, pp. 396-400. [2] B. Welch, Practical Programming in Tcl and Tk Draft. January 13, 1995. http://www.sunlabs.com/~bwelch/book/index.html. [3] BonAmi Software Corporation. “Supplementing Windows 95 and Windows 98 Performance Data for Remote Measurement and Capacity Planning”, Proceedings of Computer Measurement Group 1998 International Conference, Anaheim, CA, December 1998.
CONCLUDING REMARKS
[4] C.R.L. Francês, Stochastic Feature Charts Uma Extensão Estocástica para os Statecharts. Master Dissertation. ICMC-USP, São Carlos, May, 1998.
The main contribution of this work is the multiplatform monitoring realized by XPVM-W95. XPVM-W95 is a new monitoring software tool for parallel platforms that uses PVM message passing environment. This tool was projected initially to be executed on the Windows 9x operating system, and using the PVM-W95. The actual XPVM-W95 source code was restructured, favoring the monitoring at different operating systems, such as Windows and Linux. The changes in the code source were realized in order to guarantee the portability as well as to reduce the intrusion caused by the tool.
[5] D. Kikuti, P.S.L. Souza and S.R.S. Souza, “XPVM-W95 - A Performance Monitoring Tool for PVM Clusters on Windows Operating Systems”, XXII International Conference of the Chilean Computer Science Society - VI Workshop on Distributed Systems and Parallelism, v. 1 Copiapo Atacama, Chile, 2002. [6] G.A. Geist, A. Beguelin, J. Dongarra, W. Jiang, R. Manchek, and V. Sunderam, PVM: Parallel Virtual Machine, A User’s Guide and Tutorial for Networked Parallel Computing. The MIT Press, 1994a
XPVM-W95 offers a friendly graphical interface for the PVM console, it allows parallel environment monitoring and it also offers support for workload analysis. The tool is flexible, portable and now it can be easily adapted for other platforms, based on the UNIX operating system.
[7] J.A. Kohl and G.A. Geist, “The PVM 3.4 Tracing Facility and XPVM 1.1”, Proceedings of 29th Hawaii International Conference on System Sciences (HICSS`96). January, 1996.
The results described here demonstrate that XPVMW95 has a stable behavior and reached the objectives proposed. Besides owning functionality that is similar to the existent in the tool XPVM for UNIX, XPVM-W95 allows a great portability of its source code and also allows the performance monitoring of the parallel virtual machine, using different metrics.
[8] K. Kant, Introduction to Computer System Performance Evaluation. McGraw-Hill, 1992. [9] P.S.L. Souza, L.J. Senger, M.J. Santana, R.C. Santana, “Evaluating Personal High Performance Computing with PVM on Windows and Linux Environments”, Proceedings of Euro PVM-MPI, 1997.
Although XPVM-W95 has been projected initially to execute on the Windows environment, the realized experiments demonstrated that the tool is more efficient when used on the Linux operating system. The results demonstrated an overload of 17,0% and of 0,13% in the execution time of the parallel applications, when the monitoring has been used on Windows and Linux, respectively.
[10] P.S.L. Souza, Máquina Paralela Virtual em Ambiente Windows. Master Dissertation. ICMSC/USP – São Carlos - Brazil. May, 1996. [11] R. Jain, The art of Computer Systems Performance Analysis: Techniques for Experimental Design, Measurement, Simulation, and Modeling. John Wiley & Sons, Inc, 1991.
From now on, necessary changes will be made in order to improve the workload monitoring. It is expected that Linux impose fewer limitations that Windows, making possible the expansion of the tool. It is also expected that the XPVM-W95 will be able to offer the necessary support to the processes scheduling activity on multi-user parallel machines.
[12] R.C.G.S. Orlandi, Ferramentas para Análise de Desempenho de Sistemas Computacionais Distribuídos. Master Dissertation. ICMC-USP, São Carlos, March, 1995.
-21-