Atten Percept Psychophys (2013) 75:257–277 DOI 10.3758/s13414-012-0396-7
Using response time distributions to examine top-down influences on attentional capture Bryan R. Burnham Published online: 14 November 2012 # Psychonomic Society, Inc. 2012
Abstract Three experiments examined contingent attentional capture, which is the finding that cuing effects are larger when cues are perceptually similar to a target than when they are dissimilar to the target. This study also analyzed response times (RTs) in terms of the underlying distributions for valid cues and invalid cues. Specifically, an ex-Gaussian analysis and a vincentile analysis examined the influence of top-down attentional control settings on the shift and skew of RT distributions and how the shift and the skew contributed to the cuing effects in the mean RTs. The results showed that cue/ target similarity influenced the size of cuing effects. The RT distribution analyses showed that the cuing effects reflected only a shifting effect, not a skewing effect, in the RT distribution between valid cues and invalid cues. That is, top-down attentional control moderated the cuing effects in the mean RTs through distribution shifting, not distribution skewing. The results support the contingent orienting hypothesis (Folk, Remington, & Johnston, Journal of Experimental Psychology: Human Perception and Performance, 18, 1030–1044, 1992) over the attentional disengagement account (Theeuwes, Atchley, & Kramer, 2000) as an explanation for when top-down attentional settings influence the selection of salient stimuli. Keywords Attentional capture . Attentional control . Response time distribution How and when do top-down settings and bottom-up signals moderate the allocation of attention toward salient items? Some propose that salient items receive priority and are selected in a stimulus-driven manner (e.g., Theeuwes, 1992, 1994, 2010; Yantis, 1993, 2000; Yantis & Egeth, 1999). Others propose that salient items are selected only if they are relevant to current goals (e.g., Folk, Remington, & Johnston, 1992; Folk, B. R. Burnham (*) Department of Psychology, The University of Scranton, Scranton, PA 18510, USA e-mail:
[email protected]
Remington, & Wright, 1994). Although top-down modulation of attention is well-established, the issue of how and when this modulation occurs is contested. Part of the issue may be the reliance on measures of central tendency of behavioral responses—namely, mean response times (MRT)—to infer when top-down modulation occurs. Results of studies using differences in MRT (or lack thereof) between conditions do not unambiguously support one side of the debate. This study went beyond using measures of central tendency by examining top-down modulation of the shift and skew of RT distributions in attentional capture tasks. Identifying how top-down control influences RT distributions provided insight as to when top-down control modulates the selection of salient stimuli. Evidence that salient items are selected only if they are featurally relevant comes from Folk et al. (1992), in which a color cue or onset cue appeared 150 ms prior to a target that was an onset singleton for some subjects and a color singleton for others. Folk et al. (1992) hypothesized that subjects would enter the target-defining feature into an attentional set that would moderate shifting attention toward the cues. Specifically, cues that shared a feature with the attentional set would capture attention, but cues that did not share a feature with the attentional set would not. Consistent with this contingent orienting hypothesis, only color cues captured attention in the color target group, and only onset cues captured attention in the onset target group. Thus, bottom-up signals interacted with top-down settings so that only salient items that were relevant to the attentional set captured attention. (Hereafter, target relevant refers to cues that match the attentional set, and target irrelevant refers to cues that do not match the attentional set.) Much research has revealed an interaction between topdown settings and bottom-up signals on the control of attention (e.g., Anderson & Folk, 2010; Ansorge & Heumann, 2003; Folk & Remington, 1998, 2006, 2008; Folk et al., 1992; Folk et al., 1994; Gibson & Kelsey, 1998; for reviews, see Burnham, 2007; Theeuwes, 2010). But according to the attentional disengagement account, all salient stimuli
258
capture attention in a stimulus-driven manner. According to this account, the lack of cuing effects by target-irrelevant cues is due to a disengagement of attention away from the cue in the 150-ms cue–target onset asynchrony (CTOA), and cuing effects by target-relevant cues reflect no disengagement. Thus, the attentional set modulates when attention shifts away from an attention-capturing item, not whether an item captures attention (Belopolsky, Schreij, & Theeuwes, 2010; Theeuwes, 2010; Theeuwes, Atchley, & Kramer, 2000). In support of this, Theeuwes et al. found that a color singleton distractor (e.g., a single green item among red items) elevated RTs when it appeared 50 or 100 ms prior to the onset of a target, but not between 150 and 300 ms prior to the target (see also Lamy & Egeth, 2003; Theeuwes & Godijn, 2002). Thus, attention was captured, but with enough time, attention disengaged from the distractor, thereby nullifying any observable attentional capture effect. Belopolsky et al. (2010) obtained results consistent with the disengagement account. In their Experiment 4, on each trial, subjects were instructed to choose which one of two targets (red or onset) they wanted to locate. If the target that appeared was congruent with the chosen target, the subjects were to respond (go trial), and they were to withhold their response otherwise (no-go trial). A color cue or onset cue preceded the target by 150 ms, and cues that were target relevant elicited positive cuing effects. However, cues that were target irrelevant elicited negative cuing effects; that is, responses were faster following invalid cues (cue and target in different locations) than following valid cues (cue and target in same location). According to Belopolsky et al., “suppression of the nonmatching cue location suggests that top-down attentional control could not prevent attentional capture by the cue but operated by rapid disengagement of attention from the cued location, followed by suppression of processing at that location” (p. 356). However, negative cuing effects may also reflect the attentional set suppressing attention from being captured, thereby slowing attention from shifting to the cued location (Lamy, Leber, & Egeth, 2004), consistent with the contingent orienting hypothesis. Both the contingent orienting hypothesis and the disengagement account predict the same cue/target similarity × cuing effect interaction, with positive cuing effects for target-relevant cues and absent or negative cuing effects for target-irrelevant cues. Hence, results such as Folk et al.’s (1992) and Belopolsky et al.’s (2010) cannot distinguish between the hypotheses. One issue may be the reliance on MRT and cuing effects in MRT. If one accepts the disengagement account, cuing effects cannot be used to detect that a targetirrelevant cue has captured attention, because the initial capture of attention and following disengagement of attention are subsumed by the same variable (MRT), making it difficult to disentangle the two effects. A solution is to estimate the attentional capture effect and disengagement of attention
Atten Percept Psychophys (2013) 75:257–277
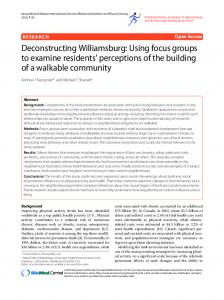
separately and examine their combined influence on cuing effects in MRT. One approach is to analyze RT distributions. RT data tend to be positively skewed, with MRT influenced by both the central tendency and skew of the RT distribution. If RTs are normally distributed, MRT estimates μ, and manipulations that result in a difference in MRT reflect a shift in μ. But in positively skewed distributions, because skew influences MRT, manipulations resulting in a difference in MRT may not reflect a change in μ; rather, a manipulation might affect skew and, in turn, affect MRT (e.g., Andrews & Heathcote, 2001; Balota & Yap, 2011; Balota, Yap, Cortese, & Watson, 2008; Heathcote, Popiel, & Mewhort, 1991; Luce, 1986; Yap, Balota, Cortese, & Watson, 2006). Thus, with positively skewed data, it is ambiguous whether a manipulation that results in a difference in MRT was due to a difference in μ (distribution shift), a difference in skew, or a difference in both. The ex-Gaussian function can be fit to positively skewed RTs to examine how manipulations affect the shift and skew of an RT distribution and how differences in the shift and skew contribute to observed differences in MRT (Heathcote et al., 1991; Hockley, 1984; Luce, 1986; Ratcliff, 1978; Ratcliff & Murdock, 1976; Van Zandt, 2000). The ex-Gaussian is a convolution of a normal (Gaussian) distribution and exponential distribution, which represents positive skew (Fig. 1). The exGaussian is bound by three parameters: μ, the mean of the normal distribution; σ, the standard deviation of the normal distribution; and t, the central tendency of the exponential distribution, which is analogous to skew. Two properties of the ex-Gaussian are especially important. First, as Luce (1986; Van Zandt, 2000) explained, the ex-Gaussian fits positively skewed data quite well and is well-suited for studies analyzing RTs. Second, the sum of the estimates for μ and t is approximately equal to MRT, because the sum of the true values of μ and t is equal to the true mean of the ex-Gaussian (Balota & Yap, 2011; Heathcote et al., 1991; Luce, 1986; Yap et al., 2006). Importantly, when RTs are positively skewed and fit an ex-Gaussian distribution, MRT does not estimate μ in a normal distribution, because MRT is now assumed to be a convolution of μ and t. This is appealing, because estimates of μ and t can be generated and analyzed separately to determine whether a variable that influenced MRT did so via μ, t, or both. As Balota and Spieler (1999) stated, “detailed predictions of . . . specific models could not have been tested with estimates of central tendency” (p. 34). For example, using a Stroop task, Heathcote et al. (1991) found no facilitation effect in MRT between a congruent condition (RED written in red ink) and neutral condition (XXX written in red ink). After fitting the ex-Gaussian to each subject’s data, Heathcote et al. found a facilitation effect in μ (μCongruent < μNeutral) that was counteracted by an interference effect in t (tCongruent > tNeutral). That is, the ex-Gaussian analysis revealed how a null effect in MRT was due to distribution shifting (μ) and skewing (t) exerting opposite influences on M RT. Thus, an ex-Gaussian analysis—and, in
Atten Percept Psychophys (2013) 75:257–277
259
Fig. 1 A Gaussian distribution (top), with parameters μ and σ, and an exponential distribution (middle), with parameter t, form an ex-Gaussian distribution (bottom), with parameters μ, σ, and t
particular, the t component—allows one to determine which portion of an RT distribution is affecting MRT. An influence of the ex-Gaussian parameters μ and t on MRT may suggest whether different cognitive processes are operating. For example, an influence of μ on MRT may reflect stimulus-driven processes, whereas an influence of t may reflect top-down processes (Hohle, 1965; Rouder, 2005; Rouder & Speckman, 2004; Wenger & Gibson, 2004; but see Luce, 1986; Matzke & Wagenmakers, 2009). That is, because stimulus-driven processes operate quickly, they may be reflected in shorter RTs corresponding to μ. Thus, manipulations that affect stimulus-driven processing would manifest as differences in μ. Similarly, because top-down-processes operate slowly, they may be reflected in longer RTs corresponding to t. Hence, manipulations affecting top-down processes would manifest as differences in t. Although it is speculative to equate specific cognitive processes with specific parameters, results from the word recognition literature suggest that μ may be sensitive to differences in stimulus-driven processes and that t may be sensitive to changes in top-down, attention-demanding processes. For example, Balota and Spieler (1999) examined the influence of word frequency on lexical decision times (LDTs). A word frequency effect was observed in MRT, where responding was faster to high-frequency words than to low-frequency words, an effect that was influenced by both μ and t. Specifically, μ was smaller for high-frequency words, and t was larger
for low-frequency words. Faster responding to high-frequency words may reflect stimulus-driven encoding; hence, the difference in μ suggests that μ is sensitive to stimulus-driven processing. Slower responding to low-frequency words may reflect a strategic memory search; hence, the difference in t suggests that t is sensitive to changes in top-down processes. Similarly, Balota et al. (2008) examined the influence of μ and τ on semantic priming, which is the finding that LDTs are shorter on target words (cat) following related primes (DOG) than following unrelated primes (WALL). The semantic priming effect in MRT was influenced only by μ. Given that semantic priming may reflect a stimulus-driven preactivation mechanism (Neely, 1977), this suggests that μ may be sensitive to stimulus-driven processing. Importantly, Balota et al. also observed an increase in semantic priming when the target was perceptually degraded, which suggests that subjects relied more on the prime to assist processing the target. This increase in the semantic priming effect was isolated to t, suggesting that t may be sensitive to changes in top-down processes. In short, evidence suggests that μ and t are sensitive to changes in stimulus-driven and top-down processing, respectively, although μ and t may not directly measure those processes. Because involuntary shifts of attention toward salient stimuli (attentional capture) reflect perceptual process, cuing effects may reflect an RT distribution shift between valid and invalid cue conditions (μValid < μInvalid). That is, if attention shifts toward a cue, this should facilitate
260
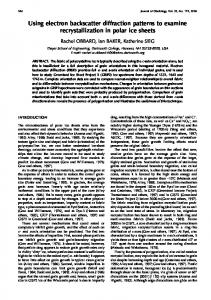
responding to targets at that location, and the RT distribution for valid cues should be shifted to the left of the distribution for invalid cues. The question is how top-down modulation might influence the shift and skew of the RT distributions. The contingent orienting hypothesis and disengagement account assume that top-down attentional settings moderate the capture of attention but differ with respect to when this occurs (before or after capture)—hence, how top-down modulation might influence the shift and skew of RT distributions (Fig. 2). According to the contingent orienting hypothesis, top-down modulation occurs prior to capture. Target-relevant cues should elicit a cuing effect and RT distribution shift (μValid < μInvalid), but target-irrelevant cues should elicit no cuing effect and no shift (μValid 0 μInvalid). The hypothesis predicts no influence of t (tInvalid 0 tValid), because top-down control that may be associated with t exerts an influence prior to attention being captured; that is, top-down control is engaged a priori to cue onset. The hypothesis predicts a cue/target similarity × cuing effect interaction for μ, but not for t. In contrast, the disengagement account assumes that top-down modulation occurs after stimulus-driven capture by a salient cue. Both targetrelevant and target-irrelevant cues should elicit a cuing effect and distribution shift (μValid < μInvalid). Critically, because disengagement is assumed to occur after attention is captured —that is, top-down control is engaged a posteriori to cue onset —disengagement may influence larger RTs that may be associated with t. As such, the lack of cuing effects in MRT for target-irrelevant cues may reflect a skew effect (tValid > tInvalid) that counteracts the shift effect, with the result being no observable cuing effect: (μInvalid − μValid) + (tInvalid − tValid) 0 MInvalid − MValid 0 0 ms. There should be no influence of ttarget-relevant cues (tValid 0 tInvalid), because disengagement should not occur. Thus, the account predicts a cue/target similarity × cuing effect interaction for t, but not for μ. In short, the ex-Gaussian analysis allows predictions to be contrasted between the contingent orienting hypothesis and disengagement account. No study examining top-down modulation of attentional capture has used an ex-Gaussian analysis,1 but several studies have used vincentized analyses
Atten Percept Psychophys (2013) 75:257–277
(Ansorge & Horstmann, 2007; Ansorge, Horstmann, & Carbone, 2005). In a vincentized analysis, each subject’s data are separated into conditions and are rankordered. Data are placed into bins called quantiles, with each representing a percentage of data. The MRT within a quantile is averaged across subjects, and differences between conditions as a function of quantile are examined. For example, Ansorge et al. found that target-relevant (better-marching) distractors elicited capture effects earlier in an RT distribution than did target-irrelevant (less-marching) distractors, consistent with the contingent orienting hypothesis. Quantile plots are used in conjunction with exGaussian analyses because μ and t have specific influences on their shape. Generally, if a difference in MRT is due to μ, the difference between conditions will not change across quantiles, but if a difference in MRT is due to t, the difference will change across quantiles (see Fig. 2 in Balota & Yap, 2011). The contingent orienting hypothesis predicts a difference between valid and invalid conditions that does not vary across quantile for targetrelevant cues and no difference between valid and invalid conditions for target-irrelevant cues. In contrast, the disengagement account predicts that the difference between valid and invalid cues should decrease across quantiles for target-irrelevant cues and that the difference will not vary across quantiles for target-relevant cues. In the following three experiments, cuing effects were analyzed using MRT and also with an ex-Gaussian analysis to test the predictions from the contingent orienting hypothesis and the disengagement account. The experiments were similar to those in Folk et al. (1992), and cuing effects were predicted, and observed, to be modulated by top-down settings. The question addressed was how top-down modulation would influence the parameters μ and t and how these parameters would contribute to the top-down modulation of cuing effects in MRT.
General method Subjects
1
Wenger and Gibson (2004) used hazard functions to examine changes in processing capacity as a function of cue–target similarity in a contingent capture task—specifically, whether the ordering of hazard functions fit to data from valid and invalid cue conditions differed with respect to cue–target similarity. Their results were consistent with the contingent orienting hypothesis (Folk et al., 1992), that processing capacity differs on the basis of similarity between the cue and target. Wegner and Gibson also failed to find partial orderings of hazard functions in a target-irrelevant (incongruent) condition, which could be taken as evidence against disengagement. As was explained by Wenger and Gibson, a benefit of this approach is that fitting hazard functions does not require an assumption that data follow a parametric distribution, as is the case with fitting the ex-Gaussian.
University of Scranton undergraduates participated for credit toward a research requirement. Forty-one subjects (23 female, 36 right-handed) completed Experiment 1; 32 subjects (17 female, 26 right-handed) completed Experiment 2; and 27 subjects (19 female, 25 right-handed) completed Experiment 3. Subjects ranged from 18 to 25 years old (M 0 18.96, SD 0 1.05) and all reported normal or corrected-to-normal vision. The task required 45 min, and each subject also completed an unrelated working memory task.
Atten Percept Psychophys (2013) 75:257–277
Attentional Disengagement Predictions
Target-Relevant Cue
Contingent Orienting Hypothesis Predictions
261
Cuing Effects: µ = 50 ms; τ = 0 ms; M = 50 ms
Cuing Effects: µ = 0 ms; τ = 0 ms; M = 0 ms
Cuing Effects: µ = 50 ms; τ = -50 ms; M = 0 ms
Target-Irrelevant Cue
Cuing Effects: µ = 50 ms; τ = 0 ms; M = 50 ms
Fig. 2 Predicted effects on the ex-Gaussian parameters μ and t and on MRT for validly and invalidly cued target-relevant and target-irrelevant cues
Design
Apparatus
Each experiment included the within-subjects factors cue validity (valid vs. invalid) and cue type. Experiment 1 included the between-subjects factor target type (onset vs. color).
Each experiment was programmed and presented with E-Prime v2.0.8.22 software (Psychology Software Tools Inc.) on a Dell 755 computer with a Pentium Core 2 Duo processor (2.33 GHz) connected to a Dell E178Fpv monitor (60 Hz).
262
Atten Percept Psychophys (2013) 75:257–277
Subjects were tested individually and sat 60 cm from the monitor, which was height adjusted. A five-button response box was used for responding, and an OptiCAL RS-232 photometer measured luminance. Stimuli In each experiment, the stimuli appeared in a sequence of frames (Fig. 3). In all frames except for the cue display, five gray placeholders (CIExy, .314, .329; luminance, 20.98 cd/m2) appeared on a black background (0, 0; 0.16 cd/m2). The placeholders were 1.53° × 1.53° with a 2-pixel border. One was centered and contained a gray fixation cross, and the other four were positioned 45°, 135°, 225°, and 315° relative to the twelveo-clock position and designated the potential cue and target locations. The distance between the center of the central placeholder and the center of each peripheral placeholder was 4.31°. On each trial, one of two different cue displays was presented. In onset cue displays, a 1.72° × 1.72° white box (.314, .329; 25.77 cd/m2) was onset over one peripheral placeholder. In color cue displays, a 1.72° × 1.72° box was presented over each placeholder. The box at the central placeholder and three peripheral placeholders were green (.314, .537; 13.74 cd/m2), and the box at the fourth peripheral placeholder was a color singleton. Target displays are described in the Method section for each experiment. Procedure Subjects were informed that they would see a series of displays and that their task was to identity a target with a prespecified feature. Subjects were encouraged to respond quickly but to refrain from making errors by pressing a key on the response box with their left or right index finger (key assignment was counterbalanced). Subjects completed 32 practice trials that did not include a cue display and 64 practice trials in which a cue was presented 150 ms prior Fig. 3 Example trial sequence. In the cue display, the onset cue (top) is the large white placeholder, and the color cue (bottom) is the outlined placeholder among the gray placeholders, which were green in the experiments. Target displays are described in the Method sections
to the target. For this second set of practice trials, the different cue types appeared equally often, but randomly, at each of the four peripheral placeholder locations. On these trials and the data collection trials, the target location was independent of the cue location (cue and target coincided 25 % of the time). A total of 768 trials followed, and subjects were given self-paced breaks every 64 trials. On each data collection trial, the fixation display was presented for 1,000 ms. The cross was erased for a randomly chosen duration of 400–900 ms (increments of 100 ms), which was a warning that the trial had started. A cue display was presented for 50 ms, with the type and location of the cue chosen randomly on each trial. After a randomly chosen CTOA, the target display was presented. In Experiment 1, CTOA ranged from 50 to 300 ms (25-ms increments). In Experiments 2 and 3, CTOA ranged from 50 to 200 ms (50-ms increments). If the response was incorrect or if no response was made within 2,000 ms, a 500-Hz tone was played for 500 ms. The next trial began after 1,000 ms.
Experiment 1 These data were originally published in a study that examined the relationship between working memory and contingent orienting (Burnham, Harris, & Suda, 2011) and are included here because the methodology and stimuli are similar to those in Folk et al. (1992). Subjects were randomly assigned to identify a red target or an onset target, and in each group, a color cue or onset cue preceded the target. It was expected that subjects would enter the target-defining feature into an attentional set that would modulate the cuing effects. The question was whether the observed interaction between target type, cue type, and cue validity in MRT would reflect an influence of μ, t, or both.
X Onset Target (E1)
X
=
X
=
X
=
X
=
+
Fixation (1000 ms)
Warning (400 - 800 ms)
Cue Display (50 ms) Time
CTOA (variable)
Target Display (Response)
Color Singleton Target (E1, E3)
Color Feature Search Target (E2)
Atten Percept Psychophys (2013) 75:257–277
Method Design The design was a 2 (target type: onset vs. color) × 2 (cue type: color cue vs. onset cue) × 2 (cue validity: valid vs. invalid) mixed factorial with target type a between-subjects factor and all other factors randomized within blocks. Subjects were randomly assigned to an onset target group (n 0 20) or a color target group (n 0 21). Stimuli The cue display contained an onset cue or color cue. For color cues, one box at a peripheral placeholder was red (.447, .334; 12.91 cd/m2), and the box at each other placeholder was green (.314, .537; 13.74 cd/m2). For subjects in the onset target group, the target was the single gray X or 0 (24-point Sans Serif font, 0.5° × 0.5°) that appeared at a randomly chosen one of the four peripheral locations. For subjects in the color target group, the target was the single red item X or 0 that appeared with three gray items. The target appeared in a randomly chosen one of the four peripheral locations, and a gray X and 0 appeared in each of the other peripheral locations, with the condition that two Xs and two 0 s appeared in every target display. Results Three analyses were performed. First, MRT and errors were submitted to analyses of variance (ANOVAs) to determine whether contingent capture occurred. Second, analyses were carried out with the parameter estimates (μ, σ, t) that were obtained after fitting an ex-Gaussian function to each subject’s data. Finally, vincentile analyses were performed with RT bin (quantile) included as a factor. For the vincentile analyses, the Greenhouse– Geisser correction was used when sphericity was violated. For each experiment, error trials and trials with RTs shorter than 150 ms were excluded. Of the remaining trials, RTs three standard deviations above or below each subject’s overall mean were removed. Trimming resulted in the removal of 4.2 % of the trials (2.5 % due to error). Trimmed data were used in each analysis, and the patterns did not change in the untrimmed data. RT and error analyses Each subject’s MRT was computed for each cell in the cue type × cue validity design for each target group. Arithmetic means for each cell appear in Table 1. Results of a 2 (target: color vs. onset) × 2 (cue type: color vs. onset) × 2 (cue validity: valid vs. invalid) ANOVA with repeated
263
measures on the factors cue type and cue validity are presented in Table 2. The main effect of cue validity was significant, reflecting faster responding following valid cues. A main effect of target type was due to faster responses to onset targets. The cue type main effect was nearly significant, as was the target type × cue type interaction. Importantly, the three-way interaction was significant. No other effect from the omnibus ANOVA was significant, Fs < 1. The three-way interaction was examined with separate 2 (cue type) × 2 (cue validity) ANOVAs on the onset target group and color target group. In the color target group, the cue type × cue validity interaction was significant, reflecting a larger cuing effect by color cues than by onset cues (Table 1). The interaction was also significant in the onset target group, reflecting a larger cuing effect for onset cues than for color cues. Thus, the results show contingent capture. A 2 (target type) × 2 (cue type) × 2 (cue validity) ANOVA on the errors yielded a significant interaction between target type and cue validity and between cue type and cue validity. The three-way interaction was also significant. No other effects were significant. The three-way interaction reflected a significant cue type × cue validity interaction in the color target group, but not in the onset target group. Ex-Gaussian analysis Kolmogorov–Smirnov tests on the aggregate distributions were significantly different from normal in each condition, and average chi-square goodness-of-fit statistics showed that the RT distributions did not significantly deviate from the theoretical ex-Gaussian (Table 3). Figure 7 in the Appendix shows an ex-Gaussian function overlaid on the data from all subjects in each target type × cue type × cue validity combination. Each bar represents 5 % of the data. As can be seen in Fig. 7, the ex-Gaussian function fits the data very well. Each subject’s data in each cell of the cue type × cue validity design was fit to an ex-Gaussian function using RTSYS (Heathcote, 1996), which uses continuous maximum likelihood estimation to obtain ex-Gaussian parameters. All fits converged within 500 iterations. Table 3 lists the average number of trials used per subject for parameter estimation. Parameter estimates were averaged across subjects and appear in Table 1, and each subject’s parameter estimates for μ, σ, and t were entered into separate 2 (target type) × 2 (cue type) × 2 (cue validity) ANOVAs. Results of the omnibus ANOVAs with follow up analyses are presented in Table 4. For μ, each main effect was significant, as were the twoway interactions with target type. Most important, the threeway interaction was significant, which was examined with separate 2 (cue type) × 2 (cue validity) ANOVAs for the onset target group and the color target group. In the color target group, the cue type × cue validity interaction was
264
Atten Percept Psychophys (2013) 75:257–277
Table 1 Mean response times (in milliseconds), response accuracy (percentages of errors), and ex-Gaussian parameter estimates (μ, σ, t) as a function of cue validity and cue type in Experiments 1–3 and results of t-tests on individual cuing effects with p-values and Cohen’s dz Experiment
Target type
Cue type
Cue validity
MRT
% error
μ
σ
t
E1
Color target
Color
Invalid Valid Difference t p dz Invalid Valid Difference t p dz Invalid
571 535 36 7.91