ESANN'2006 proceedings - European Symposium on Artificial Neural Networks. Bruges (Belgium), 26-28 April 2006, d-side publi., ISBN 2-930307-06-4. 533 ...
ESANN'2006 proceedings - European Symposium on Artificial Neural Networks Bruges (Belgium), 26-28 April 2006, d-side publi., ISBN 2-930307-06-4.
Using Sampling Methods to Improve Binding Site Predictions Yi Sun, Mark Robinson, Rod Adams, Rene te Boekhorst, Alistair G. Rust, Neil Davey Science and Technology Research Institute University of Hertfordshire College Lane, Hatfield Hertfordshire AL10 9AB
Abstract. Currently the best algorithms for transcription factor binding site prediction are severely limited in accuracy. In previous work we combine random selection under-sampling with the SMOTE over-sampling techniques, working with several classification algorithms from the machine learning field to integrate binding site predictions. In this paper, we improve the classification result with the aid of Tomek links, either as an under-sampling technique or to remove further noisy data after sampling.
1
Introduction
In this paper, we address the problem of dealing with imbalanced data in the context of improving the identification of transcription factor binding sites on sequences of DNA using different sampling techniques. There are many different algorithms to search for binding sites [8] in current use. However, most of them produce a high rate of false positive predictions. This is problematic for practicing biologists who wish to validate these results - testing a prediction is costly. In [8], we attempt to reduce these false positive predictions using classification techniques taken from the field of machine learning. One of difficulties in this work is due to the imbalanced dataset. The data has two classes labeled as either binding sites or non-binding sites, with about 93% being non-binding sites. In previous work, we combine random selection under-sampling and SMOTE over-sampling techniques. Here we extend this to use Tomek links as an under-sampling method.
2
Problem Domain
One of the most exciting and active areas of research in biology currently, is understanding how the exquisitely fine resolution of gene expression regulation is at the molecular level. Cis-regulatory DNA elements form the nodes connecting the genes in the regulatory networks, controlling many important biological phenomena, and as such are an essential focus of research in this field. One set of regulatory interactions are those between a class of DNA-binding proteins known as transcription factors and short sequences of DNA which are
533
ESANN'2006 proceedings - European Symposium on Artificial Neural Networks Bruges (Belgium), 26-28 April 2006, d-side publi., ISBN 2-930307-06-4.
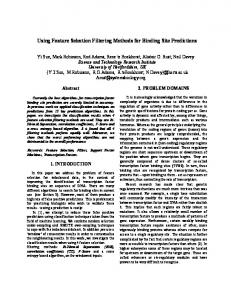
bound by the proteins by virtue of their three dimensional conformation. Transcription factors will bind to a number of different but related sequences. Unfortunately, this complicates the problem of predicting the cis-regulatory elements from out of the random background of the non-coding DNA sequences. The current state of the art algorithms for transcription factor binding site prediction are, in spite of recent advances, still severely limited in accuracy. There is however good reason to believe that the predictions from these different classes of algorithms are complementary and could be integrated to improve the quality of predictions. In the work described here we take the results from the 12 aforemention algorithms and combine them into 1 feature vector. More details about these 12 algorithms can be seen in [8]. We then investigate whether the integrated classification results of the algorithms can produce better classifications than any one algorithm alone (see Figure 1). Known binding sites 1 −1 1 −1 −1 −1
1 −1 0.9
Gene sequence A G C T C T
single meta classifer
−0.47
12
0.6 −1
Sampling
results
Predictions −1 −1 1
1
−1 −1
12 algorithms
Fig. 1: The 12 algorithms give their own prediction for each sequence position and one set of predictions is shown. The 12 results are combined as input to a classifier.
3
Sampling Techniques for Imbalanced Dataset Learning
The data is a large sample of annotated yeast promoter sequences, and is extracted from the SCPD database1 . It consists of 67782 12-ary real vectors each with an associated binary label. In this work, we use the first about 2/3 as a training set and the last 1/3 the test set. Amongst the data there are repeated vectors, some with the same label (repeated items) and some with different labels (inconsistent items). It is obviously unhelpful to have these repeated or inconsistent items in the training set, so they are removed. After their removal, the training set is still 89% non-binding sites. 1 http://rulai.cshl.edu/SCPD/
534
ESANN'2006 proceedings - European Symposium on Artificial Neural Networks Bruges (Belgium), 26-28 April 2006, d-side publi., ISBN 2-930307-06-4.
3.1
Sampling techniques
Since the dataset is imbalanced, the supervised classification algorithms will be expected to over predict the majority class, namely the non-binding site category. There are various methods of dealing with imbalanced data [5], classified as algorithm-based and data-based methods. So far we concentrate on the databased method. In [1], the authors evaluated 10 different samplings methods on 13 UCI imbalanced datasets using the C4.5 learning algorithm. They showed experimentally that in general over-sampling methods provide more accurate results than undersampling methods. Moreover, they proposed that Tomek links [9] and Wilson’s Edited Nearest Neighbour Rule (ENN) [10] can be used to clean up noisy data after over-sampling with SMOTE [3]. • Tomek links Tomek links are links between 2 points (Ii , Ij ) from different classes that are closer together than any other pair from the 2 classes involving Ii or Ij . The distance between the two patterns is d(Ii , Ij ). If for any other pattern Il in the dataset d(Ii , Ij ) satisfies d(Ii , Ij ) < d(Ii , Il ) or d(Ii , Ij ) < d(Ij , Il ), then the pair (Ii , Ij ) is called a Tomek link . When Tomek links are used as an under-sampling method, only patterns from the majority class are removed. However, when used for removing noisy data, items may be removed from both classes. • ENN ENN removes a pattern if the majority of its K nearest neighbours are not in its class. Here we use K = 3. • SMOTE The aim of the SMOTE method is to synthetise new patterns by applying majority voting to each of the attributes of the K-nearest neighbours of each patterns in the minority class. In [8] we apply Random selection (R) under-sampling for the majority class (negative examples) and SMOTE (S) over-sampling for the minority class (positive examples), denoted by R-S. Here our aim is to improve classification results using more competitive sampling techniques on the training set. We apply a new combination of Tomek links and SMOTE for under- and over-samplings, respectively, denoted by T-S. In order to investigate whether points located near the decision boundary have a negative effect on training, or represent noise, we additionally used Tomek links and ENN to remove data from both classes after sampling, denoted by T-S(Tomek), R-S(Tomek), T-S(ENN) and R-S(ENN). Since the data is a mixed set of binary and continuous features, we apply Heterogeneous Value Difference Metric (HVDM) [11] for calculating distances. The actual ratio of minority to majority class is determined by the under-sampling rate of the majority class. According to our previous experience, we set the final ratio to a half, which has previously been shown to work well [8].
535
ESANN'2006 proceedings - European Symposium on Artificial Neural Networks Bruges (Belgium), 26-28 April 2006, d-side publi., ISBN 2-930307-06-4.
4
Classifier Performance
To evaluate classifiers used in this work, we apply a range of standard reference metrices defined in Table 1, where N is the number of true negative samples; FP is false positive samples; FN is false negative samples; TP is true positive samples. Table 1: Definitions of several common performance metrics TP , (TP + FN) F-Score = 2·Recall·Precision , Recall+Precision Recall =
CC =
5
�
TP , (TP + FP) FP FP Rate = FP+TN ,
Precision =
TP·TN−FN·FP . (TP +FN)(TN+FP)(TP+FP)(TN+FN)
Experiments and Results
5.1
Experiments
We test these sampling methods on three learning algorithms: Single Layer Networks (SLN) [2], the Support Vector Machine (SVM) [7] and Rules Sets derived from C4.5 decision trees [6]. The SVM experiments were completed using libsvm2 . The C4.5-Rules experiments were undertaken using C4.5 software from [6]. C4.5-Rules is a companion program to C4.5. It creates rules sets by postprocessing decision trees generated using the C4.5 algorithm first. The SLN was implemented using the Netlab toolbox3 . All user-specified parameters are chosen using cross-validations. The cross-validation performs similarly as in [8]. These results are compared with the best base algorithm, which is the one with the highest F-Score among the 12 base algorithms, majority voting, weighted majority voting (see [8] for further details), and the SLN trained with raw imbalanced data (the SVM and C4.5 give similar performance to the SLN). 5.2
Results
Table 2 shows that almost all F-Scores with R-S(ENN) and R-S(Tomek) are improved when compared with each corresponding classifier on samplings from R-S. The SVM with R-S(Tomek) samplings gives the overall best F-Score and CC value, and also decreases the FP-Rate compared with simple R-S samplings. 2
http://www.csie.ntu.edu.tw/∼cjlin/libsvm 3
http://www.ncrg.aston.ac.uk/netlab/
536
ESANN'2006 proceedings - European Symposium on Artificial Neural Networks Bruges (Belgium), 26-28 April 2006, d-side publi., ISBN 2-930307-06-4.
Table 2: Performance metrics reported for the unfiltered possible binding sites with inputs sampled using random selection for under-sampling and SMOTE for over-sampling. Input
Classifier
best Alg. No smapling
MV WMV SLN
R-S
SLN SVM C4.5-Rules
R-S(ENN)
SLN SVM C4.5-Rules
R-S(Tomek)
SLN SVM C4.5-Rules
Recall 0.400 0.151 0.244 0.036 0.248 0.305 0.274 0.298 0.318 0.287 0.253 0.283 0.224
Precision 0.222 0.298 0.374 0.700 0.365 0.326 0.287 0.340 0.323 0.306 0.389 0.383 0.326
F-Score 0.285 0.200 0.295 0.069 0.295 0.315 0.280 0.318 0.321 0.296 0.306 0.325 0.265
FP Rate 0.106 0.027 0.031 0.001 0.033 0.048 0.052 0.044 0.051 0.049 0.030 0.034 0.035
CC 0.226 0.171 0.260 0.149 0.258 0.266 0.227 0.270 0.270 0.245 0.273 0.286 0.225
In addition, using Tomek links as a cleaning method decreases the FP-Rate compared to no cleaning. McNeamar’s test [4] is taken to compare the classification results of R-S with R-S(Tomek) on the SVM. The P-value is less than 0.0001. The difference is considered to be extremely statistically significant. Table 3 shows that SLN and C4.5-Rules with T-S(ENN) and T-S(Tomek) samplings are better than their corresponding classifier with T-S samplings. But the SVM performs better on T-S samplings considering all of F-Score, FP-Rate and the CC value. In addition, comparing R-S (see Table 2) with T-S (see Table 3), it shows that Tomek under-sampling scheme gives better results than random selection on the SLN and SVM. It can be seen from Tables 2 and 3 that the best results of F-score and CC are all obtained from the SVM. Overall, R-S(Tomek) and T-S working with the SVM performs best considering F-Score, FP-Rate and the CC value together.
6
Conclusions
The first point to be made is that the Tomek links method improves performance when used for under-sampling of the majority class with the SLN and SVM classifiers. The second conclusion is that the Tomek links method is also useful when used to remove noisy data after sampling, as random under-sampling and SMOTE over-sampling techniques are used with the SLN and SVM classifiers.
537
ESANN'2006 proceedings - European Symposium on Artificial Neural Networks Bruges (Belgium), 26-28 April 2006, d-side publi., ISBN 2-930307-06-4.
Table 3: Performance metrics reported for the unfiltered possible binding sites with inputs sampled using Tomek link for under-sampling and SMOTE for oversampling. Input
Classifier
best Alg. No smapling
MV WMV SLN
T-S
SLN SVM C4.5-Rules
T-S(ENN)
SLN SVM C4.5-Rules
T-S(Tomek)
SLN SVM C4.5-Rules
Recall 0.400 0.151 0.244 0.036 0.250 0.294 0.240 0.307 0.332 0.278 0.265 0.292 0.265
Precision 0.222 0.298 0.374 0.700 0.387 0.369 0.238 0.348 0.303 0.254 0.397 0.342 0.251
F-Score 0.285 0.200 0.295 0.069 0.304 0.327 0.238 0.326 0.317 0.265 0.318 0.315 0.258
FP Rate 0.106 0.027 0.031 0.001 0.030 0.038 0.059 0.044 0.058 0.062 0.030 0.043 0.060
CC 0.226 0.171 0.260 0.149 0.270 0.285 0.179 0.280 0.263 0.207 0.284 0.269 0.200
References [1] G. E. A. P. A. Batista, R. C. Prati, and M. C. Monard, “A study of the behavior of several methods for balancing machine lerning training data”, Sigkdd Explorations, Vol. 6, Issue 1, 2004. [2] C. M. Bishop. (1995) Neural Networks for Pattern Recognition. Oxford University Press, New York. [3] N. V. Chawla, K. W. Bowyer, L. O. Hall and W. P. Kegelmeyer, “SMOTE: Synthetic minority over-sampling Technique,” Journal of Artificial Intelligence Research. Vol. 16, pp. 321-357, 2002. [4] T. G. Dietterich, “Approximate statistical tests for comparing supervised classification learning algorithms”, Neural Computation, Vol. 10, No. 7, pp1895-1923, 1998. [5] Wu, G and Chang, E. Y.: Class-boundary alignment for imbalanced dataset learning. Workshop on learning from imbalanced datasets, II, ICML, Washington DC, 2003. [6] J. R. Quinlan, C4.5: Programs for Machine Learning, Morgan Kauffman, 1993. [7] B. Scholk¨ opf and A. J. Smola, Learning with Kernels: Support Vector Machines, Regularization, Optimization, and Beyond, The MIT Press, 2002. [8] Y. Sun, M. Robinson, R. Adams, P. Kaye, A. G. Rust and N. Davey, “Using real-valued meta classifiers to integrate binding site predictions”, Proceedings of International Joint Conference on Neural Networks 2005. [9] I. Tomek, “Two modifications of CNN”, IEEE Transactions on Systems Man and Communications SMC-6. 769-772, 1976. [10] D. L. Wilson, “Asymptotic properties of nearest neighbor rules using edited data”, IEEE Transactions on Systems Man and Communications, 2:3, 408-421, 1972. [11] D. R. Wilson and T. R. Martinez, “Reduction techniques for examplar-based learning algorithms”, machine Learnning. 38:3, 257-286, 2000.
538