Hindawi Publishing Corporation Computational Intelligence and Neuroscience Volume 2016, Article ID 2476256, 14 pages http://dx.doi.org/10.1155/2016/2476256
Research Article Using Self-Organizing Neural Network Map Combined with Ward’s Clustering Algorithm for Visualization of Students’ Cognitive Structural Models about Aliveness Concept Nurettin Yorek, Ilker Ugulu, and Halil Aydin Faculty of Education, Dokuz Eylul University, Buca, 35150 Izmir, Turkey Correspondence should be addressed to Nurettin Yorek;
[email protected] Received 20 July 2015; Revised 14 October 2015; Accepted 18 October 2015 Academic Editor: Jens Christian Claussen Copyright © 2016 Nurettin Yorek et al. This is an open access article distributed under the Creative Commons Attribution License, which permits unrestricted use, distribution, and reproduction in any medium, provided the original work is properly cited. We propose an approach to clustering and visualization of students’ cognitive structural models. We use the self-organizing map (SOM) combined with Ward’s clustering to conduct cluster analysis. In the study carried out on 100 subjects, a conceptual understanding test consisting of open-ended questions was used as a data collection tool. The results of analyses indicated that students constructed the aliveness concept by associating it predominantly with human. Motion appeared as the most frequently associated term with the aliveness concept. The results suggest that the aliveness concept has been constructed using anthropocentric and animistic cognitive structures. In the next step, we used the data obtained from the conceptual understanding test for training the SOM. Consequently, we propose a visualization method about cognitive structure of the aliveness concept.
1. Introduction Although biology is named as “a science of the living things,” a clear definition of “aliveness” concept cannot be made. Because of scientific uncertainty as well as moral, legal, and theological aspects in this concept, it is difficult to make an exact definition [1]. Therefore, aliveness emerges as one of the most difficult concepts to be explained. Perhaps because of this difficulty, it is seen that there are relatively small numbers of studies examining the concept of aliveness as a main theme in the literature. Studies are generally focused on the classification of living things and mainly animals by the students (examples from other researches on the subject are given below). The studies in the field of cognitive psychology and neuroscience were mainly focused on the studies consisting of category-specific knowledge deficit or category-specific impairment about the living things (e.g., [2–8]) and the mental representation of living/nonliving distinction with the examination of the brain with modern imaging methods [9–11]. Bardel [12] revealed some conceptual models about the aliveness concept. Two of them are listed as animistic and
vitalist models. In animistic model, the concepts of aliveness and motion are discussed. It is explained that motion is not only intrinsic to the living things by looking at the fact that vehicles such as cars and planes move. Also according to this model, it was stated that animals would be seen as in the forefront in terms of aliveness compared to plants, and as a result of this, it was emphasized that “animistic misconceptions” would occur. In addition to this definition of Bardel [12], it was seen that there were many studies containing the aliveness identified with motion especially in early childhood (e.g., [13–18]). Besides, there are some studies indicating the existence of animistic thinking about living things also in many elderly people [19]. Also in studies carried out in different age groups, it was emphasized that motion lays behind the fact that the subjects were interested in animals rather than plants [20, 21]. Babai et al. [22] argued that aliveness was entirely associated with motion (movement = alive) as a naive and intuitive concept, and this was riveted by protecting its existence until adulthood. Dellantonio et al. [23] suggested that categorization as an animate/inanimate was more fundamental according to distinction such as living/nonliving or biological/nonbiological.
2 According to this distinction, concept of motion was associated with aliveness. In the same study, it was argued that human was in a different position in terms of “vitality” and was shown in a separate category. As a result, it was stated that the perception of aliveness followed up a row in the form of “human-animal-plant” [24]. In their research about aliveness, Caravita and Falchetti [25] addressed the question “Is a piece of bone taken from a live body also alive outside the body?” to the subjects. Most of the students answered this question as “yes,” and they mostly showed the style marks of motion, structure, function, and the bone as evidence. As a result of an interesting research focused on the genetic basis of living/nonliving distinction, it was reported that aliveness concept was an innate category organized in semantic memory [26]. In his researches examining the classification of animals by the students, Braund [27, 28] expressed that the alternative concepts, misconceptions, naive theories, and some preconcepts developed against scientific concepts by the students were clear barriers against the teaching of scientific subjects. In his researches stating that the students were mostly interested in vertebrates, Braund [27, 28] revealed that 12-year-olds perceived the turtle like a slug and grouped it as an invertebrate animal. Some of the 12- and 15year-old students described the penguin as bird, some of them described it as fish, and some of them described it as mammal. This situation showed that students took into account the external appearances of the living things while reconstructing the aliveness concept as well as motion [16]. In his study investigating the “personal taxonomic criteria” used by the students while classifying animals, Kattmann [29] suggested that students mostly used nonscientific classification criteria (swimmers, four-legged, two-legged, flying, etc.). Also, he stated that nontaxonomic criteria were at higher rate than the taxonomic criteria used. Kattmann [29] stated that students mostly took into account the external appearances rather than biological classification while classifying animals, and they performed grouping according to the motion forms (flying, swimming, and so on) that they used for the purposes of the place they lived in and change of location. Moreover, he stated that this method used by the students to classify the animals remained unchanged even though they were taught biological classification. Similar results were reported also in the studies carried out on Turkish students [30]. Some researches examining the thoughts of the students about plants are found in the literature even though they are few in number. In one of these, it was stated that students mostly evaluated the plants by their anatomic properties and external appearances while grouping them (Tunnicliffe & Reis, 2000). Wandersee and Schussler [31, 32], as botanist and biology educators, investigated the reasons why people showed interest in animals rather than plants. As a result of their studies, they formulated the plant blindness theory as a new concept. Wandersee and Schussler [31, 32] described this theory as follows: incomprehension of the value that plants had for the atmosphere and the human life, inability to appreciate the aesthetic and biological properties
Computational Intelligence and Neuroscience of the plant kingdom, and, consequently, coming to the conclusion that animals were more valuable than plants in terms of benefit to humans with an anthropocentric perspective. There are numerous studies related to artificial intelligence approach in which conceptual modeling is “generally” evaluated (some of the leading ones, [33–36]). Besides, there are also studies about cognitive structuring modeling of concepts in relation to living creatures. Among these, we see that studies in which texts that include animal names (mostly simple sentences) are analyzed by using SOM are much more common [37, 38]. Furthermore, Ritter and Kohonen [37] have formulated the self-organizing symbol map by using logical similarities of some animals (duck, dog, cat, lion, etc.) and their characteristics (being small, being big, having 2 legs, having 4 legs, liking to fly, liking to swim, etc.). Although it is suggested that anthropocentric and animistic misconceptions are effective in cognitive structuring of aliveness concept, it is not that easy to explicitly visualize and expose that structuring. Yorek et al. [24] have questioned whether there can be a distinction among living creatures due to aliveness based on “animistic-anthropocentric model” they have developed. In another study, which uses the same model, subject was evaluated with fuzzy and rough set approaches and a mathematical model was suggested [39]. We initiated this study with the question “How can we use SOMs in analyzing and visualizing cognitive structure of aliveness concept?” with the motivation of the idea of so called mathematical approach. How we gathered data and how we realized the analysis are explained in the following chapters of this study.
2. Artificial Neural Networks Artificial neural networks (ANNs) are mathematical models inspired by biological neural networks contained in human brain. Having similar characteristics to those of biological neural networks (i.e., consistency, flexibility, parallel function, tolerance to errors, etc.), these systems attempt to learn tasks and determine how they will react to new tasks by means of creating their own experiences through the data obtained by using the predetermined samples [40]. Neural networks can be used to model complex relationship without using simplifying assumptions, which are commonly used in linear approaches [41]. The other advantages of the ANNs are the ability to represent both linear and nonlinear relationships, the ability to learn these relationships directly from the data used, not needing to take into account detailed information of structures and interactions in the systems, and the fact that they are regarded as ultimate blackbox models. At least in some cases if not always, that is, for prediction using the trained network, the ANN systems are alternative to experimentation and save a lot of time which may have been consumed since experimentation is so difficult and in some cases is impossible. Artificial neurons based on biological neurons were first defined by McCulloch and
Computational Intelligence and Neuroscience x1
3
w1
xi
wi
···
wn
Winner neuron
X ∑
f(net)
y Y
xn
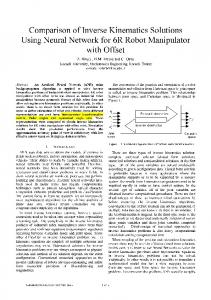
Figure 1: Representation of an artificial neuron. wij
Pitts [42]. McCulloch-Pitts (MCP) neuron model is given in Figure 1. In all neural network models, 𝑥𝑖 input values are multiplied by 𝑤𝑖 connection weights and then summed up. Summation unit is compatible with the body of biological neuron. It sums up weighted inputs and then gives the net output (𝑦 = 𝑓(net)). 2.1. Self-Organizing Maps. A self-organizing map (SOM, also known as Kohonen map) is a type of the artificial neural algorithm and is based on unsupervised learning. The structure of SOMs is composed of two layers fully attached to each other: input layer and Kohonen layer [43]. Kohonen layer is also the layer where the map is formed that will ensure the observation of clustering in the data set. Hidden layers are not in question as in prediction or classification studies. Neurons in the Kohonen layer are generally arranged twodimensionally. The number of neurons in the input layer is equal to the number of variables used. Each neuron in the input layer is connected to each neuron in Kohonen layer as feed forward. Inputs can be calculated by the following for the Kohonen layer:
···
xn
Input vector
Figure 2: SOM input and output layers.
The expression of 𝑑 in (2) represents the total number of neurons in the Kohonen layer. In order to find the best match of weight vectors 𝑤𝑗1 , 𝑤𝑗2 , . . . , 𝑤𝑗𝑑 with 𝑥 input observation, 𝑤1 𝑥, 𝑤2 𝑥, . . . , 𝑤𝑑 𝑥 scalar products are calculated and the largest one is selected. The criteria of finding the best match based on the selection of the largest one of the scalar products are equal to the mathematical maximization of Euclid distance between 𝑤𝑗 vector and 𝑥. Therefore, the index of the winning neurons for observation is calculated as follows: 𝑖 (𝑥) = arg min 𝑥 − 𝑤𝑗 . 1≤𝑗≤𝑑
(3)
(1)
𝑖=1
𝑤𝑗𝑖 in (1) is the weight of the connection outgoing from the input neuron represented by 𝑖 to the neuron represented by 𝑗 in Kohonen layer. The weight vectors are collectively known as the SOM’s memory [44]. 𝑑 represents the number of variables. When considering the winner-take-all paradigm, the neuron taking the highest 𝑦𝑗 value in Kohonen layer will be the winner neuron. The SOM algorithm firstly assigns small random values to the connections between input layer and the Kohonen layer. Then, the algorithm undergoes three essential processes. These are competition, cooperation, and adaptation [45]. Competition Process. A random observation (student) is selected from the data set. This observation can be expressed as 𝑥 = (𝑥1 , 𝑥2 , . . . , 𝑥𝑑 ). In Kohonen layer, the expression of weights of the neuron 𝑗 is possible as follows: 𝑤𝑗 = (𝑤𝑗1 , 𝑤𝑗2 , . . . , 𝑤𝑗𝑑 ) , 𝑗 = 1, 2, . . . , 𝑑.
x2
For each input in the competition process, neurons in the model are in competition with each other.
𝑑
𝑦𝑗 = ∑𝑤𝑗𝑖 𝑥𝑖 .
x1
(2)
Cooperation Process. In the cooperation process, a topological neighborhood is determined, and the cooperating neurons will settle according to the topological neighborhood such that the winner neuron will be at the center. The winner neuron determines the topological value of the neurons affected by competition; therefore, cooperation is ensured between nodes. Adaptation (Synaptic Compatibility). Neurons affected by competition arrange their synaptic weights according to the example. The new weight vector in (𝑠 + 1) cycle of neuron 𝑗 is calculated as follows: 𝑤𝑗(𝑠+1) = 𝑤𝑗𝑠 + 𝜂 (𝑠) ℎ𝑗,𝑖(𝑥) (𝑠) (𝑥 − 𝑤𝑗(𝑠) ) .
(4)
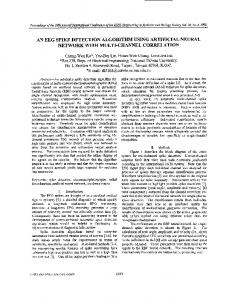
Here, 𝜂(𝑠) is the learning parameter and ℎ𝑗,𝑖(𝑥) (𝑠) is the neighborhood function. Neurons are connected to each other by neighborhood relation. This neighborhood relation determines the structure or topology of the map. Figure 2 represents a simple SOM.
4
Computational Intelligence and Neuroscience
Kohonen layer consisting of 9 × 7 neurons appears in the figure. The input vector is represented by 𝑥 and there are variables in this vector (it is expressed that 𝑛 number of variables exist in the expression of 𝑥𝑛 ). The weight vector is represented by 𝑤 and it contains the weights outgoing from each variable to the each neuron. The yellow-colored neuron represents the winner neuron and the surrounding neurons are its neighbors. 2.2. The Ward Clustering in General. The Ward classic clustering method is a hierarchical agglomerative cluster algorithm. Clustering process is initiated by accepting each node as a separate cluster. Then, at each stage of the algorithm, the clusters with minimum distances between themselves (according to the distance measure defined by a specific algorithm) are combined in pairs. This smallest distance is called the Ward distance and defined as follows: 𝑛 ⋅𝑛 2 𝑑𝑟𝑠 := 𝑟 𝑠 ⋅ 𝑥𝑟 − 𝑥𝑠 . (5) 𝑛𝑟 + 𝑛𝑠 Here, 𝑟 and 𝑠 represent the two distinct clusters, 𝑛𝑟 and 𝑛𝑠 represent the data points of two clusters, 𝑥𝑟 and 𝑥𝑠 represent the center of gravity of the clusters, and ‖ ⋅ ‖ is Euclidean norm. Starting from the full distance matrix (lower triangle matrix as the distance measure is commutative), a row and a column are removed in each step until the matrix is completely cleared and only one cluster will remain (and a different row and column are updated). The mean and cardinality of the new cluster built as a product of the combination phase are calculated as follows: 𝑥(new) := 𝑟 𝑛𝑟(new)
1 ⋅ (𝑛𝑟 ⋅ 𝑥𝑟 + 𝑛𝑠 ⋅ 𝑥𝑠 ) , 𝑛𝑟 + 𝑛𝑠
(6)
:= 𝑛𝑟 + 𝑛𝑠 .
2.3. The SOM-Ward Clustering. The two main ways to cluster data are hierarchical and partitive approaches. The hierarchical methods can be further divided into agglomerative and divisive algorithms, corresponding to bottom-up and topdown strategies, to build a hierarchical clustering tree. Of these, agglomerative algorithms are more commonly used than the divisive methods [46]. The SOM-Ward clustering approach is a two-level clustering approach that uses Ward’s clustering algorithm to determine the SOM and clustering results. The Ward clustering algorithm is an agglomerative hierarchical clustering method [18, 47]. Agglomerative clustering algorithms usually have the following steps [46]: (1) Initialize: assign each vector to its own cluster. (2) Compute distances between all clusters. (3) Merge the two clusters that are the closest to each other. (4) Return to step (2) until there is only one cluster left. In the SOM-Ward clustering approach, process begins by accepting each node as a separate cluster. Until one cluster
will remain on the map, clusters with minimum Euclidean distance between themselves are combined with each other in pairs. While determining the distance, both the Ward distance and the topological properties of SOM are taken into account. In other words, the distance between two nonassociated clusters is considered as infinite and only the associated clusters are combined. Low SOM-Ward distance value represents a more natural clustering for the map, and high value represents an artificial clustering for the map. By this means, users can select the optimal cluster number in a flexible manner. 2.4. Cognitive Structural Modeling and SOMs. Although using of SOM is recommended in conceptual modeling studies [34, 35], it is suggested that SOM modeling in executive functions of brain such as reasoning and language faces some difficulties. Since self-organized maps reflect simple distance relations among input vectors, they mostly characterize lower levels of perception. For high level processing, discrete symbols are needed. Maps formed by these symbols in brain are composed of logically related symbols coating neighboring areas [37]. Similarly, G¨ardenfors [33, 48], while explaining representing information on conceptual level in his conceptual spaces theory, associates quality dimensions with similarity and distance concepts [34, 49, 50]. When the neural adaptation law (4) is applied to a vector variables set, a topographic map is being obtained that shows logical distance among symbols. But logical relatedness between different symbols cannot be directly determined by their encodings. At least in learning process, symbols should be regularly presented due to their attribute values. From these, we can come up with the conclusion that symbols with similar characters are represented close to each other on map [37]. Results obtained from text analysis prove that SOMs can be safely used in high dimensional data analysis such as independent component analysis (ICA), principal component analysis (PCA), and singular value decomposition (SVD) [35, 38, 51]. In these studies, SOMs can be used single, while they can also be combined with different models (Bayesian, etc.) [36]. This study reports on the discussion of how to utilize the SOMs in the modeling and visualization of the cognitive construction of aliveness concept. In this regard, the questions that we searched for an answer to are as follows: Which living things are primarily associated with the aliveness concept by the subjects? and How can we use SOMs in modeling and visualization of cognitive construction of aliveness concept?
3. Method Qualitative data obtained from student answers to openended questions were used to create SOM-Ward model. 3.1. Subjects. The participants included 100 students (55 female and 45 male) who were selected via cluster sampling
Computational Intelligence and Neuroscience
5
Table 1: Conceptual understanding test.
1
Questions Write the names of the first 10 living things coming to your mind.
2
It is estimated that there are millions of species living on Earth. If you were asked to classify all the living things (types, species) into main groups, without leaving anyone out, at least how many groups could you form?
3
When considering the all living things, what is the place (position) of human? Please explain.
method from nine high schools in Izmir, a large city in western Turkey. Schools accepted students from different parts of the city and students varied in terms of socioeconomic status. 3.2. Data Collection. In this study, a conceptual understanding test was used. The test included open-ended questions and was developed by researchers. In addition, to clarify vague concepts and to obtain in-depth information about the topics, interviews were conducted with students and teachers. The final version of the test used in this study is presented in Table 1.
4. Results 4.1. Conceptual Understanding Test Results Question 1. When analyzing all of 10 living things written by the students, those most frequently repeated were, respectively, human, dog, cat, mouse, and rabbit. It was observed that 107 (74.31%) of 144 different living things written were animals, 26 (18.05%) of them were plants, and the remaining 11 (7.64%) were other living things. Those that were most frequently written in animals (51.43%) were the mammals. It was observed that it was the human which was mostly written to the first rank among 10 living things. When looking at the answers of the students who wrote at least one plant name among the answers, it was observed that they wrote plant to the 6th rank among 10 living things. According to this, it could be said that students structured the “aliveness concept” by associating with the animals, particularly with human. In this structuring, it was believed that plants and other living things came after human and animals in terms of aliveness. Question 2. When analyzing the answers of the students to the second question about the separation of living things (types of living things) into certain groups, about one-third of the students (35%) created the groups consisting of “animal, plant, and human.” The most interesting result of the answers given to this question was that of 24% of students; in other words, one out of every four students created just “animal” groups during grouping.
Aim Uncovering which living thing is primarily associated with the aliveness concept. Uncovering which properties of the living things are paid attentions by the students while dividing them into groups, how they created their own taxonomic groups, how they expressed this conceptually, or how they called the groups. Clarifying the reasons why the students evaluated the human in a separate category while grouping the living things in the nature based on their own statements.
Question 3. When analyzing the answers of the students to the third question about the position of human within all living things, 78% of students emphasized the human’s ability of being intelligent and of thinking. Starting from this point, they defined the position of human as the “most excellent,” “most sophisticated,” and thus “the most supreme being.”
4.2. Creating the SOM-Ward Model 4.2.1. Data Preprocessing for Training of the SOM-Ward Model. For the training of the SOM-Ward model, the answers given to the first question were taken into account by the students’ conceptual understanding test. The data obtained from the other questions were used in the verification of the answers given to the first question and in the interpretation of the SOM-Ward model. Firstly, 144 living things written by the students were collected under 10 groups (Table 2). While these groups were determined, animals were mostly included as students wrote the name of animal at the most. Then, a code was defined for each group (Table 3). In the next step, living things written by each student (S1 , S2 , . . . , S100 ) were coded and tabulated by preserving their ranks (R1 , R2 , . . . , R10 ). An example of students’ responses is seen in Tables 4 and 5, respectively. In the next phase, standardization process was performed because the data set presented in Table 5 is categorical. However, there was no difference among these values as these values (the numbers from 1 to 10) symbolized the groups. In case of using these data as such, analysis results will be incorrect as “1” will bear the meaning of “the lowest” and “10” will bear the meaning of “the highest.” In this respect, a new arrangement was made for figures to denote the same meaning for the variables. A new table was created by calculating on which ranks the students wrote the living things on average. In this case, the living thing with low average rank would be more important in terms of “aliveness” compared to the living thing with high average rank. And this value is of the same meaning for each living thing group. We determined the average rank of the living things. The average rank was determined as follows: for a group of living things we found, from one to 10, at which ranks (R1 , R2 , . . . , R10 ) they were listed. Then, for each line, these values were added
6
Computational Intelligence and Neuroscience Table 2: Grouping of living things written by the students (as it is written).
1 Euglena Bacterium Amoeba Mushroom Algae Paramecium Monera Protists Plasmodium Plankton Planaria
6 Snake Crocodile Lizard Turtle Reptile Chameleon Iguana Dragon
2
3
Daisy Plant(s) Tree(s) Rose Flower(s) Cactus Grass Fern Tulip Chrysanthemum Sunflower Hyacinth
Blackberry Lotus Jasmine Mistletoe Purslane Daffodil Kiwi Snowdrop Willow Geranium Begonia Violet
7 Bird(s) Eagle Bat Penguin Parrot Falcon Pigeon Duck Cock, Rooster Chicken, Chick Owl Partridge Sparrow Hawk Canary Ostrich Vulture
Lion Bear Tiger Monkey Giraffe Elephant Whale Wolf Fox Gorilla Dolphin Kangaroo Koala Hippopotamus Zebra Hedgehog Animal(s)
Parasite(s) Earthworm Spider Beetle(s) Butterfly Bee Grasshopper Scorpion Fly Ant Caterpillar Cancer Millipede 8
together and then divided by the total frequency, for example, code 9 for the student S1 in Table 5; this code was listed five times on the 3rd, 5th, 6th, 9th, and 10th ranks. Accordingly, the average rank was calculated as (3 + 5 + 6 + 9 + 10)/5 = 6.60. The following is an example which was formed according to Table 5 in this way (Table 6). The data in Table 6 are still not suitable for training the SOM. Because if “human” is mentioned as the first object, that is, as the most prominent example of “living,” “human” gets a value of 1 according to the rank in the list (plus an averaging over objects belonging to the same biological category, which is fine). However, this leads to the emergence of a problem. If any entity belonging to biological category “fish” is not mentioned at all by a student in the 10 first alive objects list, it gets a value 0.00 (see, e.g., first row of Table 6). This means that, in this metric of similarity, “no mention” is the closest to “mentioned as the first thing in the list.” Of course, “no mention” should be most similar to “mentioned as the last thing in the list.” If something is not mentioned by a subject,
Squirrel Panda Monk seal Leopard Weasel Panther Vertebrate Tapir Gazelle Cougar Skunk Cheetah Rhinoceros Otter Anteater Hyena Pork Lynx
Sea cucumber Tick Snail Hydra Invertebrate Jellyfish Calamari Mussel Mantis Sponge Cockroach Ladybug Octopus 9 Dog Cat Mouse Rabbit Cow Horse Donkey Sheep Ox Camel Goat Mammal(s) Calf Lamb Buffalo Lama Mule Bull
4 Fish(es) Shark Stingray
5 Frog
10 Human, human names
it is not a very prototypical sample of “alive” and therefore should have a low value of “aliveness.” All the data in Table 6 were subtracted from 11 for eliminating the problems; that is, if “human” is mentioned as first thing in the list of 10 objects, it gets “aliveness” value of 11 − 1 = 10. If it is the second, it gets value of 9. And so on, the 10th object gets value of 1. Then, something that is not mentioned at all, such as the “fish” for student S46 , can then get value of 0. Accordingly, Table 7 was created. The values exemplified in Table 7 were calculated for each student. This 10-dim data (𝑥1 , 𝑥2 , . . . , 𝑥10 ) were used in the training of the SOM-Ward model (Table 9). 4.3. The SOM-Ward Model Results. For clustering and visualization of cognitive construction of aliveness concept, the SOM-Ward model was trained by batch training algorithm. Matlab and Viscovery SOMine software were used in the creation of SOM [52].
Computational Intelligence and Neuroscience Table 3: Groups’ definitions (according to biological classification). Code 1
Groups Prokaryotes, protists, and funguses
2
Plants
3
Animals
4 5 6 7 8
Animals Animals Animals Animals Animals
9
Animals
10
Animals
Explanation Bacterium, algae, amoeba, unicellular eukaryotes, Mushrooms, and so forth Flowering and nonflowering plants All invertebrates, insects, mollusks, and so forth Fishes Amphibians Reptiles Birds Wild mammals Domestic mammals and pets Human
4.3.1. Clustering and Visualization of the Clusters. The SOM cannot fully give detailed information about the clusters. In the Viscovery SOMine program, hierarchical clustering algorithm and the SOM are used together, and the interpretation of the resulting maps will be easier. This clustering algorithm operates as follows: firstly, each student (observation) is divided into a separate cluster. In this way, the number of clusters will be equal to the number of observations. Then, in each step, observations which are the closest to each other are combined according to the SOM-Ward distance measure. In this special distance unit, both the distance of the two clusters and the location on the map are taken into account. All 10 variables were used to reveal the clusters in the data set. To what extent will the neurons behave competitively with one another in the training phase is determined by the tension parameter of the map. The smaller this value is, the more the map tries to harmonize itself to the data set. This value varies between 0.3 and 2 and it was determined as 0.5 in this study. 1000 neurons were used in Kohonen layer and the emerging clusters are shown in Figure 3. U-matrix emerged after the formation of Ward agglomerative hierarchical clustering and SOM together is shown in Figure 4. Number of clusters will be determined with the help of this matrix. Light colors in this map represented that there were more students; therefore, there was a clustering. Dark colors in this map showed that there was not an observation in that part of the map. Therefore, dark colors on the map determined the cluster boundaries. The number of clusters can be determined by looking at U-matrix; however, there may be some personal judgments as people’s perceptions will come to the forefront. In the literature, different methods in determining the number of clusters are recommended using U-matrix [53, 54]. Depending on our training data (Table 7), Kohonen layer is divided into three clusters. Related to these clusters, observation percentage in clusters and the percentage of each variable present in the related cluster are given in Table 8.
7 SOM-Ward clusters
C1 C2
C3
Figure 3: SOM-Ward clusters after training.
Figure 4: U-matrix.
Generally, in clustering studies, it is seen that each cluster is named. Such a naming study is usually performed by the researcher. Clusters were named also in this study. Distinguishing characteristics of clusters can be expressed as follows. C1-Anthropocentric Cognitive Structure. 39% of students in the data set taken into account in this study are in this segment. It is seen that human, mammals, and plants stand out. C2-Primary Animistic Cognitive Structure. 32% of the data sets are in this segment. Domestic and/or familiar animals stand out, for example, fish, birds, and domestic mammals. C3-Secondary Animistic Cognitive Structure. 29% of students are clustered in this segment. Wild and/or unfamiliar animals, for example, wild mammals, reptiles, and invertebrates, prokaryotes, protists, and funguses stand out. It is highly apparent that the spatial order of the responses has captured the essential “family relationships”
8
Computational Intelligence and Neuroscience Table 4: An example of students’ responses (first question of conceptual understanding test).
Students S46 S47 S48 S49 S50
R1 Human Cat Lion Human Dolphin
R2 Monkey Dog Human Plant Dog
R3 Donkey Tree Plant Dog Human
R4 Bird Eagle Panda Algae Daisy
Living things written by the students R5 R6 R7 Cow Camel Frog Dolphin Pigeon Lion Snake Dolphin Zebra Bacterium Mushroom Bird Rose Ox Bear
R8 Turtle Whale Penguin Lion Whale
R9 Mouse Daisy Bear Leopard Monkey
R10 Cat Snowdrop Wolf Cat Chrysanthemum
Table 5: Coding of students’ responses. Students S46 S47 S48 S49 S50
R1 10 9 8 10 8
R2 8 9 10 2 9
R3 9 2 2 9 10
R4 7 7 8 1 2
Coded data of living things R5 R6 9 9 8 7 6 8 1 1 2 9
R7 5 8 8 7 8
R8 6 8 7 8 8
R9 9 2 8 8 8
R10 9 2 8 9 2
Table 6: A sample of average ranking of the living things.
Students S46 S47 S48 S49 S50
Monera, protists, and funguses 𝑥1 0.00 0.00 0.00 5.00 0.00
Plants Invertebrates Fishes Amphibians Reptiles Birds Wild mammals Domestic mammals Human 𝑥2 0.00 7.33 3.00 2.00 6.33
𝑥3 0.00 0.00 0.00 0.00 0.00
𝑥4 0.00 0.00 0.00 0.00 0.00
𝑥5 7.00 0.00 0.00 0.00 0.00
𝑥6 8.00 0.00 5.00 0.00 0.00
𝑥7 4.00 5.00 8.00 7.00 0.00
𝑥8 2.00 6.67 6.17 8.50 6.25
𝑥9 6.60 1.50 0.00 6.50 4.00
𝑥10 1.00 0.00 2.00 1.00 3.00
Table 7: Inputs for training the SOM-Ward Model.
Students S46 S47 S48 S49 S50
Monera, protists, and funguses 𝑥1 0.00 0.00 0.00 6.00 0.00
Plants Invertebrates Fishes Amphibians Reptiles Birds Wild mammals Domestic mammals Human 𝑥2 0.00 4.33 3.00 9.00 5.33
𝑥3 0.00 0.00 0.00 0.00 0.00
𝑥4 0.00 0.00 0.00 0.00 0.00
𝑥5 4.00 0.00 0.00 0.00 0.00
among the living things [37]. Clusters responding to, for example, “human,” occupy the right part of the lattice, clusters responding to “familiar animals” such as “birds,” “domestic mammals,” and “pets” gather towards the left, and clusters responding to more “wild” species such as “reptiles,” “wild mammals,” and “invertebrates” aggregate in the lower middle. Within each cluster, a further grouping according to
𝑥6 3.00 0.00 6.00 0.00 0.00
𝑥7 7.00 6.00 3.00 4.00 0.00
𝑥8 9.00 5.67 5.17 3.50 5.25
𝑥9 5.60 9.50 0.00 5.50 7.00
𝑥10 10.00 0.00 9.00 10.00 8.00
similarity is discernible [37]. The component planes of the map are shown in Figure 5. The resulting SOM-Ward model consists of three clusters. The component planes (Figure 5) shows the distributions of each variable (groups of the living things) across the map, on which the color scale visualizes the distribution of each variable over different clusters. Warm colors indicate more
Computational Intelligence and Neuroscience
9
Plants
Prokaryotes, protists, and funguses
Invertebrates
0 1 2 3 4 5 6 7 8 9 10 0 1 2 3 4 5 6 7 8 9 10 0 1 2 3 4 5 6 7 8 9 10
Amphibians
Reptiles
Birds
Fish
0 1 2 3 4 5 6 7 8 9 10
Wild mammals
0.0 1.0 2.0 3.0 4.0 5.0 6.0 7.0 8.0 9.0 0 1 2 3 4 5 6 7 8 9 10 0 1 2 3 4 5 6 7 8 9 10 0.0 1.1 2.1 3.2 4.2 5.3 6.3 7.4 8.4 9.5 Domestic mammals and pets
Human
0 1 2 3 4 5 6 7 8 9 10 0 1 2 3 4 5 6 7 8 9 10
Figure 5: The component planes of the map.
Table 8: Clusters and descriptive statistics. Groups of the living things Prokaryotes, protists, and funguses Plants Invertebrates Fishes Amphibians Reptiles Birds Wild mammals Domestic mammals and pets Human
C1 39% 0.41 3.59 1.81 0.54 0.49 1.62 1.73 4.12 5.76 7.15
Clusters C2 32% 0.20 2.81 2.43 4.78 0.84 2.32 6.50 3.36 6.33 3.30
C3 29% 4.81 2.75 3.06 0.48 0.62 3.08 3.50 5.62 4.06 2.34
significant for construction of aliveness concept, while cold ones indicate the reverse; for example, fishes were mainly found in cluster C2 and human in C1.
5. Conclusion Cluster analysis is a dimension reduction method. In this study, cluster analysis was applied to the data set obtained from the students with regard to the aliveness concept with the help of SOM. 10 variables of 100 students were expressed with the help of two-dimensional maps. As a result, 3 clusters which we called C1, C2, and C3 emerged with regard to the cognitive construction of aliveness concept. Properties of these clusters and the emergence of different colors according to the input variables are thought to be an
10
Computational Intelligence and Neuroscience
Table 9: Inputs data for training the SOM-Ward Model.
Students
S1 S2 S3 S4 S5 S6 S7 S8 S9 S10 S11 S12 S13 S14 S15 S16 S17 S18 S19 S20 S21 S22 S23 S24 S25 S26 S27 S28 S29 S30 S31 S32 S33 S34 S35 S36 S37 S38 S39 S40 S41 S42
Monera, protists, and funguses 𝑥1 0 0 0 0 0 6 0 9.5 0 0 0 0 0 0 0 0 0 0 0 3.5 0 0 0 1 0 7 0 7 5.5 0 6 0 6 0 0 0 0 0 0 1.5 6.25 7
Plants Invertebrates Fishes Amphibians Reptiles Birds Wild mammals Domestic mammals Human 𝑥2
𝑥3
𝑥4
𝑥5
𝑥6
𝑥7
𝑥8
𝑥9
𝑥10
0 3.5 0 0 0 5 0 0 0 0 0 2 0 0 0 5 4.33 0 6 0 0 4 0 10 8 1.5 0 0 3 4 7 0 4.5 5.5 5.5 0 6 1.5 7 0 9 5.5
0 0 0 2.5 0 3 3 0 0 0 0 3 0 0 8 8 6 5.33 5 5.5 0 0 1.5 9 0 10 0 0 0 0 3 7 1 0 0 0 8 0 0 0 0 3
0 0 0 9 0 0 0 0 0 0 0 10 1 9 9 9 5 0 0 0 0 0 0 0 5 3 0 0 0 3 0 0 0 0 7 0 0 0 0 0 0 0
0 0 0 0 0 0 0 0 0 0 0 0 0 4 0 0 0 0 0 0 0 0 0 0 0 0 0 3 0 0 0 0 0 0 0 0 0 0 0 0 0 0
3 0 6.33 0 0 0 0 0 5.33 4.5 0 4 0 3 0 2 0 4 0 0 0 2 0 0 0 8 3 4 10 0 0 0 9.5 0 0 0 3 5 0 5.5 0 9
8 0 9 3 0 0 0 2 8 0 1 9 0 10 6 7 0 0 0 8 3 0 4 2 2.5 4 0 8 9 0 0 9.5 0 7 8 0 4 0 10 0 0 5
4.67 3.5 7 5.6 0 1.5 5.25 3.75 1.5 8 2 1 4.5 4.33 3 0 0 8.5 3.75 4.5 5.6 4.75 7 7.5 6 6 4.67 2 8 7 7 8 3 0 3 0 2 6.33 4 9 7 0
9.5 9 4 0 0 8.5 6.2 5 7 2.5 0 6.67 7.2 7.5 7 0 0 4.5 7.5 0 7.67 6.67 6.33 5 2.5 0 6.25 1 0 8 0 0 4.5 5.29 6.5 5 6.67 7.67 2.5 4.67 0 0
5 7 0 10 5.5 4 0 8 0 0 6.5 6 0 0 10 10 7 0 7 10 1 10 8 3 10 0 10 0 0 1.5 10 4 8 0 10 5.56 0 0 0 9 8 0
Computational Intelligence and Neuroscience
11
Table 9: Continued.
Students
S43 S44 S45 S46 S47 S48 S49 S50 S51 S52 S53 S54 S55 S56 S57 S58 S59 S60 S61 S62 S63 S64 S65 S66 S67 S68 S69 S70 S71 S72 S73 S74 S75 S76 S77 S78 S79 S80 S81 S82 S83
Monera, protists, and funguses 𝑥1 0 0 0 0 0 0 6 0 0 0 0 0 0 0 0 0 0 0 0 0 0 10 1.5 0 0 0 0 0 0 0 0 0 0 0 0 1 0 1 4.5 0 0
Plants Invertebrates Fishes Amphibians Reptiles Birds Wild mammals Domestic mammals Human 𝑥2
𝑥3
𝑥4
𝑥5
𝑥6
𝑥7
𝑥8
𝑥9
𝑥10
10 0 0 0 3.67 8 9 4.67 6.5 2 0 0 5.33 9 9 0 0 0 0 5 0 7 5.75 2 4 5.5 4 7 0 0 0 7 4.25 0 0 0 1.5 2 1 7 8
1 9 5.5 0 0 0 0 0 0 0 4.6 2.5 4.33 0 0 0 6 5.5 1 10 2.5 2 4 0 4 0 0 0 0 0 2 1.5 0 0 2.5 0 3.5 0 2 2 0
0 0 0 0 0 0 0 0 0 0 0 2 0 0 0 7 2 4 0 2 6 0 0 0 0 1 4 9 10 8 0 0 0 5 9 10 5 0 0 0 0
0 0 0 4 0 0 0 0 0 5 7 0 0 0 0 4 7 0 0 0 0 8 0 0 2 0 0 0 0 0 0 0 0 0 1 9 0 3 0 0 0
2 3 2.5 3 0 6 0 0 0 0 0 7.5 0 0 1 6 1 1 5.5 4 0 0 0 0 6.5 4 3 4.5 6.5 2 8 0 3 2 0 6 0 0 6 8 0
7.5 10 7 7 6 3 4 0 4 0 1 3 6 2.33 4 10 8 8 0 3 8 0 0 4 6 0 7 3.5 1.5 6 3 6 6 6 0 5 7 0 6 1 0
6 4.5 8 9 4.33 4.83 2.5 4.75 7.33 5.67 0 8.33 0 3 4.33 2.5 4 2.5 6.33 0 3.33 5 0 7 0 5.5 0 0 5 6.5 7.4 4 0 5.4 7.5 5.67 0 4.5 9.5 4.5 5.5
6 5.5 6 4.4 9.5 0 4.5 7 4 8.5 5 5 5.5 6 6 7.33 9.5 9.5 4.67 7.67 8.67 9 9 8 10 7 9 7 9 2 2.5 8.5 8.33 7.5 6.25 3.5 7.67 7.5 0 6 4.67
3 2 2 10 0 9 10 8 0 10 9 0 9 9 10 1 0 7 10 4 0 0 7 7 0 10 5.5 2 0 9 0 10 4 0 0 0 10 10 0 10 5.67
12
Computational Intelligence and Neuroscience Table 9: Continued.
Students
S84 S85 S86 S87 S88 S89 S90 S91 S92 S93 S94 S95 S96 S97 S98 S99 S100
Monera, protists, and funguses 𝑥1 0 0 8.34 9 6 7 6 0 0 5.6 7 6 5.25 6 0 5.5 0
Plants Invertebrates Fishes Amphibians Reptiles Birds Wild mammals Domestic mammals Human 𝑥2
𝑥3
𝑥4
𝑥5
𝑥6
𝑥7
𝑥8
𝑥9
𝑥10
7 0 3 0 4 5.33 0 7 9 0 0 9 8 0 2 8 1.5
9 0 1 8 0 6 3.33 10 6.67 3 8 1 4 0 6.5 0 3
0 0 0 2 1 0 0 8 7 0 0 0 0 6 0 6 4
0 0 0 0 0 2 0 0 0 0 0 0 5 0 0 0 0
3.5 0 0 0 0 0 3 2 1 0 1 10 3 0 5 5 0
0 3 0 0 6 3 5 9 6.5 6 6 7 0 0 2 0 6.5
1.5 7.33 5 5 5 5 7 3.33 3 4.5 6.25 2.5 6 1.5 6 1.5 6.5
7.25 1.5 7.5 1 9 10 8.5 5 0 9 0 8 0 10 9 9.5 9
0 5 0 10 0 0 0 4 2 0 3 5 0 3 10 3 10
important step for us to “be able to understand” the aliveness concept. According to our literature survey, it was observed that the cognitive construction of aliveness concept was closely associated with anthropocentrism and animism [13– 19, 22, 24, 31, 32, 39, 55]. The results obtained from this study appeared to be consistent with the literature. As an additional property, the visualization of the results by using SOM enabled the clusters to form the cognitive structure and the characteristics of this cluster to be seen clearly. Another issue is the optimization of the structures of the SOMs. For instance, different structures can be obtained by changing the number of neurons in the output level. Similarly, different maps will emerge when learning parameter is changed. Another issue is the fact that the results of the analysis will actually show deviation when irrelevant variables are used. Different methods have been developed to optimize the structures of the SOMs. This classification process performed with the help of SOMs can be renewed by a different data set. For instance, there might be some variables that might increase the performance of the clustering analysis when they are removed from the analysis. The determination and removal of such variables with other methods may ensure analysis to have higher performance. For this, primarily, determining a reliable performance criterion is required. Recent analysis that became possible by increasing the processing capacity of the computers can be applied for modeling in the field of cognition and neuroscience. It can
be expected that the SOMs can also be used to solve different problems in this field due to the power of visualization they have.
Conflict of Interests The authors declare that there is no conflict of interests regarding the publication of this paper.
References [1] S. Franklin, “Life,” in Encyclopedia of Bioethics, S. G. Post, Ed., pp. 1381–1387, Thomson Gale, Macmillan Reference, New York, NY, USA, 2004. [2] E. M. E. Forde, D. Francis, M. J. Riddoch, R. I. Rumiati, and G. W. Humphreys, “On the links between visual knowledge and naming: a single case study of a patient with a category-specific impairment for living things,” Cognitive Neuropsychology, vol. 14, no. 3, pp. 403–458, 1997. [3] J. F. Marques, “The ‘living things’ impairment and the nature of semantic memory organisation: an experimental study using PI-release and semantic cues,” Cognitive Neuropsychology, vol. 17, no. 8, pp. 683–707, 2000. [4] P. Garrard, M. A. L. Ralph, J. R. Hodges, and K. Patterson, “Prototypicality, distinctiveness, and intercorrelation: analyses of the semantic attributes of living and nonliving concepts,” Cognitive Neuropsychology, vol. 18, no. 2, pp. 125–174, 2001. [5] R. Kolinsky, P. Fery, D. Messina et al., “The fur of the crocodile and the mooing sheep: a study of a patient with a categoryspecific impairment for biological things,” Cognitive Neuropsychology, vol. 19, no. 4, pp. 301–342, 2002.
Computational Intelligence and Neuroscience [6] G. W. Humphreys and M. J. Riddoch, “A case series analysis of ‘category-specific’ deficits of living things: the HIT account,” Cognitive Neuropsychology, vol. 20, no. 3–6, pp. 263–306, 2003. [7] S. J. Crutch and E. K. Warrington, “The selective impairment of fruit and vegetable knowledge: a multiple processing channels account of fine-grain category specificity,” Cognitive Neuropsychology, vol. 20, no. 3–6, pp. 355–372, 2003. [8] C. Blundo, M. Ricci, and L. Miller, “Category-specific knowledge deficit for animals in a patient with herpes simplex encephalitis,” Cognitive Neuropsychology, vol. 23, no. 8, pp. 1248–1268, 2006. [9] P. Ventura, J. Morais, C. Brito-Mendes, and R. Kolinsky, “The mental representation of living and nonliving things: differential weighting and interactivity of sensorial and non-sensorial features,” Memory, vol. 13, no. 2, pp. 124–147, 2005. [10] A. Martin, “The representation of object concepts in the brain,” Annual Review of Psychology, vol. 58, no. 1, pp. 25–45, 2007. [11] G. D. Zannino, I. Buccione, R. Perri et al., “Visual and semantic processing of living things and artifacts: an fMRI study,” Journal of Cognitive Neuroscience, vol. 22, no. 3, pp. 554–570, 2010. [12] C. Bardel, Alive, lifeless, dead. The origin of students’ conceptions [M.S. thesis], Joseph Fourier University, Grenoble, France, 1997. [13] S. W. Klingensmith, “Child animism: what the child means by ‘alive’,” Child Development, vol. 24, no. 1, pp. 51–61, 1953. [14] D. Elkind, “Development in early childhood,” Elementary School Guidance & Counseling, vol. 26, no. 1, pp. 12–21, 1991. [15] M. D. Berzonsky, “Reflectivity, internality, and animistic thinking,” Child Development, vol. 45, no. 3, pp. 785–789, 1974. [16] A. M. Lucas, R. D. Linke, and P. P. Sedgwick, “Schoolchildren’s criteria for ‘alive’: a content analysis approach,” The Journal of Psychology: Interdisciplinary and Applied, vol. 103, no. 1, pp. 103– 112, 1979. [17] K. G. Dolgin and D. A. Behrend, “Children’s knowledge about animates and inanimates,” Child Development, vol. 55, no. 4, pp. 1646–1650, 1984. [18] J. H. Ward Jr., “Hierarchical grouping to optimize an objective function,” Journal of the American Statistical Association, vol. 58, pp. 236–244, 1963. [19] D. Zaitchik and G. E. A. Solomon, “Animist thinking in the elderly and in patients with Alzheimer’s disease,” Cognitive Neuropsychology, vol. 25, no. 1, pp. 27–37, 2008. [20] I. M. Kinchin, “Investigating secondary-school girls’ preferences for animals or plants: a simple ‘head-to-head’ comparison using two unfamiliar organisms,” Journal of Biological Education, vol. 33, no. 2, pp. 95–99, 1999. [21] J. H. Wandersee, “Plants or animals—which do junior high school students prefer to study?” Journal of Research in Science Teaching, vol. 23, no. 5, pp. 415–426, 1986. [22] R. Babai, R. Sekal, and R. Stavy, “Persistence of the intuitive conception of living things in adolescence,” Journal of Science Education and Technology, vol. 19, no. 1, pp. 20–26, 2010. [23] S. Dellantonio, M. Innamorati, and L. Pastore, “Sensing aliveness: an hypothesis on the constitution of the categories ‘animate’ and ‘inanimate’,” Integrative Psychological and Behavioral Science, vol. 46, no. 2, pp. 172–195, 2012. [24] N. Yorek, M. S¸ahin, and H. Aydin, “Are animals ‘more alive’ than plants? Animistic-anthropocentric construction of life concept,” Eurasia Journal of Mathematics, Science and Technology Education, vol. 5, no. 4, pp. 369–378, 2009. [25] S. Caravita and E. Falchetti, “Are bones alive?” Journal of Biological Education, vol. 39, no. 4, pp. 163–170, 2005.
13 [26] M. J. Farah and C. Rabinowitz, “Genetic and environmental influences on the organisation of semantic memory in the brain: is “living things” an innate category?” Cognitive Neuropsychology, vol. 20, no. 3–6, pp. 401–408, 2003. [27] M. Braund, “Children’s ideas in classifying animals,” Journal of Biological Education, vol. 25, no. 2, pp. 103–110, 1991. [28] M. Braund, “Trends in children’s concepts of vertebrate and invertebrate,” Journal of Biological Education, vol. 32, no. 2, pp. 112–118, 1998. [29] U. Kattmann, “Aquatics, flyers, creepers and terrestrialsstudents’ conceptions of animal classification,” Journal of Biological Education, vol. 35, no. 3, pp. 141–147, 2001. [30] L. Turkmen, O. Cardak, and M. Dikmen, “Lise ogrencilerinin canlıların cesitliligi ve sınıflandırılması konusundaki kavram yanılgıları,” Selcuk Universitesi Egitim Fakultesi Dergisi, vol. 14, pp. 455–465, 2002 (Turkish). [31] J. H. Wandersee and E. E. Schussler, “Preventing plant blindness,” The American Biology Teacher, vol. 61, no. 2, pp. 82–86, 1999. [32] J. H. Wandersee and E. E. Schussler, “Toward a theory of plant blindness,” Plant Science Bulletin, vol. 47, pp. 2–9, 2001. [33] P. G¨ardenfors, Conceptual Space: The Geometry of Thought, MIT Press, Cambridge, Mass, USA, 2000. [34] T. Honkela, K. Hynn¨a, K. Lagus, and J. S¨arel¨a, “Adaptive and statistical approaches in conceptual modeling,” Tech. Rep. A75, Helsinki University of Technology, Laboratory of Computer and Information Science, Neural Networks Research Center, 2005. [35] T. Honkela, V. K¨on¨onen, T. Lindh-Knuutila, and M.-S. Paukkeri, “Simulating processes of concept formation and communication,” Journal of Economic Methodology, vol. 15, no. 3, pp. 245–259, 2008. [36] T. Lindh-Knuutila, J. Raitio, and T. Honkela, “Connectionist models of behaviour and cognition II,” in Proceedings of the 11th Neural Computation and Psychology Workshop, J. Mayor, N. Ruh, and K. Plunkett, Eds., vol. 18 of Progress in Neural Processing, pp. 193–204, World Scientific, Oxford, UK, April 2009. [37] H. Ritter and T. Kohonen, “Self-organizing semantic maps,” Biological Cybernetics, vol. 61, no. 4, pp. 241–254, 1989. [38] T. Lindh-Knuutila and T. Honkela, “Exploratory text analysis: data-driven versus human semantic similarity judgments,” in Adaptive and Natural Computing Algorithms: 11th International Conference, ICANNGA 2013, Lausanne, Switzerland, April 4–6, 2013. Proceedings, M. Tomassini, A. Antonioni, F. Daolio, and P. Buesser, Eds., vol. 7824 of Lecture Notes in Computer Science, pp. 428–437, Springer, Berlin, Germany, 2013. [39] N. Yorek and S. Narli, “Modeling of cognitive structure of uncertain scientific concepts using fuzzy-rough sets and intuitionistic fuzzy sets: example of the life concept,” International Journal of Uncertainty, Fuzziness and Knowlege-Based Systems, vol. 17, no. 5, pp. 747–769, 2009. [40] K. Mehrotra, C. K. Mohan, and S. Ranka, Elements of Artificial Neural Networks, The MIT Press, London, UK, 1997. [41] S. Hasan and S. M. Shamsuddin, “Multistrategy self-organizing map learning for classification problems,” Computational Intelligence and Neuroscience, vol. 2011, Article ID 121787, 11 pages, 2011. [42] W. S. McCulloch and W. Pitts, “A logical calculus of the ideas immanent in nervous activity,” Bulletin of Mathematical Biophysics, vol. 5, no. 4, pp. 115–133, 1943.
14 [43] T. Kohonen, Self-Organization Maps, Springer, Berlin, Germany, 1995. [44] J. Yang, R. L. Cheu, X. Guo, and A. Romo, “Analysis of vehiclefollowing heterogeneity using self-organizing feature maps,” Computational Intelligence and Neuroscience, vol. 2014, Article ID 561036, 11 pages, 2014. [45] G. Gan, C. Ma, and J. Wu, Data Clustering Theory, Algorithms, and Applications, American Statistical Association, Philadelphia, Pa, USA, 2007. [46] J. Vesanto and E. Alhoniemi, “Clustering of the self-organizing map,” IEEE Transactions on Neural Networks, vol. 11, no. 3, pp. 586–600, 2000. [47] H. C. Romesburg, Cluster Analysis for Researchers, Lulu Press, Raleigh, NC, USA, 2004. [48] P. G¨ardenfors, “Conceptual spaces as a framework for knowledge representation,” Mind and Matter, vol. 2, no. 2, pp. 9–27, 2004. [49] W. Labuschagne, “Reviews: Peter G¨ardenfors, Conceptual Spaces: The Geometry of Thought (Cambridge Mass.: MIT, 2000),” Junctures, no. 5, p. 67, 2005. [50] P. C. M. Molenaar, “Conceptual spaces: the geometry of thought; Peter G¨ardenfors; MIT Press, Cambridge, MA, 2000,” Acta Psychologica, vol. 106, no. 3, pp. 333–336, 2001. [51] T. Honkela, J. Raitio, K. Lagus, I. T. Nieminen, N. Honkela, and M. Pantzar, “Subjects on objects in contexts: using GICA method to quantify epistemological subjectivity,” in Proceedings of the International Joint Conference on Neural Networks (IJCNN ’12), pp. 2875–2883, Brisbane, Australia, June 2012. [52] W. L. Martinez and A. R. Martinez, Exploratory Data Analysis with MATLAB, Computer Science and Data Analysis Series, Chapman & Hall/CRC Press, Boca Raton, Fla, USA, 2005. [53] A. Sharma and W. Omlin, “Determining cluster boundaries using particle swarm optimization,” World Academy of Science, Engineering and Technology, vol. 22, pp. 175–179, 2006. [54] J. Malone, K. McGarry, S. Wermter, and C. Bowerman, “Data mining using rule extraction from Kohonen self-organising maps,” Neural Computing & Applications, vol. 15, no. 1, pp. 9– 17, 2006. [55] M. D. Berzonsky, “Child animism: situational influences and individual differences,” The Journal of Genetic Psychology, vol. 149, no. 3, pp. 293–303, 1988.
Computational Intelligence and Neuroscience
Journal of
Advances in
Industrial Engineering
Multimedia
Hindawi Publishing Corporation http://www.hindawi.com
The Scientific World Journal Volume 2014
Hindawi Publishing Corporation http://www.hindawi.com
Volume 2014
Applied Computational Intelligence and Soft Computing
International Journal of
Distributed Sensor Networks Hindawi Publishing Corporation http://www.hindawi.com
Volume 2014
Hindawi Publishing Corporation http://www.hindawi.com
Volume 2014
Hindawi Publishing Corporation http://www.hindawi.com
Volume 2014
Advances in
Fuzzy Systems Modelling & Simulation in Engineering Hindawi Publishing Corporation http://www.hindawi.com
Hindawi Publishing Corporation http://www.hindawi.com
Volume 2014
Volume 2014
Submit your manuscripts at http://www.hindawi.com
Journal of
Computer Networks and Communications
Advances in
Artificial Intelligence Hindawi Publishing Corporation http://www.hindawi.com
Hindawi Publishing Corporation http://www.hindawi.com
Volume 2014
International Journal of
Biomedical Imaging
Volume 2014
Advances in
Artificial Neural Systems
International Journal of
Computer Engineering
Computer Games Technology
Hindawi Publishing Corporation http://www.hindawi.com
Hindawi Publishing Corporation http://www.hindawi.com
Advances in
Volume 2014
Advances in
Software Engineering Volume 2014
Hindawi Publishing Corporation http://www.hindawi.com
Volume 2014
Hindawi Publishing Corporation http://www.hindawi.com
Volume 2014
Hindawi Publishing Corporation http://www.hindawi.com
Volume 2014
International Journal of
Reconfigurable Computing
Robotics Hindawi Publishing Corporation http://www.hindawi.com
Computational Intelligence and Neuroscience
Advances in
Human-Computer Interaction
Journal of
Volume 2014
Hindawi Publishing Corporation http://www.hindawi.com
Volume 2014
Hindawi Publishing Corporation http://www.hindawi.com
Journal of
Electrical and Computer Engineering Volume 2014
Hindawi Publishing Corporation http://www.hindawi.com
Volume 2014
Hindawi Publishing Corporation http://www.hindawi.com
Volume 2014