Getty Images
Liam Higginson
Roberto J. Galindo
Getty Images
Using single-particle fluorescence spectroscopy, scientists are conducting widespread, real-time monitoring of bioaerosols that will deepen their understanding of the effects of airborne particles on human health and climate change. Their research will also enable the development of early warning systems against biowarfare agents.
OPN September 2008 | 29 1047-6938/08/09/0029/6-$15.00 ©OSA
About aerosols and detection techniques In general, an aerosol is any suspension of solid or liquid particles in air, where the particles vary in size from a few nanometers to tens of micrometers. Aerosol particles that are composed of biological materials (e.g., bacteria, molds, pollens, viruses, proteins) are referred to as bioaerosols. Polycyclic aromatic hydrocarbons (PAHs), another type of aerosol, are common byproducts of combustion. Aerosols that contain organic carbon— including bioaerosols and many other types— can act as cloud condensation nuclei and increase cloud cover and precipitation. Aerosols that absorb light, such as particles that contain black carbon or brown carbon, cause heating in the atmosphere. On the other hand, non-absorbing aerosol
30 | OPN September 2008
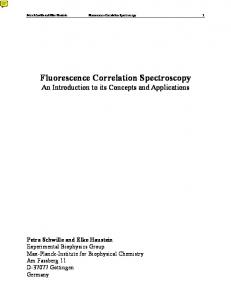
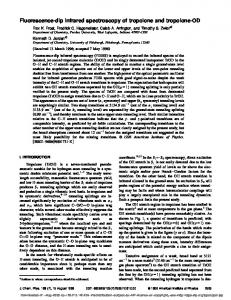
[ LIF spectra of biological compounds ]
Fluorescence intensity [a.u.]
1.0 Single-shot fluorescence spectra 5 mm in diameter, 266 nm excitation 0.8 Tyrosine Tryptophan
0.6
NADH 0.4
0.2
Riboflavin Phenylalanine
0.0 300
400
500
Wavelength [nm]
600
Single-particle laser-induced fluorescence spectra of some compounds commonly found in biological cells excited by a single 266-nm-wavelength laser pulse. The spectra were recorded with an intensified CCD array. Even for pure molecules such as tryptophan, the vibrational states and electronic manifolds in a solid particle are sufficiently dense to result in a broad, diffuse emission band.
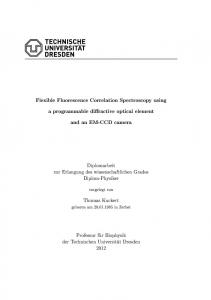
[ LIF spectra of aerosolized biological materials ] Normalized fluorescence inten. [a.u.]
S
ometimes the biggest threats come in the smallest packages. Aerosols, for example— which are minute suspensions of solid or liquid particles in the air—have significant and farreaching effects on human health, the Earth’s climate and the chemistry of our atmosphere. Whether human-made or natural, aerosols have been correlated with lung cancer, asthma and cardiopulmonary illnesses, and they are major routes of transmission for infectious disease. Pollution aerosols have also played a well-known role in climate change by depleting the Earth’s protective ozone layer. (Research is also being done to quantify the role of aerosols in reflecting and absorbing incoming sunlight because of the potential for aerosol scattering to partially offset climate warming induced by greenhouse gases.) And perhaps the most recent threat posed by aerosols comes from their potential use as agents of biowarfare. Although researchers have been working to develop methods for the rapid detection of bioaerosols for more than 60 years, they have ramped up their efforts in the past two decades due to concerns over the possible release of anthrax during the Persian Gulf War and in the wake of the September 11, 2001, terrorist attacks on the United States. There is a major need to develop rapid and reliable methods for detecting small but potentially lethal concentrations of such agents amidst mostly innocuous background particles. For all these reasons, scientists need to better understand and characterize atmospheric aerosols. Our research team has been designing and using single-particle fluorescence spectrometer (SPFS) systems to measure the dispersed laserinduced fluorescence spectrum (280-600 nm) using 32-anode photomultiplier tube technology. Our primary aim is to develop techniques for rapidly detecting the presence of biowarfare agents. However, these techniques should also be useful for detecting and characterizing other types of aerosols, including combustion-generated particles and biological aerosols such as allergens or pollen.
60 Bacillus subtilis (unwashed) Bacillus subtilis MS2 phage Ova albumin Fungal spores Bacillus thuringiengis
50 40 30 20 10 0 300
400
500
600
Wavelength [nm] Laser-induced fluorescence spectra of some aerosolized biological materials recorded by a 32-anode photomultiplier tube detector. The excitation wavelength is 263 nm. Each line represents an average of 100 single particles. The amplitudes have been adjusted to be about the same at the tryptophan peak.
particles reflect light and contribute to atmospheric cooling. The scattering, absorption and cloud condensation nuclei properties of aerosols depend on their size-, shape- and composition-distributions.
www.osa-opn.org
Most fluorescence-based sensors can differentiate between biological and nonbiological aerosols, but have difficulty identifying specific bioaerosol threats. Researchers have developed several single-particle techniques for characterizing ambient aerosols. Aerosol time-offlight mass spectrometry, for example, provides elemental composition, as well as the masses of laser-ablated molecular fragments, from which researchers can determine chemical species or types, at least for some dominant species. This widely used technique is sensitive and informative, albeit relatively expensive. Laser-induced breakdown spectroscopy (LIBS) yields atomic emission and plasma emission spectra that might be used to classify particles. It mainly provides information about the abundance of inorganic ions, which can sometimes be related to known particle types. Laser-induced fluorescence (LIF)—the method we use in our research—provides information regarding the dominant fluorophores in particles, typically aromatic organic carbon compounds. In some cases, these fluorophores may be tracers that can indicate a certain type of particle (e.g., tryptophan is a tracer for bacteria and proteins). For most of the LIF systems developed, fluorescence is measured in one or two bands. Instruments that measure spectrally dispersed singleparticle LIF can provide more information, but they are also more expensive.
Fluorescence of bioaerosols Some of the major fluorophores that occur within most living cells include the aromatic amino acids tryptophan, tyrosine and phenylalanine; reduced nicotinamide adenine dinucleotide compounds (NADH and NADPH); and flavin compounds. Almost all proteins contain at least one of the aromatic amino acids. In plant cells, chlorophylls and ferulic acid are also major fluorophores. In addition, the lignins and lignans of wood contain fluorophores such as sinapyl and coniferyl alcohol. The top figure on the facing page shows the fluorescence spectra from individual (nominal 5-mm-diameter) particles made of some of the primary fluorophores in cells. In these dry particles, tyrosine and tryptophan have emission peaks at about 310 nm and 340 nm, respectively; NADH and riboflavin peak at around 450 nm and 560 nm. In a protein, the varying tyrosine and tryptophan molecules can exhibit different fluorescence spectral shifts depending on their local environments and their proximity to other amino acids. The bottom figure on the facing page shows the LIF spectra from a few biological stimulants and interferent materials that
were aerosolized. For example, Bacillus subtilis is a stimulant for Bacillus anthracis. Bacillus thuringiensis is an insecticide for interferent materials. MS2, a bacteriophage, is a virus that attacks E. coli. Ovalbumin is a stimulant for protein toxins and could be a stimulant for some protein allergens, such as cat allergens. Also shown are fungal spores. These materials have similar fluorescence spectra: All have a strong tryptophan fluorescence peak emission around 330 nm and a shoulder emission from 400 nm to 650 nm. The differences among these spectra are mainly in the shoulder region, and, for biomaterials grown in a laboratory, they depend on the growth media used, and the extent to which the samples are washed. As the figure illustrates with B. subtilis, the difference between the fluorescence spectra of washed and unwashed bacteria can be large, much larger than the difference between B. subtilis and some other bacteria or bioaerosols. The similarity of the spectra of many well-washed bacteria occurs because tryptophan dominates the fluorescence from such bacteria, and many other bio-molecules are ubiquitous among living organisms. Environmental conditions such as temperature and humidity can also affect fluorescence spectral profiles. All of these factors make it challenging to distinguish among various bioaerosols solely on the basis of fluorescence. Laboratory and field tests show that most fluorescence-based sensors can differentiate between biological and nonbiological aerosols, but have difficulty identifying specific bioaerosol threats and distinguishing between them and other bioaerosols. Consequently, the fluorescence spectrum can only be used as a classifier, and not a species-level identifier.
Single particle fluorescence spectrometry The SPFS is a rapid point-detection system that can be used for bioaerosol discrimination, sorting and collection based on UV-excited LIF spectra. The figure at the top of p. 32 shows a schematic of the latest SPFS. We use a virtual impactor concentrator with an inlet sample rate of about 330 L/min to concentrate particles in the 2- to 10-mm size range. Particleenriched air in the minority outlet flow of the concentrator (nominally 1 L/min) is fed into the inner nozzle of a doublenozzle assembly to form a focused, laminar, cylindrical aerosol jet (around 300 mm in diameter) within the chamber. Then air is bled through a filter into the outer-nozzle inlet so that it forms a clear-air sheath and helps keep the particles in the aerosol jet on relatively uniform trajectories. Particles
OPN September 2008 | 31
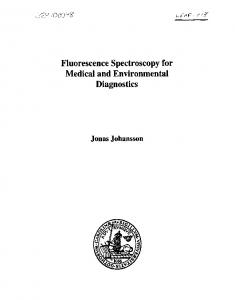
[ The single particle fluorescence spectrometer (SPFS) ] Sheath air UV laser
Concentrated aerosol Spectrograph Diode 1 Objective lens 32-anode PMT Diode 2
PMT 2
PMT 1 The particles are drawn into the cell by a partial (a few millibars) vacuum. When a particle scatters light from both of the focused different-wavelength diodes, so that the light detected by the each of the two PMTs exceeds a threshold, then the UV laser fires, and the 32-anode PMT is gated on so it can record the particle’s LIF spectrum.
[ Normalized fluorescence spectra of atmospheric aerosol ] 0.8
Cluster 1 (0.4 %)
Normalized fluorescence
0.6
0.8
0.4
0.4
0.2
0.2
0.0
0.0
0.8
Cluster 3 (6.4 %)
0.6
0.8 0.4
0.2
0.2
0.0
0.0 0.8
Cluster 5 (12.5 %)
0.6
0.4
0.2
0.2
0.0 0.8
0.0 0.8
Cluster 8 (28.3 %)
0.6
0.4
0.4
0.2
0.2
0.0
300 400
500 600
Cluster 7 (2.3 %)
0.6
0.4
0.6
Cluster 4 (4.4 %)
0.6
0.4
0.8
Cluster 2 (34.1 %)
0.6
0.0
Cluster 10 (1.9 %)
Ambient aerosol fluorescence measurements 300 400
500 600
Wavelength [nm] Normalized fluorescence spectra of single atmospheric aerosol particles (thin solid lines) measured at 10 AM on Oct. 23, 2006, to 10 AM Oct. 25, 2006, at New Haven, Conn., and the template spectrum for each cluster (dashed line). The sharp peaks at 263-nm are due to the (attenuated) elastically scattered light from each particle and provide a measure of particle size. The peaks at 527 nm are due to the second order diffraction of the 263 nm laser line by the grating.
32 | OPN September 2008
flowing within about 150 mm of the center of the jet are detected by two diode laser beams (650 and 685 nm), which are focused (beam diameter about 150 mm) to intersect near the center of the jet. Two photo-multiplier tubes (PMTs) detect the light scattered from particles passing through the intersection of these beams. An interference filter in front of one PMT passes 650-nm scattered light, and another passes 685-nm light. When signals from both PMTs simultaneously exceed a preset threshold, a pulsed UV probe laser is triggered. The probe laser used is a Nd:YLF (or Nd:YAG) with a 263-nm (or 266-nm) wavelength, 50 mJ pulse energy, 10-ns pulse length and 1-mm beam diameter. The particle fluorescence excited by the UV laser pulse is collected by a large-aperture (NA=0.4) reflective objective and focused onto the input slit of a spectrograph for dispersion. The fluorescence spectrum is detected by a 32-anode PMT (Hamamatsu H7260). A long-pass liquid filter (dimethyl formamide, or DMF) is placed in front of the spectrograph slit to block nearly all the elastic scattering from the 263-nm laser but efficiently transmit the fluorescence with wavelengths longer than 280 nm. A small amount of elastic scattering is allowed to leak through the filter (by adjusting the concentration of DMF in water) and is used to estimate particle size. The fluorescence spectrum and elastic scattering intensity for each particle is measured by a 32-anode PMT and then captured and analyzed by a custom-designed readout and processing electronics interface (PhotoniQ, now Vertilon). The PMT and PhotoniQ make real-time detection and characterization of aerosol particles possible; the interface can read each fluorescence spectrum and analyze it within 11 ms. If the particle spectrum matches a set of preset criteria, the interface can also generate an electronic pulse to trigger a fast valve to release a puff of air that aerodynamically deflects the selected particle for subsequent identification. Researchers at Sandia National Laboratory have been working with our team to deploy the SPFS in a major international airport as a way to help detect whether current commercial bioaerosol sensors are producing false alarms.
We have used the SPFS system to measure the natural atmospheric background aerosol. We conducted campaigns over a three-month period at Adelphi, Md. (between February and April 2004); New Haven, Conn. (October to December 2006 and January to May 2008); and Las Cruces, N.M. (January to May 2007). For the later campaigns, there were typically a few tens to a few hundred particles detected per second within the 1-10 mm size range. Around a million spectra were measured each day. In order to analyze such a large quantity of spectra, we first applied an unstructured hierarchical cluster analysis scheme to
www.osa-opn.org
Interestingly, most of the spectral clusters we found during different seasons and at diverse sites were similar to one another, although the proportions of particles in the clusters varied. the data. Each spectrum was treated as a vector and normalized. The dot product of each spectrum was taken with each other spectrum. The two spectra were placed into one cluster. A new spectrum was calculated as the average of all the spectra of the particles in that cluster We repeated the process until no two cluster spectra have a dot product that exceeds some value (typically, 0.9). We have repeated this unstructured cluster analysis, independently at each location, on data taken in Maryland, Connecticut and New Mexico, and we’ve chosen template spectra for each location that include most of the spectra taken at that location. We found similarities in the template spectra at the three locations. We chose a set of 10-11 template spectra with which to analyze all the data taken at different times or under various atmospheric conditions. In the analysis, the dot product of each normalized spectrum was taken with each of the template spectra. When the dot product of a spectrum with a template spectrum was greater than 0.9, we assigned the spectrum to that template (cluster). If a spectrum had a dot product greater than 0.9 with two clusters, it was assigned to the cluster with which it had the higher dot product. We have found that 10-11 template clusters typically account for more than 91 percent of all fluorescent particles. The bottom figure on the facing page is an example of some spectra grouped into clusters from data recorded October 24, 2006, in New Haven. The percentages of spectra for the complete data set that was grouped into these clusters are also shown. The most populated clusters are 2, 5, and 8; the least are 1, 6, and 7. Based on fluorescence spectra from the literature and our measurements of test aerosols, it appears that the following particle types or compounds in atmospheric aerosol have similar spectra to the cluster templates: singlering aromatics without significant additional conjugation (cluster 1), single-ring aromatics with additional conjugation, double-ring aromatics (cluster 2), bacteria plus humic-like substances (HULIS) (cluster 3), bacteria, proteins, doublering aromatics (cluster 4), marine aerosol, bacteria with other materials (cluster 5), cellulose with the compounds that make it fluorescent such as ferulic acid, also, NADH in live cells (cluster 7), PAHs, humic acids, HULIS (cluster 8) and HULIS (cluster 10). Interestingly, most of the spectral clusters we found during different seasons and at diverse sites were similar to one another, although the proportions of particles in the clusters varied.
Conclusion Organic carbon and biological aerosol are ubiquitous in the earth’s atmospheric boundary layer and have important implications for atmospheric chemistry, climate change and human health. Further development of the UV-LIF technology may provide a foundation for future studies and provide a basis for widespread, real-time monitoring of bioaerosols. t Yong-Le Pan (
[email protected]) and Richard K. Chang are with the department of applied physics, Yale University, New Haven, Conn., U.S.A. Steven C. Hill and Ron G. Pinnick are with the U.S. Army Member Research Laboratory in Adelphi, Md., U.S.A.
[ References and Resources ] >> B. Lighthart, A. J. Mohr, eds. Atmospheric Microbial Aerosols,
Chapman & Hall, N.Y. (1994). >> S. Hill et al. “Real-time measurement of fluorescence spectra from
single airborne biological particles,” Field Analytical Chemistry and Technology 3, 221-39 (1999). >> F.L. Reyes et al. “Bio-aerosol fluorescence sensor,” Field Anal.
Chem. Tech. 3, 240-8 (1999). >> P.H. Kaye et al. “Simultaneous light scattering and intrinsic
fluorescence measurement for the classification of airborne particles,” Appl. Opt. 39, 3738–45 (2000). >> C.A. Pope et al. “Lung cancer, cardiopulmonary mortality, and
long-term exposure to fine particulate air pollution,” JAMA 287, 1132-41 (2002). >> P.E. Taylor et al. “Release of allergens as respirable aerosols: A link
between grass pollen and asthma,” J. Allergy Clin. Immunol. 109, 51-6 (2002). >> Y.L. Pan et al. “Single-particle fluorescence spectrometer for ambi-
ent aerosols,” Aerosol Science and Technology 37, 628-39 (2003). >> A.C. Samuels et al. “Laser-induced breakdown spectroscopy
of bacterial spores, molds, pollens, and protein: initial studies of discrimination potential,” Appl. Opt. 42, 6205-9 (2003). >> Y.L. Pan et al. “A puff of air sorts bioaerosols for pathogen identifi-
cation,” Aerosol Sci. Tech. 38, 598-602 (2004). >> R.G. Pinnick et al. “Fluorescence spectra of atmospheric aerosol at
Adelphi, Maryland, USA: measurement and classification of single particles containing organic carbon,” Atmos. Environ. 38, 1657-72 (2004). >> V. Sivaprakasam et al. “Multiple UV wavelength excitation and
fluorescence of bioaerosols,” Opt. Express 12, 4457-66 (2004). >> R.C. Sullivan et al. “Recent advances in our understanding of atmo-
spheric chemistry and climate made possible by on-line aerosol analysis instrumentation,” Anal. Chem. 77, 3861-86 (2005). >> Y.L. Pan et al. “Single-particle laser-induced-fluorescence spectra
of biological and other organic-carbon aerosols in the atmosphere: Measurements at New Haven, Connecticut, and Las Cruces, New Mexico,” J. Geophys. Res.-Atm., 112, D24S19 (2007).
OPN September 2008 | 33