and the University of Texas at El Paso (UTEP), we installed ... Most models call for brittle .... Seismic Centre (ISC) global catalogs show a relatively low seis-.
Using Small, Temporary Seismic Networks for Investigating Tectonic Deformation: Brittle Deformation and Evidence for Strike-Slip Faulting in Bhutan A. A. Velasco, V. L. Gee, C. Rowe, D. Grujic, L. S. Hollister, D. Hernandez, K. C. Miller, T. Tobgay, M. Fort, and S. Harder
A. A. Velasco,1 V. L. Gee,1 C. Rowe,1 D. Grujic,3 L. S. Hollister,4 D. Hernandez,1 K. C. Miller,1 T. Tobgay,1,5 M. Fort,6 and S. Harder1 SUMMARY We processed data from a small, five-station temporary seismic network deployed from January 2002 until March 2003 within the Kingdom of Bhutan. We detected, associated, and located approximately 2,100 teleseismic, regional, and local events; approximately 900 were not in the United States Geological Survey (USGS) Earthquake Data Report catalog. We supplemented our data for these 900 events with data from the Global Seismographic Network (GSN) stations in the region. After relocation of these events, we focused on approximately 175 events that occurred near or within the borders of Bhutan. We reviewed each solution, manually timing the P- and S-waves for each event, and inverted for event locations and an average 1-D velocity model for the region. Our model was tested with other models appropriate for the region. We found a high amount of microseismicity throughout southern Bhutan and almost no seismicity under northern Bhutan and southern Tibet. Our results showed that analysis of data from small in-country seismic networks resulted in new scientific findings. In this case, we found the crust under southern Bhutan brittlely deforming, and there was evidence for strike-slip faulting, supporting previous results for the region.
INTRODUCTION In coordination and collaboration with researchers at the Geological Survey of Bhutan (GSB), Princeton University, and the University of Texas at El Paso (UTEP), we installed a temporary five-station seismic network in the Kingdom of Bhutan (figure 1) in January 2002. The network was removed in March 2003 in order to return borrowed equipment from 1. 2. 3. 4. 5. 6.
Department of Geological Sciences, University of Texas at El Paso. Los Alamos National Laboratory. Department of Earth Sciences, Dalhousie University. Department of Geosciences, Princeton University. Geological Survey of Bhutan. IRIS PASSCAL Instrument Center.
the Incorporated Research Institutions for Seismology (IRIS) Program for the Array Seismic Studies of the Continental Lithosphere (PASSCAL). The goal of the deployment was to assist the Bhutanese government in assessing earthquake hazards in the country and to provide a foundation for developing a permanent seismic network. The deployment is phase one of a three-phase plan approved by the Bhutan Council of Ministers to assist with technical issues associated with installation of a permanent network in the Kingdom of Bhutan. The temporary deployment consisted of five stand-alone seismic stations using recording equipment distributed throughout the western section of the country (figure 1). The aperture of the network is small but adequate to determine preliminary earthquake locations within the country. Well-determined earthquake locations are dependent on data quality and network geometry (e.g., Engdahl et al. 1998; Schultz et al. 1998). The stations were powered with marine batteries charged by solar panels, with data recorded to a large hard disk internal to the system. The sensors were broadband Guralp or Streckeisen seismometers. Bhutanese scientists at Geological Survey of Bhutan (GSB) monitored the stations, which included visiting each station at least once every three months. These data are now archived and publicly available at the IRIS Data Management Center (DMC). Small, temporary networks in a poorly instrumented region can reveal unique insights into tectonic processes. Recent investigations of the Himalaya of Nepal and the Tibetan Plateau resulted in several models of formation for the orogen (Tapponnier et al. 2001; Harrison et al. 1992; Beaumont et al. 2001; Zhao and Morgan 1987). Most models call for brittle deformation or ductile channel flow; the geodynamic model involving channel flow has yet to be tested with geophysical data. These models are generally 2-D and do not encompass other mechanisms for formation. Here we present results from analysis of our temporary network suggesting that this region is undergoing significant deformation, which appears to be strikeslip in nature with the crust under southern Bhutan deforming brittlely.
446 Seismological Research Letters Volume 78, Number 4 July/August 2007
35°
China
Ne p
30°
LSA
al
Bhutan
KMI
India
25°
20° HYB
75°
CHTO
80°
85°
90°
95°
100°
15° 105°
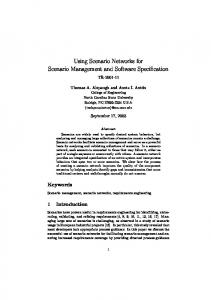
▲▲ Figure 1. Map showing the temporary seismic network within the Kingdom of Bhutan and GSN stations LSA, KMI, CHTO, HYB (filled triangles), USGS Earthquake Data Reports (EDR) epicenters (filled diamonds), and the approximate 900 events not reported in the EDR (filled circles) that were processed using the Antelope software package and data from the GSN stations.
SCIENCE OBJECTIVE Bhutan lies within the Himalaya east of Nepal (figure 1) and near the south end of the International Deep Profiling of Tibet and the Himalaya (INDEPTH) seismic transect in Tibet (Hauck et al. 1998). Based on derived observations on the southward extrapolation of the INDEPTH profile, Hauck et al. (1998) propose that the differences in geology between Bhutan and the central Himalaya result from sliding of the mid- to upper crust of the Himalaya and Southern Tibet over a mid-crustal detachment. Others suggested that a mid-crustal ramp along the detachment may explain the anomalously large surface width of the Greater Himalayan Sequence (GHS) in Bhutan (Edwards and Harrison 1997) and the differences in landscape between central Nepal and central Bhutan (Duncan et al. 2003). This detachment was apparently imaged in the seismic profiles and is referred to as the Main Himalayan Thrust (MHT) (Nelson et al. 1996). Toward the surface, the MHT splays, from north to south, into the Main Central Thrust (MCT), the Main Boundary Thrust (MBT), and the Main Frontal Thrust (MFT). This results from southward in-sequence propagation of the deformation since the Miocene. Moreover, Wobus et al. (2005) have suggested that the MCT is still active in the Nepal Himalaya and that a ramp in the MCT causes the evolution of some of the structures observed on the surface. From geologic studies in Bhutan, Grujic et al. (2002) proposed that during the Miocene there was a southward extruding channel of high-temperature ductile rock—the Greater Himalayan Sequence, or GHS—from mid-crustal depths under southern Tibet. This fossil-extruded channel is now exposed
between the MCT and the South Tibetan Detachment System (STDS) (figure 2) and now is believed to be more complex than a single continuous-channel flow-extrusion sequence (Hollister and Grujic, forthcoming). According to Nelson et al. (1996) and Hauck et al. (1998), there is now a mid-crustal, partially molten layer under Tibet, and this is used to infer a ductile channel that now extends from under southern Tibet to under the Himalaya (Hodges et al. 2001; Beaumont et al. 2001; Beaumont et al. 2004; and Grujic et al. 2002) and to the eastern margins of the Tibetan Plateau (Clark and Royden 2000; Clark et al. 2005; Burchfiel 2004). Thus, it is reasonable to suggest that a continuation of the process that produced the GHS is in progress now. However, the location of possible current flow areas of hot ductile rock and the areas of brittle deformation can only be determined through seismic techniques (Klemperer, forthcoming). In order to locate such areas, we deployed a temporary five-station network within central and western Bhutan (figure 2) as a pilot experiment. We found that a high seismicity rate occurs throughout the crust beneath southern Bhutan and that certain zones appear to define strike-slip faults. Furthermore, there is a paucity of seismicity under northern Bhutan and southern Tibet.
TECTONIC SETTING The Bhutan Himalaya contains the major structures of the 2,50-km Himalayan arc. These structures include the MBT, the MCT, and the STDS (figure 2). The geological structures are based on the work of the Geological Survey of Bhutan, the Geological Survey of India (Bhargava 1995; Gansser 1983), and the recent work of Grujic et al. (1996, 2002). The presence of
Seismological Research Letters Volume 78, Number 4 July/August 2007 447
29°N
CHINA 28°N
PARO
TASH
BHUTAN
KT DOCH
Goalpara Lineament
STDS
BUMT
CHUK 27°N
MCT MBT MFT
INDIA 26°N 88° E
89°E
90°E
91°E
92°E
93°E
▲▲ Figure 2. Map of Bhutan showing the major faults and location of the stations deployed by the University of Texas at El Paso (UTEP). Fault names are Main Frontal Thrust (MFT), Main Boundary Thrust (MBT), Main Central Thrust (MCT), Kaktang Thrust (KT), South Tibetan Detachment System (STDS). Station names are BUMT, CHUK, PARO, DOCH, and TASH.
an out-of-sequence thrust, the Kakhtang Thrust (KT), located between the MCT and the STDS, was recognized as an additional prominent feature in Bhutan (Grujic et al. 1996, 2002; Davidson et al. 1997). Many geophysical studies have investigated the collision of India with Asia, primarily focusing on Nepal and Tibet (e.g., Hauck et al. 1998; Monsalve et al. 2006). Recent work has shown different kinematic domains within the collision zone (e.g., Drukpa et al. 2006; Andronicos et al., forthcoming; Rajendran et al. 2004). The Bhutan Himalaya lies in a transpressive environment (Drukpa et al. 2006), which is different from the compressive domain in Nepal (Andronicos et al., forthcoming). This is likely due to the deflection of convergence in the relative movement between the plates determined from GPS measurements (Larson et al. 1999). Drukpa et al. (2006) also show that recent strong strike-slip events (1995 and 2003), which occurred at an approximate depth of 35 km, imply seismicity of the region resulting from strain partitioning due to a transpressive tectonic environment of the Bhutan Himalaya. The USGS Earthquake Data Reports and the International Seismic Centre (ISC) global catalogs show a relatively low seismicity level for the Bhutan segment of the orogen, with the last great earthquake in the region occurring in 1897 (Bilham and England 2001; Drukpa et al. 2006). However, the location of the 1897 earthquake rupture zone event did not occur along the Himalayan detachment surface (Seeber and Armbruster 1981; Chen and Molnar 1983, 1990) but along the steep northdipping Dauki fault that defines the southern boundary of the “pop-up” structure of the Shillong Plateau (Bilham and England 2001; Rajendran et al. 2004).
DEPLOYMENT AND DATA PROCESSING We deployed five seismic stations in the Kingdom of Bhutan from January 2002 to March 2003 (figure 2). The seismic stations, composed of equipment from the PASSCAL instrument pool, were installed in cooperation with the Geological Survey of Bhutan. The array consisted of three Guralp 40T (stations DOCH, PARO, and TASH) and two Strickheisen STS-2 (stations CHUK and BUMT) broadband seismometers, with a sampling rate of 40 samples per second. The seismometers were placed in approximately 1-m-deep vaults and serviced every three months. For the first six months ( January to July 2002), all stations were recording. After six months, data were lost due to power losses and hardware issues; thus we had sporadic coverage from August to December 2002. We automatically processed the data using the Antelope software package (Boulder Real Time Technologies). We performed detections on the vertical component data streams of all stations using three different filter bands to detect all possible phases at all possible distances. Once phase detections were made, we performed an association using a local grid of locations. This step associates detections with events on the grid (for depth, latitude, and longitude), creating a set of preliminary earthquake locations. We found more than 2,100 events using the automatic processing. We then associated our automated bulletin with the USGS Preliminary Determination of Epicenters (PDE) catalog and found almost 1,200 events from this bulletin. Thus, we have 900 earthquakes that are not associated with the PDE. We obtained additional data from GSN stations in the region, including LSA, KMI, CHTO, HYB, and NIL, for the
448 Seismological Research Letters Volume 78, Number 4 July/August 2007
900 events that were not in the PDE global catalog based on the times of our automated bulletin. We reviewed all 900 events, manually picking all phase arrivals, including regional phases such as P, S, and Lg. After this manual analysis and refinement of the phase picks, we relocated the events using the LocSAT algorithm (Bratt and Bache 1987) and a global velocity model IASP91 (Kennett and Engdahl 1991). We refined the locations using an average velocity model obtained from China (Steck et al. 2001). To investigate the local seismicity, we then subselected the events that have occurred within Bhutan between latitudes 26.5° to 28.5° and between longitudes 89° to 92° (figure 2) and with an error ellipse of less than 100 km for its semimajor axis, leaving us with 175 events. We find that many of the events were recorded at LSA and not at the other regional stations, suggesting that these events are not large in magnitude.
VELOCITY MODEL AND EARTHQUAKE LOCATIONS Because no previous local seismic data have been recorded in Bhutan, a crustal velocity model was created. Regional models for the area (e.g., Haines et al. 2003; Pandey et al. 1999; Zhao et al. 1993; Sun 2003; Mitra et al. 2005) have been devised, but these are not adequate for local earthquake work. Our approach involved using a combination of Velest (Kissling et al. 1994) and Hypoellipse (Lahr 1999) to iteratively find a minimum 1-D velocity model and then examining the single event locations from HYPOELLIPSE for error ellipsoid statistics. We relocated the 175 events by simultaneously inverting for P- and S-wave velocity structure using Velest, the algorithm of Kissling et al. (1994). This algorithm is designed to derive 1-D velocity models for earthquake location and is an initial reference model for seismic tomography. Using our data subset of 175 events and a velocity model developed for Tibet (the Tibet 45 velocity model; Romanowicz 1982) as an initial reference, we further divided each layer into 10-km-thick layers and extended the velocity model to a depth of 100 km. We iterated between event locations and the individual layer velocity adjustments in order to calculate phase velocity based on travel times to the local stations. After the iteration (which consisted of approximately four iterations) we output the average layer velocities and hypocenter adjustments and each re-calculated layer velocity was then input as the initial reference model. Also, the newly obtained locations were used as the initial event locations. This iteration process was repeated with the velocity and hypocenter changes made, until the velocity adjustments made on each layer approached or became zero. At this point, layers with similar velocities were combined to yield the final derivation of our velocity model for the area, which consisted of six layers. The derived velocity model showed a slightly higher P-wave velocity than the input velocity model (Tibet 45). The S-wave velocities were not adjusted, mostly due to the few S-wave picks in our data set. Thus, we chose a Vp/Vs ratio of 1.73 to map the S-wave velocity structure from the P-wave structure. However, many of the small events appeared to have occurred outside the temporary network, despite our inclusion of other stations
such as LSA. Such events were so poorly constrained that they provided little useful contribution to a model. Thus, the Velest model was used only to help constrain our final model, and we relied on merging our new model with existing models (Pandey et al. 1999; Zhao et al. 1993; Sun 2003; and Mitra et al. 2005). The result was a model that provided reasonable minimization of the location, an average root mean square (RMS) of 0.25 s, and average maximum ellipses axis of 22 km for the 12 events, with network azimuthal gaps of less than 180 degrees. This model, which characterizes only the shallow crust, was combined with a mean lower crust/Moho/upper mantle characterization taken from Pandey et al. (1995), Zhao et al.(1993), Sun (2004), and Mitra et al. (2005). The Moho constraints in the region were derived from Cattin et al. (2001), which were derived using gravity profiles. We note here that the extreme 3-D heterogeneity throughout this region implies that our model is only a crude approximation and cannot be extrapolated with any confidence outside the immediate area of our network.
RESULTS In general, events were recorded by only four or five stations, with few stations/events yielding more than five phase arrivals. Table 1 outlines data quality based on number of phases and preliminary azimuthal gap based on initial locations. Because of the limited number of phases available for location, we were unable to make use of joint or differential methods to better constrain the events in our catalog; hence, we chose to present these data using the HYPOELLIPSE single event locations for this investigation of Bhutan seismicity. Hypocenters were scattered throughout the country, with some epicenters having large error ellipses. Given the large uncertainty ellipsoids (figure 3), the observed activity must be interpreted cautiously. A quasi-linear cluster of events can be seen in the southwestern quadrant of Bhutan. Unfortunately, this intriguing concentration of events occurred outside the network and azimuthal coverage was poor, but error ellipses were fairly constrained. Hence, we have little confidence in their absolute locations as they appear in figure 3, but the relative relationships among the locations, however, appear robust. During our efforts to obtain a best-velocity model, the cluster TABLE 1 Quality Assigned to Locations Based on Azimuthal Gap, Number of Stations that Recorded the Event, and Number of Phases Present for Each Station. Group
Azimuthal Gap
# of Stations
# of Phases
A1 A2 B1 B2 C1 C2
≤180° ≤180° > 180° ≤ 270° > 180° ≤ 270° > 270° > 270°
≥4