Statistical process control charts are a CQI technique aimed at monitoring a process and its variability. A t our hospital, statistical quality control charts are being ...
Using Statistical Quality Control Techniques to Monitor Blood Glucose Levels Thomas A. Oniki, MS, Terry P. Clemmer, MD, Department of Critical Care, Lori K. Arthur, RN, Lorraine H. Linford, RN, CNSN, Nutritional Support Service, LDS Hospital, Salt Lake City, Utah
Continuous Quality Improvement techniques developed in industry are increasingly being applied to the medicalfield. Statistical process control charts are a CQI technique aimed at monitoring a process and its variability. A t our hospital, statistical quality control charts are being constructed from laboratory blood glucose measurements of patients receiving enteral orparenteral nutrition. The charts will be used to monitor glucose levels, reveal variations, and illustrate the effects of new protocols designed to manage glucose levels.
- -
UCL
lw
x
L CL
4
I.z 3
2
4
5
Samp
6
7 e
9
10
INTRODUCTION
Figum
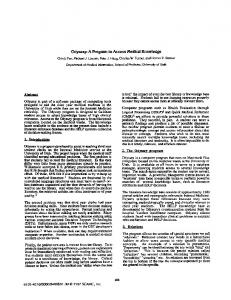
An example of an X-bar chart process, the investigator first determines whether or not the process is "in control". The process is not in statistical control if any plotted mean falls outside the upper or lower control limits or if the data exhibit "trends", "runs", "periodicity", or "hugging of the center line". These tendencies are defined in the literature.'3"16 They indicate that non-random variations are occurring in the process. SQC dictates that investigations be made to determine the cause of the non-random variations and then that corrective actions be taken. If the data do not exhibit any nonrandom behaviors, then the process is said to be "in control", or "stable", i.e., any variation in the measurements is due only to random variation. X-bar charts are usually used in conjunction with either R (range) charts or S (standard deviation) charts. R and S charts are constructed in the same manner as X-bar charts, except the summary statistic plotted is range or standard deviation of the sample group instead of the mean. The chart's center line represents the mean of the ranges or the mean of the standard deviations. SQC recommends that the R or S chart be examined first for non-random variation. Once non-random points on the R or S chart are identified and addressed, non-random variation in the X-bar chart may appropriately be addressed. Then, after non-random variation is eliminated from both charts, the task of reducing variability is undertaken. A P chart displays the proportion of the group conforming to a certain criterion, over time. For example, each point on a P chart may represent the proportion of doorknobs that were defective in a day. Computers make the task of gathering and storing
Amid increasing pressure to reduce the cost of health care while maintaining or enhancing the quality of the care delivered, some in the medical field have turned their attention to Continuous Quality Improvement (CQI) techniques developed in industry.'-2 One area of CQI focuses on "efforts to continuously increase knowledge of and control over variation in the processes of work through the widespread use of scientific methods of data collection and analysis and action on data".'0'1' This objective is the aim of a body of methods known as Statistical Quality Control (SQC).3"'4 The guiding principle of SQC (and CQI in general) is that it is the work "process", and not the individuals participating in the process, that must be analyzed, measured, and modified in order to improve quality. Quantifiable process variables or outcomes must first be identified, and then regularly measured. Improving quality stems directly from reducing variation in these variables or outcomes. SQC provides techniques for charting and analyzing the variables or outcomes. SQC methods generally utilize small sample groups selected from a process at regular time intervals, for example, four doorknob diameter measurements taken from a doorknob assembly line each day. To construct an "X-bar" chart, the means of the groups of four diameter measurements would be plotted against time. A center line reflecting the mean of the group means is also plotted. Finally, upper and lower control limits representing 2 or 3 standard errors about the centerline are plotted. An example of an X-bar chart is shown in Figure 1. After constructing the chart, before ever concerning himself with reducing variablilty in the 0195-4210/95/$5.00 ©D 1995 AML, Inc.
586
1
Seven overlapping groupings are formed from the glucose values. The groups are composed of glucose values from: (1) ICU patients, (2) non-ICU patients,
the data necessary to construct charts more convenient and less time-consuming. Software packages make chart construction and analysis much easier than the tedious manual construction and analysis that would otherwise be required. At LDS Hospital, we wanted to know how glucose levels of patients receiving enteral feedings and Total Parenteral Nutrition (TPN) were varying both between patients and over time. Glocose variation is due primarily to four factors: (1) glucose infusion rates, (2) exogenous insulin rates, (3) exogenous use of other glucose-influencing hormones (steroids, glucagon, catecholamines, and growth hromones), and (4) patient factors such as stress, diabetes, liver function, and electrolyte abnormalities. Of these four factors, the healthcare provider can control or compensate for (1), (2) and (3), but has less control over (4), except for controlling electrolyte balance. However, we had the perception that there was wide variability in the manner (1), (2), and (3) were being controlled, and that this variability at least in part was responsible for clincially unacceptable glucose levels in the patient poplulation in question. Our hope was that if we could in a systematic way control the factors we could control, we could compensate for the derrangements caused by the factors we could not control. The expected result would be glucose values in the TPN-fed and enterally-fed poplulation that were more clincially acceptable. SQC charts would enable us to observe that result, first in the disappearance of most or all of the "out-of-control" points, 'and then later in a reduction in the variablility of glucose values. This report focuses on our application of SQC control charts to monitor a "process". In the medical quality assurance literature, "process" refers to the "set of activities that go on within and between practitioners and patients".46 Our "process" in this case is the management of patients' glucoses.
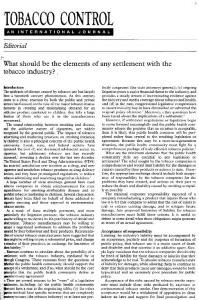
(3) patients receiving steroids, (4) patients not receiving steroids, (5) diabetic patients, (6) nondiabetic patients and (7) all patients. Naturally, group (7) is the set of all glucose values. The monitor writes the categorized glucose values out to two Tandem files -- one for the TPN patients, and the other for the enteral patients. Quarterly, the Tandem glucose data files are downloaded to a personal computer running the SPSS 6.0 for Windows statistical software package. An SPSS syntax script reads the files and does further grouping and analysis. It counts how many glucose values are "above target" (> 200 mg/dl), "below target" (< 100 mg/dl), "above critical" (> 350 mg/dl), and "below critical" (< 60 mg/dl). It then constructs statistical quality control charts. The three standard error level is used in constructing control limits. For each file, 42 control charts (6 charts for each of the 7 patient sub-categories) are generated. The 6 charts are: (1) an X-bar chart, (2) an S chart, (3) a P chart showing the proportion of glucoses above target, (4) a P chart showing the proportion of glucoses below target, (5) a P chart showing the proportion of glucoses above critical, and (6) a P chart showing the proportion of glucoses below critical. Weeks are used as the sampling intervals in each chart. Each point on an X-bar chart represents the mean glucose value for the week. Each point on an S chart represents the standard deviation of the glucose values observed during the week. In the P charts, each point represents the proportion of the week's glucose values that met the conformance criterion ("below target", "above critical", etc.). RESULTS In the interest of space considerations, only three charts will be presented and discussed as illustrative of the analysis process. The X-bar chart and the S chart for TPN patients in the ICUs are shown in Figures 2 and 3 for the period from July 1, 1994 to January 31, 1995. A P chart reflecting the proportion of ICU TPN patient glucoses above target (> 200 mg/dl) is shown in Figure 4, for the same time period. As per SQC procedure, the S chart will be addressed first, before examining the X-bar chart. Several points in Figure 3 indicate non-random variation in the process. The point outside the control limits at week 4 of 1995 could be brought inside the limits by eliminating one particular patient's data. That patient's glucose values rose to levels above 400
METHODS Each night, just after midnight, a glucose monitor is run on LDS Hospital's Health Evaluation through Logical Processing (HELP) clinical information system. The main feature of the HELP system is a centralized patient database located on a Tandem mainframe computer.'7 The database receives inputs from many departments -and ancillary services throughout the hospital. The glucose monitor first identifies patients who were on the Nutritional Support Service's daily TPN or enteral patient lists. It then searches for laboratory glucose data taken from those patients during the day.
587
7
cm
.E ICrT 150~
c _0150__
125
s -- AJ * N - a X
UCL
zf
UCL
0
Center = .2625
Average 175.24 CL
]
100 4
LCL
LCL
_
Week
Week
Sgfma lve: 3
g ee 3 g0kw
Figure 4 P chart showing proportion of ICU TPN patient glucose measurements that were higher than the target (> 200 mg/dl)
Figur 2 X-bar chart of lab glucose values of TPN patients in the ICUs
140
data of two patients who had consistently high glucose measurements during the week (one with a high of 400 mg/dl and the other with a high of 337 mg/dl). Again, we have identified sources of nonrandom variation, but not yet eliminated their causes. The points outside the control limits in Figures 3 and 4 indicate that the process of managing the glucose levels of TPN patients in the ICUs varies non-randomly, i.e., the process is unstable. In keeping with SQC procedure, steps are presently being taken to increase the stability of the process. Firstly, a protocol for TPN ordering was implemented on February 1, 1995. The protocol was based on the work of Bistrian and McMahon, et. al.'8'20 It dictates the maximum dextrose infusion rate to be used, specifies the conditions under which fat calories should be increased, and specifies how much insulin should be included in the TPN order according to how much has been given previously and what current glucose levels are. The protocol currently exists only in paper form and is not yet used consistently. Modifications are still being made to it. Also, a new computerized TPN ordering program will soon be installed. We will be able to use the new program to enforce some parts of the new protocol. Secondly, a new protocol for administering insulin drips is being piloted in one of the ICUs (the Shock/Trauma/Respiratory ICU) at LDS Hospital. The insulin drip protocol will work in conjunction with the TPN protocol to determine insulin dosages to be administered to TPN patients and as a result hopefully add stability to the process of managing glucoses. An S chart and a P chart illustrating data since February 1, 1995 are shown in Figures 5 and 6.
1202
60
UCL 20
Average LCL
26WK 94 300WK094
34WK94 38WK94 42WK494 46WK94 50WK94 2WK85 28 WK 94 32 WK 94 36 WK 94 40 WK 94 44 WK 94 48 WK 94 52 WK 94 4 WK 95
Week Sgna level: 3
Figure 3 S chart of lab glucose values of TPN patients in the ICUs
mg/dl following surgery on January 22. Similarly, the out-of-control point at week 2 could be brought inside the control limits by eliminating the glucose values of another patient. That patient's glucose level reached a low of 51 mg/dl on January 9, 1995 and a high of 443 mg/dl two days later following surgery. We suspect that the other points indicating non-random variation are similarly attributable to particular patients with especially deranged glucose levels. We have identified sources of non-random variation, but have not eliminated the causes. Therefore, we are not ready to examine the associated X-chart. The P chart (Figure 4) exhibits a point outside the control limits at week 52 of 1994. The point can be brought within the control limits by eliminating the
588
* C
infusion rate, for example. Other aspects, such as insulin dosages to be ordered, will not be automatically enforced by the program, but reminders to the ordering physician may be included. The insulin drip protocol has only been in effect since March in only one of the four ICUs in the hospital and education is also probably an issue. We would expect to see observable increases in stability only after the protocols are used consistently. Our implementation of SQC theory presents several problems. Others have suggested using control charts to monitor physiologic variables in individuals."' A physician at one of our affiliated clinics is monitoring the glucose levels of individual patients using control charts. In our use of control
cu UCL
a 03
ALO
I
LCL
{K 95
Week S&gml evel 3
charts, however, we are grouping multiple patient together in our weekly groups. Furthermore, we are adding to our "process" the procedures by which clinicians manage those patient processes. Our process, then, is the sum of multiple patient physiological processes as well as multiple clinician management processes. Hopefully, implementing the TPN and insulin drip protocols will
Flgur 5 S chart of ICU TPN patient glucose levels after implementation of TPN protocol
processes
.7-
._
5
both stabilize the clinician management processes and reduce the variation in them. It remains to be seen whether or not differences between individual patients' physiologies are small enough to allow a completely stable process to result. Another problem in our graphical analysis is disproportionate weighting of patients within our weekly groups. Unlike in an assembly line setting, where groups may be formed by taking a fixed number of samples from the line each day, we could devise no rational method of sampling only a few glucoses each week. Instead, we are in essence employing 100% sampling, i.e., we are including in our weekly groups all glucose measurements taken during the week. As a result, those patients who have multiple glucose measurements taken during a day exert more influence on the weekly statistic than do patients who have only one or fewer measurements per day. Because patients with more deranged glucose values tend to have more frequent measurements performed, the weekly statistic is likely pulled in the direction of derangements. We tolerate this problem because it is those very derangements that we would like brought to our attention; overweighting only serves to over-emphasize the out of-control points. We interpret the charts in context, aware that points are weighted toward derangements. Manual data gathering and control chart construction would be a tedious or even untractable process. The integrated nature of the HELP system allows the necessary data to be gathered by a single
e
J
I
icuHr z
UCL .1-__I
l_
Ct. 2911
LCL
0.
3lWK9
ItWK 95 6WK95
11 WK95
WK 95
8WK95
10WK96
13WK 95
12WK96
15 WK95
14WK95
Week Sigmnielv: 3
Figure 6 P chart showing proportion of glucoses from ICU TPN patients higher than target (> 200 mg/dl), after implementation of TPN protocol
DISCUSSION
Figure 6 shows
no
out-of-control points, but it is
too soon to conclude stability in the process. SQC theory suggests that at least 20 to 25 measurements be
taken. Furthermore, Figures 5 demonstrates that nonrandom variation still exists in the process. This is not unexpected. As has been noted, the TPN protocol is not yet being used consistently. We expect that a certain education period will be necessary before the TPN protocol is fully complied with. Also as has been noted, work on the protocol is ongoing. The new TPN ordering program will assist with compliance. It will automatically set the dextrose
-
589
program that runs automatically and unsupervised. The glucose values are available from the data sent to the HELP system from the blood laboratory. ICU versus non-ICU determination is made by comparing glucose measurement times with room trace information stored in the system. Patients receiving steroids at the times of glucose readings can be determined from the drug order information. Diabetic patients can be identified because the Nutritional Support Service staff enter that information in the computer on their problem lists. We foresee increasing the stability of the glucose management process by standardizing the way insulin and TPN are administered. In so doing, we expect to be able to observe the increased stability on control charts. Certain of the control charts will likely prove more useful than others. As we gain experience, we will reduce the number of charts generated to that most useful subset. At the very least, the use of control charts provides us with a means of visually monitoring glucose levels of patient subpopulations and how the levels are varying over time. Previously, we had only a vague notion of that information.
7.
8.
9.
10. 11. 12.
13.
Acknowledgements We wish to acknowledge Gayle White, BSN, Celena A. Carlson, BSN, Helene B. Peterson, RDCD, and Margaret M. Hock, RDCD of the LDS Hospital Nutritional Support Service for their efforts and their support of this project.
14.
References
16.
1. 2.
3. 4.
5.
6.
15.
Demos MP, Demos NP. Statistical quality control's role in health care management. Quality Progress. 1989;August:85-89. Re R, Krousel-Wood MA. How to use continuous quality improvement theory and statistical quality control tools in a multispecialty clinic. QRB. 1990;November:391-397. Berwick DM. Continuous improvement as an ideal in health care. N Engl J Med. 1989;320(1): 53-56. Donabedian A. Explorations in Quality Assessment and Monitoring: The Definition of Quality and Approaches to Its Assessment. Ann Arbor, Mich:Health Administration Press. 1980. Donabedian A. The quality of care -- how can it be assessed? JAMA. 1988;260(12):1743-1748. Laffel G, Blumenthal D. The case for using industrial quality management science in health care organizations. JAMA. 1989;262(20):28692873.
17. 18.
Chamberlin WH, Lane KA, Kennedy JN, Bradley SD, Rice CL. Monitoring intensive care unit performance using statistical quality control charts. Int J Clin Monit. 1993;10:155-161 Kuperman G, James B, Jacobsen J, Gardner RM. Continuous quality improvement applied to medical care; experiences at LDS Hospital. Med Decis Making. 1991;1 (suppl to No. 4):60S-65S. Weed M. Systems for quality management and cost reduction. In Proceedings of Quest for Quality & Productivity in Health Services. 1989, Inst. of Indust. Engineers. 1989. 17 1-176. Berwick DM. Controlling variation in health care: a consultation from Walter Shewhart. Md Care. 1991;29:1212-1225. Blumenthal D. Total Quality Management and Physicians' Clinical Decisions. JAMA. 1993 ;269(21):2775-2778. Berwick DM, Godfrey AB, Roessner J. Curing Health Care: New Strategies for Quality Improvement. San Francisco, CA:Jossey-Bass, Inc. 1990. Wadsworth HM, Stephens BS, Godfrey AB. Modern Methods for Quality Control and Improvement. New York, NY:John Wiley & Sons, Inc. 1986. Shewhart WA. Statistical Method from the viewpoint of quality control [reprint]. New York: Dover Publications, Inc. 1986. Ishikawa K. Guide to Quality Control. White Plains, NY:Quality Resources (Asian Productivity Organization). 1982. Gitlow H, Gitlow S, Oppenheim A, Oppenheim R. Tools and Methods for the Improvement of Quality. Homewood, IL:Richard D. Irwin, Inc. 1989. Kuperman GJ, Gardner RM, Pryor TA. HELP: A Dynamic Hospital Information System. New York, NY: Springer-Verlag, Inc. 1991. Nompleggi D, Bell SJ, Blackburn GL, Bistrian BR. Overview of gastrointestinal disorders due to diabetes mellitus: emphasis on nutritional support. Journal of Parenteral and Enteral Nutrition.
1989;13(1):84-91. 19. Hongsermeier T, Bistrian BR. Evaluation of a practical technique for determining insulin requirements in diabetic patients receiving total parenteral nutrition. Journal of Parenteral and Enteral Nutrition. 1993;17(1):16-19. 20. McMahon M, Manji N, Driscoll DF, Bistrian BR. Parenteral nutrition in patients with diabetes mellitus: theoretical and practical considerations. Journal of Parenteral and Enteral Nutrition. 1989; 13(5):545-55 1.
590