... Chipman, J.W. (2004):. Remote sensing and Image Interpretation, Fifth Edition, John ... Smith, L.C. (1997): Satellite Remote Sensing of River. Inundated Area ...
水 文 ・ 水 資 源 学 会 誌 J. Japan Soc. Hydrol. & Water Resour. Vol. 19, No.1, Jan.. 2006 pp. 44 - 54 原著論文
Using Synthetic Aperture Radar (SAR) Data for Mapping River Water Flooding in an Urban Landscape: A Case Study of Greater Dhaka, Bangladesh Ashraf M. DEWAN 1) Kwabena KANKAM-YEBOAH 1) Makoto NISHIGAKI 2) 1)Graduate School of Natural Science and Technology Okayama University (3-1-1 Tushima-nakaokayama. 700-8530 Japan)
2)Department of Environmental Design and Civil Engineering Okayama University (3-1-1 Tushima-nakaokayama. 700-8530 Japan)
Precise flood mapping is a prerequisite for efficient flood disaster management. Flood induced losses can be minimized by means of acquiring precise flood disaster information through mapping of flood prone areas. In this paper, radar remote sensing (RADARSAT) data is used to accurately delineate the distribution of open water inundation during the biggest flood of 1998 in Greater Dhaka City, Bangladesh. Seven flood time imageries and one dry season image were used to identify the precise and widest flooding area that is expected to be helpful for developing apposite flood countermeasures. The radar images were digitally processed to geometrically rectify the pixel geometry and were filtered to suppress speckle noise. The imageries were classified according to flooded (open water) and non-flooded categories using the Maximum Likelihood Decision Rule. The classification accuracy of the radar data were then evaluated using ground reference data. Spatial-temporal analysis of flooding revealed that flood water started to increase from early July 1998 (inundating 34.65%) and reached its peak on 25 August (inundating 51.29%). This was mainly attributed to heavy monsoonal downpour and early peaking of river water levels. The eastern part of the city suffered severe flood damage. In contrast, most of the western part of Greater Dhaka was not severely flooded due to the existing flood control works and relatively higher elevation. Classification accuracy of imageries show that all image in the dataset produced satisfactory results. The highest overall accuracy attained was 88.57% for 31 July image, followed by 7 July and 10 September images, respectively (82.86% and 81.90%). Kappa statistics for all the images were also in good agreement except the August images. The results showed that SAR data is of value for real-time flood monitoring for a fast growing city like Dhaka and can provide the necessary information for flood disaster information and management. Keywords: 1998 Flood, Flood mapping, RADARSAT, Dhaka, Synthetic Aperture Radar (SAR).
Ⅰ.INTRODUCTION Accurate and precise delineation of flood prone areas using remote sensing data has received considerable attention in the last couple of decades due to the drawbacks associated with traditional method. Traditional method involves ground observations/surveys during and/or after the flood. This observation however, constitutes many
44
原著論文
disadvantages such as very costly, requires many skilled people in the field and erroneous demarcation of entire coverage etc. (Smith, 1997). For formulating any flood management strategy, perhaps the most crucial step is to identify the areas most vulnerable to flood. Identification of exact flood prone areas is very useful to communicate flood disaster information to the
水文・水資源学会誌 第19巻 第1号(2006)
concern authority as well as to the people. Thus, effective management can be performed by developing proper relief and emergency operation during the catastrophe (Corbley, 1993). Microwave remote sensing equipped with Synthetic Aperture Radar (SAR) sensor has become a valuable means for hydrological assessment for the last two decades (Galy and Sanders, 2002; Horrit et al. 2001; Hess et al. 1990). Apart from its all weather capability, the most important advantage of using SAR imagery is that land and water contrast can be easily distinguished. Radar data is particularly useful for hydrological studies in monsoon countries where inclement weather and cloud cover precluded imaging by optical sensors in the monsoon season (Imhoff et al. 1987). In addition, SAR can explicitly represent flooding in lowland systems where subtle topographic variations limit the utility of digital elevation models for hydrologic studies (Townsend, 2001). On the other hand, in the absence of satellite image, digital elevation model (DEM) can be of great value for flood delineation. For instance, Flood Forecasting and Warning Center (FFWC) in Bangladesh presently using a 300x300 DEM for producing flood maps at national and local level on daily basis during monsoon season (FFWC, 2005). The Canadian RADARSAT provides the most effective tools currently available for flood mapping and monitoring applications worldwide. This is due to its ability to provide synoptic coverage on a global scale at comparatively fine temporal and spatial resolutions (RSI, 1995). It operates at a C-band frequency (wavelength of 5.6 cm) with H-H polarization. It can image the earth at multiple incidence angles (10 to 59°), spatial resolutions and swath widths. Many studies have demonstrated the abilities of Radarsat SAR (Toyora et al. 2002; Townsend, 2001; Zhou et al. 2000; Otsubo et al. 2000; Adam et al. 1998). Review of SAR application on flood studies suggests that the majority of the literature is on either flood mapping in wetland environment or flood detection under forest canopy. For instance,
hydrological studies using SAR data revealed that river water flood mapping in urban landscape is very infrequent (NASA, 1998). But it is very important to conduct remote sensing capabilities for flood mapping in urban areas, as it is anticipated that by 2030, 60 % of the world's human population will be living in urban areas (UN, 2001). During the monsoon season, flood is a common feature in Dhaka, the capital of Bangladesh which is home to more than 10 million people. The flood that occurred in 1998 in Dhaka is described as the worst natural disaster in Dhaka's memorable history (Faisal et al. 1999). The 1998 flood was prolonged than any known event, resulted in severe damage and untold sufferings to the inhabitants living in Greater Dhaka. Available data (Mohit, 1995) suggests that the Bangladesh government, in association with international agencies, have spent US $ 141.6 million on flood control measures to solve the perennial flood problem in Dhaka, but the annual flood damage and flood affected areas increased considerably (Mohit and Akhter, 2000). The construction of embankments along river banks is the most popular approach used to mitigate flood disaster in Dhaka. However, it has become apparent that such an approach is not enough (IFCDR, 1998). In addition, it is also clear that the growing flood hazards of Dhaka have not been analyzed for purposes of disaster mitigation (Mitchell, 1999). As a result, urban planners and hydrologist have called for the delineation of precise flood prone areas for the mitigation of future damage and lives from floods using the latest information technology (Islam, 1998). Application of satellite technology is very crucial to third world cities since it is difficult for governments to update their databases very frequently due to the lack of resources (Dong et al. 1997). The objective of this paper is to evaluate the utility and accuracy of using C-band RADARSAT SAR data to develop maps of flood prone areas of Greater Dhaka City for the biggest flood of 1998.
原著論文
45
J. Japan Soc. Hydrol. & Water Resour.Vol. 19, No.1, 2006
Fig. 1 The study area.
Ⅱ.STUDY AREA The study area chosen for this research is the Greater Dhaka City, Bangladesh. Latitude and longitude of the lower left and upper right corners of the study area are 23°68' N 90°33' E and 23°90' N, 90°50' E, respectively (Fig. 1). The area is located mainly on an alluvial terrace, popularly known as the Modhupur terrace of Pleistocene period. Topographically, Dhaka is, relatively, a flat land. The surface elevation of the area ranges between 1 and 15 m (FAP 8A, 1991). It belongs to the sub-tropical monsoon zone and experiences humid climatic conditions. The city experiences about 2000 mm annual rainfall, of which more than 80% occurs during the monsoon season. Historically, the city is endowed with rivers, numerous khals (ephemeral water bodies)
46
原著論文
and canals that drain water from the upper reaches during the monsoon season. As population increased, these areas were encroached on, compounding flood problems.
Ⅲ.METHODS 1. SAR imagery and preprocessing
Flood information for the 1998 event was extracted by employing multi-temporal RADARSAT ScanSAR (Narrow and wide mode) imageries. Seven flood time imageries (JulyOctober, 1998) and one dry seasonal (15 Dec) image were considered for detailed flood mapping in Greater Dhaka. The flow chart of the methodology is shown in Fig. 2. Before rectifying the images, GAMA-MAP
水文・水資源学会誌 第19巻 第1号(2006)
Fig. 2 Flow chart of the methodology.
filter with 5x5 window size was used to reduce speckle, a granular effect in radar image. Then, rectification of all images was performed to a 1997 Landsat Thematic Mapper (acquisition date 10 January) reference image of the study area. A total of 75 ground control points (GCPs), about 10-11 GCPs for each image, uniformly distributed over the area of interest, were used for the image registration process. A second-order polynomial fit was applied and pixel values were resampled to 50 m. The resulting root mean square error (RMSE) was less than 1 pixel. Finally, all images were projected to the Bangladesh Transverse Mercator (BTM) system (FAP 19, 1995). This produced a total of 166560 pixels (347 x 480) in a computer screen for the individual image. Radiometric correction of the RADARSAT images involves in removing shades from the ScanSAR data used in this study.
2.Ground reference data collection
For the classification and verification of the remotely sensed SAR images, ground reference data was collected using the following steps. First, an integrated data set was visually examined to establish possible relations between features imaged by the SAR and corresponding ground observations. In addition, the boundaries of each land cover type were outlined on the interactive display of an image analysis system and described as to field number and land cover type. The set of individually outlined fields thus constituted a ground truth map. Secondly, an extensive field work was carried out, from 6 February 2003 to 22 March 2003, in order to collect reference data. One hundred (at least 50 for each class) reference data were collected in the field using a GPS equipment (GPS receiver accuracy was less than 10 m). The information on the location of reference sites was then brought into GIS for overlaying with images for the selection of
原著論文
47
J. Japan Soc. Hydrol. & Water Resour.Vol. 19, No.1, 2006
training areas and subsequent accuracy assessment. Since flooding in the study area is a function of river water level and rainfall, the corresponding daily river gauge and rainfall records were collected, analyzed and incorporated. 3.Image analysis
Extraction of flood areas consisted of classifying individual SAR images into water and non-water areas. Both the visual interpretation and supervised classification techniques were used to associate spectral signature with different landcovers. In the visual interpretation process, three consecutive images were stacked into one layer that produced a color composite image. This method is very useful as it increases interpretability of SAR data (Oberstadler et al. 1997). For example, in the case of interpretation difficulties it was helpful to be able to compare the gray values (a sequence of gray tones ranging from black to white) of the flooded and nonflooded areas. Note that visual interpretation technique was not the primary concern to classify SAR images. This technique was used to increase the interpretability of radar data that assisted supervised classification. In image classification process, the Maximum Likelihood Classification (MLC) algorithm was used to extract the flood areas. Using a digital elevation model (DEM) and reference data, training areas were selected. Initially, numerous signatures (about 12 subclasses for each class) were collected from individual images because of the wide variation of Digital Number (DN) in the radar data using the seed pixel method (Lillesand and Keifer, 1999). Pixels assigned to subclasses were eventually merged into two classes i.e. flooded (water) and nonflooded (non-water). 4.Determination of flooded and non-flooded areas
After the extraction of flooded and non-flooded areas from the individual images, every image was then superimposed on a dry season classified SAR image in order to estimate the net inundated areas
48
原著論文
on each date of the 1998 flood in Greater Dhaka. It is necessary to note here that the dry seasonal water bodies were discarded for flood area estimation. Hence, only the flooded areas were obtained. The flooded area percentage (%) for each flood time image was then obtained using the following equation suggested by Islam and Sado (2000): a × 100 Inundation area percentage (%) = a+b (1) where, a = inundated area, b = non-water area 5. Assessing map accuracy
Generally, classification accuracy of remotely sensed data refers to the comparison of two data sets, one based upon analysis of remotely sensed data and the other is based upon reference data obtained from field survey (Congalton, 1991). In order to assess the accuracy of information extracted from remotely sensed data, a total of 100 equalized random pixels (50 for each class) were first generated for each classified image. Then, using the ground truth map, sample pixels were verified separately and the results derived in error/confusion matrix. For each map, the overall accuracy was calculated as the number of correctly classified sites divided by the total number of testing sites (Story and Congalton, 1986). A nonparametric Kappa test was also used to measure the classification accuracy as it accounts for all elements in the confusion matrix rather than just the diagonal elements (Rosenfield and FitzatrickLins, 1986). It was used as a measure of total accuracy. The Kappa coefficient for the entire matrix is calculated according to Lillesand et al. (2004): r
k=
r
N ∑ xii − ∑ (xi + x +i ) i =1
i =1
r
(2)
N 2 − ∑ ( xi + x + i ) i =1
where k is the Kappa-coefficient, r is the number of rows in the error matrix, xii is the number of observations in the major diagonal (row i and column i), xi+ is the total number of observations in row i, x+i is the total number of observations in
水文・水資源学会誌 第19巻 第1号(2006)
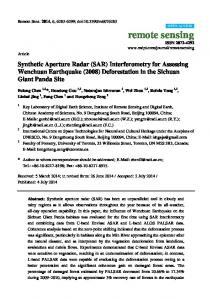
Fig. 3 Derived flood maps from SAR data evaluated by MLC algorithm.
column I and N is the total number of observations in the matrix.
Ⅳ.RESULTS AND DISCUSSION 1.Spatial and temporal pattern of flooding
The spatial distribution of flood maps obtained from the SAR data revealed that flooding did not occur in most of the western part of Greater Dhaka (Fig. 3). This was due to relatively higher elevation of this part than other parts of Greater Dhaka. Moreover, this area was brought under flood protection by constructing 31.67 km long embankment after the 1988 flood under the
national Flood Action Plan (Faisal et al. 1999). However, the embankment itself created an obstacle to receding flood water in many areas. This in turn created severe drainage problem and heavy rainfall aggravated the flooding problem (IFCDR, 1998). Interestingly, in the eastern part of the city, inundation is largely dominated by the river water while in western part rainfall together with river waters are the main determinants. Radical changes in land use in the western part may have significant impact on flood process in Dhaka. For example, rapid infilling of open spaces in low lying neighborhoods in western part is the potential for increased flooding.
原著論文
49
J. Japan Soc. Hydrol. & Water Resour.Vol. 19, No.1, 2006
Table 1 Estimated flooded area percentage by using maximum likelihood classifier.
The temporal dynamics of flood extent at different dates (in terms of percentage of inundation area) during the 1998 flood were computed, as shown in Table 1. Using equation 1, the flood progress was calculated. For example, the December 15, 1998 image represents the dry season while the July 7, 1998 image represents the flood season. Therefore, water areas in both dry season and flood season (12.85 %) are normal water bodies such as river, lake, ponds, etc. The water areas in the flood season but non-water areas in the dry season (29.78 %) represent the inundated areas in flood season. The non-water areas in both dry and flood season (56.17 %) represent the non-inundated area (only land area) in Greater Dhaka. The water areas in dry season but non-water areas in flood season (1.2 %) represent the error in pixels. Thus the total flooded areas, excluding the normal water bodies, were 34.65 %. Time series of newly flooded and flood recovered areas can therefore be understood. It was found that
50
原著論文
the highest percentage of flooded area (51.29 %) was on August 25 1998, which agreed with a result obtained by the threshold technique (Dewan and Nishigaki, 2004). Three hypotheses can be made concerning the presence of water. These are that: (a) it rained again, (b) more waters came down from the upstream and spread over the already flooded zones - consequently increasing the affected area, and (c) both phenomena occurred simultaneously. In order to ascertain these hypotheses, rainfall and water level data were incorporated and analyzed. Rainfall records confirmed one of the hypotheses which revealed that remarkable changes of rainfall in the month of August, which was 367.8 mm higher than the normal, caused more areas to be inundated. Examination of surrounding river water levels within the study area confirmed that all the rivers peaked very early and remained above the Danger Level (DL) for more than two months, exacerbating flood problems (Dewan et al. 2004; Faisal et al. 1999). In addition, the back water effect from downstream rivers caused flood water to recede at a faster rate (IFCDR, 1998). The September and October images showed that, with the lowering of rainfall, the flooded areas were reduced but at a
水文・水資源学会誌 第19巻 第1号(2006)
lethargic rate. This was attributed to the river water since all rivers of the study area were above the bankfull stage until the last week of September. 2.Mapping accuracy
On radar image, water and land areas can be easily separated due to their distinct tonal variation. Generally, water pixels consist of very low radar return due to specular scattering resulting in dark gray tone while land areas are often characterized by high radar returns resulting in very bright tone due to corner reflection in radar image. Analysis of error matrix of RADARSAT images implies that this opinion does not hold true at all times. The error matrix of each map is shown in Table 2. It was found that, e.g. in 7 July 1998, of 100 % water pixels, 96.08 % (row 1, column 1) were classified as water. These, of course, were the correctly classified pixels while 3.92 percent pixels (row 2, column 1) were incorrectly assigned to non-flooded pixels. In the non-water category, 1.45 % (row 1, column 2) was misclassified as water. The highest misclassification of water pixels occurred in 25 August while non-water highest misclassification was registered for 25 August and 17 September, respectively. This misclassification might be attributed to several errors associated with radar image. For instance, it was difficult to spectrally separate open spaces (parks, institution grounds, golf courses with grassy characteristics, linear features such as roads) because of their intermediate tonal characteristics. This group of features generally appeared as medium gray and their DN values
were slightly higher than that of water pixels. Difficulty was also encountered with the occurrence of low returns from features adjacent to water bodies, such as airport runways which are bordered by lakes. These are common problems in studying urban surface using radar data (Dong et al. 1997). Some of the map errors likely stemmed from the interactions between ground features (land/water boundaries), surface roughness, soil and vegetation moisture content, and radar parameter configurations (incidence angle, polarization, and wavelength). These are very complex phenomena and subject to much research (Ramsey, 1999; Lee and Lunetta, 1995). Polarization of RADARSAT may have been another source of error. Sensors with H-H polarization are known to be less sensitive to changes in vegetation moisture content than crosspolarized sensors, HV, VH (Avery and Berlin, 1992). This may provide an additional explanation for the confusion between classes. Larger incidence angle may increase specular reflectance for a given surface (Sokol et al. 2000). Thus, relatively large incidence angle may have been the source of error in the confusion of land covers. Another possible source of error could be misregistration of images (Townshend et al. 1992). Since the field data was collected after five years of the actual event, it could be a source for misclassification of pixels. Analysis of the results of this study showed that the SAR data performed comparatively well in mapping open water flooding in Greater Dhaka, compared to other SAR studies. Radar data have been used to study forest flooding (Hess et al. 1995; Townsend,
Table 2 Error matrix derived by maximum likelihood classification (%)*.
原著論文
51
J. Japan Soc. Hydrol. & Water Resour.Vol. 19, No.1, 2006
2001), tidal flooding (Ramsey, 1995), detection of freshwater wetland flooding (Toyora et al. 2002; Adam et al. 1998). Among theses studies, Townsend (2001) reported very high classification accuracy (93.5 %) and others obtained variable accuracies. Toyora et al. (2002) used an image fusion approach to study wetland flood mapping. Their result demonstrated that, SAR data alone produces 70 % accuracy but when used with optical data (SPOT) the accuracy increased to 92 %. Adam et al. (1998) also achieved over 90 % mapping accuracy for flood detection in a freshwater wetlands using RADARSAT data. Zhou et al. (2000) used SAR data to study flood damage in China, concentrating mainly on acquiring flood depth and duration using threshold; hence, no accuracy was reported. Otsubo et al. (2000) also used time-series RADARSAT data to study flooding in Lower Mekong Basin. The intention of the study was to develop time-series flood maps that can be invaluable for flood damage abatement (Otsubo et al. 2000). In contrast, Henderson et al. (1998) conducted a study using SAR data from a coastal wetland in a complex urban setting using both RADARSAT and ERS data; and obtained a fairly poor accuracy for both sensors. Compared to the results obtained by Henderson et al. (1998), the results in this paper are encouraging and can be facilitated to obtain flood disaster information. This information can further be expanded to plan suitable flood countermeasures in the future.
V.CONCLUSIONS RADARSAT data is very useful for inundation mapping. In this study, multitemporal Radarsat ScanSAR data have been used to delineate flood prone areas in Greater Dhaka City, Bangladesh for the flood event of 1998. It is shown that open water flood mapping and monitoring in urban areas can be done effectively even if confusion of land cover categorization exists. It can be said that RADARSAT SAR application for urban flood monitoring is very pressing to fast growing cities
52
原著論文
like Dhaka and elsewhere. Moreover, historical flood mapping can help in ameliorating flood risk. The conclusions of the study reported in this paper are as follows: (i) This study explored the widest flood prone areas for Greater Dhaka City which is expected to be very useful for future urban planning and flood disaster management. (ii) This study confirmed that RADARSAT data is of value for urban open water flood delineation in lowland system where high resolution DEM data is not available. (iii) Multitemporal RADARSAT SAR data were obtained for the 1998 catastrophic flood in Dhaka City, Bangladesh. Flooded and non-flooded areas were extracted by digitally classifying images using supervised Maximum Likelihood Classification (MLC) technique. (iv) Extraction of flood prone areas showed that from early July, flood water started to rise and reached its peak on 25 August, affecting 51.29 % of the study area. Heavy rainfall played a significant role in worsening the flood situation during the 1998 deluge, particularly in the month of August. Although, digital classification of images provided good results for flood area extraction, image contrast was reduced considerably due to the presence of many features as mentioned earlier in the August images that produced low radar returns and made it difficult to spectrally separate from non-water areas. However, with the aid of auxiliary data, these problems were surmounted and satisfactory results obtained. (v) Accuracy assessment of all the images revealed that the highest mapping accuracy was for July 31, 1998 where 88.57 % overall accuracy is attained which means that the flood information obtained from the SAR data and corresponding ground data have more than 88 % spatial agreement. The July 7 and September 10 images also produced good overall accuracies of 82.86 and 81.90 %, respectively. In contrast, the August 10 and 25 images produced comparatively lower mapping accuracies. Kappa coefficient, which is
水文・水資源学会誌 第19巻 第1号(2006)
regarded as a suitable measure of accuracy, showed that only the 31 July result were in very good agreement (77.13 %) between the remotely sensed classifications and ground verification data followed by 07 July data (65.65%).
REFERENCES Adam, S., Wiebe, J., Collins, M. and Pietroniro, A. (1998): RADARSAT Flood Mapping in the Peace-Athabasca Delta, Canada, Can. J. Rem. Sen., 24 (1), pp. 69-79. Avery, T.E. and Berlin, G.E. (1992): Fundamentals of remote sensing and airphoto interpretation, 5th edition, Macmillan, pp. 472, New York. Congalton, R.G. (1991): A review of assessing the accuracy of classifications of remotely sensed data, Rem. Sen. Env., 37, pp. 35-46. Corbley, K. (1993): Remote Sensing and GIS provide rapid response for flood relief, Ear. Obs. Mag., September 2, pp. 28-30. Dewan, A.M., Nishigaki, M. and Komatsu, M. (2004): DEM based flood extent delineation in Dhaka City, Bangladesh, J. Fac. of Env. Sci. & Tech., Okayama University, 9(1), pp. 99110. Dewan, A.M. and Nishigaki, M. (2004): Using Synthetic Aperture Radar with GIS for flood damage estimation, Proceedings of the 6th Annual Meeting of the Japan Society for Disaster Information Studies, pp. 157-162, Tokyo. Dong, Y., Forster, B. and Ticehurst, C. (1997): Radar backscatter analysis for urban environments, Int. J. Rem. Sen., 18(6), pp. 1351-1364. Faisal, I.M., Kabir, M.R. and Nishat, A. (1999): Non-structural flood mitigation measures for Dhaka City, U. Wat., 1, pp. 145-153. Flood Action Plan 19, (1995): Satellite based Radar for Flood Mapping in Bangladesh , ISPAN/USAID, pp. 98, Dhaka, Bangladesh. Flood Action Plan 8A, (1991): Master Plan Study for Greater Dhaka Protection Project, Japan International Cooperation Agency, pp. A1-A7, Dhaka, Bangladesh, (Supporting Rep. I). Flood Forecasting and Warning Center, (2005): http://www.ffwc.gov.bd/FloodMap Galy H. and Sanders R.A. (2002): Using Synthetic Aperture Radar Imagery for Flood Modeling. Trans. in GIS, 6(1), pp. 31-42 Henderson, F.M., Chasan, R., Hart, T.F. Jr. and Portolese, J. (1998): Variations in SAR signal response from coastal wetlands in a complex urban setting, Proceedings of the 2nd International Workshop on retrieval of bio- and geo-physical parameters from SAR data for land applications, 21-23 October, ESTEC, pp. 487-492, Noordwijk, The Netherlands. Hess, L.L., Melack, M.J. and Simonett, D.S. (1990): Radar Detection of flooding beneath the forest canopy, Int. J. Rem. Sen., 11(7), pp. 1313-1325. Hess, L.L., Melack, J.M., Filoso, S. and Wang, Y. (1995): Delineation of inundated area and vegetation along the Amazon floodplain with SIR-C Synthetic Aperture Radar, IEEE Trans. Geosci. & Rem. Sen., 33(4), pp. 896-903. Horritt M. S., Mason D. C. and Luckman A. J. (2001): Flood boundary delineation from Synthetic Aperture Radar imagery using a statistical active contour model, Int. J. Rem. Sen.,
22(13), pp. 2489-2507. Imhoff, M.L., Vermillion, C., Story, M.H., Choudhury, A.M., Gafoor, A. and Polcyn, F. (1987): Monsoon Flood Boundary Delineation and Damage Assessment Using Space borne Imaging Radar and Landsat Data, Photo. Eng. & Rem. Sen., 53 (4), pp. 405-413. Institute of Flood Control and Drainage Research (IFCDR) (1998): Impact of 1998 Flood on Dhaka City and Performance of Flood Control Works, pp. 76, Dhaka. Islam, Md. M. and Sado, K. (2000): Development of Flood Hazard Maps of Bangladesh using NOAA-AVHRR images with GIS, Hydro. Sci. J., 45(3), pp. 337-355. Islam N. (1998): Flood '98 and the future of Urban Settlements in Bangladesh, National Seminar on Flood '98 and Management of Floods in Future, 8th December 1998, Dhaka. Lee, K.H. and Lunetta, R.S. (1995): Wetland detection methods, IN: J.G. Lyon and J. McCarthy, J. (edited), Wetland and Environmental applications in GIS, pp. 294-284, Lewis, Florida. Lillesand, T.M. and Keifer, R.F. (1999): Remote Sensing and Image Interpretation, pp. 704, John Wiley, New York. Lillesand, T.M., Keifer, R.W. and Chipman, J.W. (2004): Remote sensing and Image Interpretation, Fifth Edition, John Wiley and Sons, New York. Mitchell, J.K. (1999): Megacitites and natural disasters: a comparative analysis, GeoJournal, 49, pp. 137-142. Mohit, M.A. and Akhter, S. (2000): Delineation of flood damaged zones of Dhaka City based on the 1998 flood by using GIS IN: Ali, M.A., Seraj, S.M. and Ahmed, S., (eds.), (2000): Engineering Concerns of Flood, Bangladesh University of Engineering and Technology, pp. 380, Dhaka. Mohit, M.A. (1995): Flood disaster and metropolitan management in Bangladesh with special reference to Dhaka city, Symposium on Innovative approaches to New Urban Community Development, Osaka, Japan, 9, pp. 179-197. NASA, (1998): SAR References, http://southport.jpl.nasa.gov/science/SAR_REFS.html. Oberstadler, R., Honsch, H. and Huth, D. (1997): Assessment of the mapping capabilities of ERS-1 SAR data for flood mapping: A case study in Germany, Hydro. Proc., 11, pp. 1415-1425. Otsubo, Y., Ito, T. and Iida, H. (2000): Time-series of inundation mapping using RADARSAT-SAR, J. Rem. Sen. J., 20(4), pp. 80-88. RADARSAT International, (1995): Radarsat Illuminated, Guide to RADARSAT Products and Services, http://www.rsi.ca. Ramsey, III E.W. (1999): Radar remote sensing of wetlands, IN R.S. Lunetta and C.D. Elvidge (eds.) Remote Sensing Change Detection, pp. 211-243, Ann Harbor Press, Chelsea, Michigan. Ramsey III, E.W. (1995): Monitoring flooding in coastal wetlands by using radar imagery and ground based measurements, Int. J. Rem. Sen., 16 (13), pp. 2495-2502. Rosenfield, G.H. and Fitzpatirck-Lins, K. (1986): A coefficient of agreement as a measure of thematic classification accuracy, Photo. Eng. & Rem. Sen., 52(2), pp. 223-227. Smith, L.C. (1997): Satellite Remote Sensing of River Inundated Area, Stage and Discharge: A Review, Hydro. Proc., 11, pp. 1427-1439. Sokol, J., Pultz, T. J. and Bulzgis, V. (2000): Monitoring wetland hydrology in Atlantic Canda using multi-temporal and multi-beam Radarsat data, Remote Sensing and Hydrology, International Association of Hydrological Sciences, pp. 536538, New Mexico. Story, M. and Congalton, R.G. (1986): Accuracy assessment: a user's perspective, Photo. Eng. & Rem. Sen., 52(3): pp.
原著論文
53
J. Japan Soc. Hydrol. & Water Resour.Vol. 19, No.1, 2006
397-399. Townsend, P. A. (2001): Mapping Seasonal Flooding in Forested Wetlands using Multi-Temporal RADARSAT SAR, Photo. Eng. & Rem. Sen., 67(7), pp. 857-864. Townshend, J. R. G., Justice, C. O., Gurney, C., and Mcmanus, J. (1992): The impact of misregistration on change detection. IEEE Trans. Geosci. & Rem. Sen., 30, pp. 10541060. Toyra, J., Pietroniro, A. and Martz, L.W. (2002): A Multi-sensor approach to wetland flood monitoring, Hydro. Proc., 16, pp.
1569-1581. United Nations, (2001): World Urbanization Prospects: The 2001 Revision, Division of Economics and Social Affairs, pp. 192, United Nations Secretariat. Zhou, C., Luo, J., Yang, C., Li, B. and Wang, S., (2000): Flood Monitoring using Multi-Temporal AVHRR and RADARSAT Imagery, Photo. Eng. & Rem. Sen., 66 (5), pp. 633-638.
(Received:Dec.8,2004, Accepted:Oct.14,2005)
洪水による都市域の浸水区域特定への レーダーリモートセンシングデータ(ラダルサット)の適用性について Ashraf M. DEWAN 1) Kwabena KANKAM-YEDOAH 1) 西垣 誠 2) 1)岡山大学大学院自然科学研究科 (〒700-8530
岡山県津島中3-1-1)
2)岡山大学環境理工学部環境デザイン工学科 (〒700-8530
岡山県津島中3-1-1)
洪水災害マネジメントにおいて詳細な洪水区域図は必須条件である.冠水し易い区域の特定に基づいて詳細な洪 水災害の情報を得る手法を用いれば,損失を引き起こす洪水を最小限に抑えることができる. 本研究では,レーダーリモートセンシング(ラダルサット)のデータを利用してこれを評価し,バングラデシュ 国のダッカ市で1998年に発生した洪水に伴う浸水区域の分布を高い精度で抽出した.適切な洪水対策を講じるため に有用と考えられる最大浸水区域を正確に特定するために,洪水期間の7画像と乾期の1画像を使用した.レーダー 画像をデジタル処理してピクセルデータに変換し,微小ノイズを除去するためにフィルタリング処理を施した.最 大尤度判定規則を用いて画像を浸水区域と非浸水区域に区分した.レーダーデータの区分の精度は,地表データを 参照して評価した.洪水の多時点解析によると,浸水区域は1998年7月(浸水率34.65%)から増加し始め,主にモ ンスーン性の豪雨と河川水位の早い時期の上昇により8月25日にピークを迎えた(浸水率51.29%)ことが明らかと なった.市内東部では深刻な洪水被害が発生した一方で,西部では相対的に標高が高く洪水制御設備も完成してい たことから被害はなかった.画像の区分の精度からは,本研究で用いたデータ画像は十分な結果を得られたことは 明らかである.最も高い精度だったのは7月31日の画像で88.57%に達し,つづいて7月7日(82.86%),9月10日 (81.90%)の順となった.また,すべての画像に対して算出したKappa係数は,8月の画像をのぞいて良い一致を得 た.この結果,SARデータは,ダッカ市などの急成長している都市での実時間洪水モニタリングにおいて極めて重 要であり,洪水災害の情報とマネジメントのために重要な情報を与えることが可能であることが明らかとなった.
54
原著論文