Using the Beopt Automated Residential Simulation Test Suite to Enable Comparative Analysis Between Energy Simulation Engines Preprint Paulo Cesar Tabares-Velasco, Jeff Maguire, Scott Horowitz, and Craig Christensen To be presented at the 2014 ASHRAE/IBPSA-USA Building Simulation Conference Atlanta, Georgia September 10-12, 2014
NREL is a national laboratory of the U.S. Department of Energy Office of Energy Efficiency & Renewable Energy Operated by the Alliance for Sustainable Energy, LLC This report is available at no cost from the National Renewable Energy Laboratory (NREL) at www.nrel.gov/publications.
Conference Paper NREL/CP-5500-62273 September 2014 Contract No. DE-AC36-08GO28308
NOTICE The submitted manuscript has been offered by an employee of the Alliance for Sustainable Energy, LLC (Alliance), a contractor of the US Government under Contract No. DE-AC36-08GO28308. Accordingly, the US Government and Alliance retain a nonexclusive royalty-free license to publish or reproduce the published form of this contribution, or allow others to do so, for US Government purposes. This report was prepared as an account of work sponsored by an agency of the United States government. Neither the United States government nor any agency thereof, nor any of their employees, makes any warranty, express or implied, or assumes any legal liability or responsibility for the accuracy, completeness, or usefulness of any information, apparatus, product, or process disclosed, or represents that its use would not infringe privately owned rights. Reference herein to any specific commercial product, process, or service by trade name, trademark, manufacturer, or otherwise does not necessarily constitute or imply its endorsement, recommendation, or favoring by the United States government or any agency thereof. The views and opinions of authors expressed herein do not necessarily state or reflect those of the United States government or any agency thereof. This report is available at no cost from the National Renewable Energy Laboratory (NREL) at www.nrel.gov/publications. Available electronically at http://www.osti.gov/scitech Available for a processing fee to U.S. Department of Energy and its contractors, in paper, from: U.S. Department of Energy Office of Scientific and Technical Information P.O. Box 62 Oak Ridge, TN 37831-0062 phone: 865.576.8401 fax: 865.576.5728 email: mailto:
[email protected] Available for sale to the public, in paper, from: U.S. Department of Commerce National Technical Information Service 5285 Port Royal Road Springfield, VA 22161 phone: 800.553.6847 fax: 703.605.6900 email:
[email protected] online ordering: http://www.ntis.gov/help/ordermethods.aspx
Cover Photos: (left to right) photo by Pat Corkery, NREL 16416, photo from SunEdison, NREL 17423, photo by Pat Corkery, NREL 16560, photo by Dennis Schroeder, NREL 17613, photo by Dean Armstrong, NREL 17436, photo by Pat Corkery, NREL 17721. NREL prints on paper that contains recycled content.
2014 ASHRAE/IBPSA-USA Building Simulation Conference Atlanta, GA September 10-12, 2014
USING THE BEOPT AUTOMATED RESIDENTIAL SIMULATION TEST SUITE TO ENABLE COMPARATIVE ANALYSIS BETWEEN ENERGY SIMULATION ENGINES Paulo Cesar Tabares-Velasco1, Jeff Maguire1, Scott Horowitz1, and Craig Christensen1 1 National Renewable Energy Laboratory, Golden, CO
standard software test methods (Judkoff et al. 1983; Bland 1992), recommended different materials for each test case (Bland 1992), and used a mix of analytical, empirical and comparative data (Tabares-Velasco and Griffith 2012). The International Energy Agency (Irving 1982) and the Commission of the European Communities (Jensen 1995) have performed other broad verification and validation studies. Reviews of past work can also be found in the literature (Bloomfield 1999), and other organizations (CEN 2004; ASHRAE 2011; RESNET 2013) have developed standards. For residential applications, Mills (2004) showed the challenges of comparing more than 60 residential energy tools, finding possible programing errors and differences in predicted whole-house energy use of up to 3 times between energy tools. Mills concluded that comprehensive validation protocol is needed. Other work has compared RESNET codecomplaint software. Liu et al. (2010) noted the difficulty of comparing software with different inputs and found significant differences when comparing a few residential building models. Mukhopadhyay et al. (2014) performed sensitivity analysis that revealed differences caused by hard-coded assumptions in various programs. In this study, comparisons were performed using the BEopt Automated Residential Simulation Test Suite (BARTS). BARTS allows for automated comparative testing of different simulation engines across a wide range of model parameters using BEopt. BEopt is the National Renewable Energy Laboratory’s (NREL) residential building simulation and optimization program, and can use a variety of simulation engines (BEopt 2014). BARTS compares simulation engines and provides insightful visualization of the results that allows significant discrepancies to be quickly identified. BARTS addresses most of the technical gaps stated by: (1) defining a comparison philosophy, (2)
ABSTRACT Verification and validation are crucial software quality control procedures to follow when developing and implementing models. This is particularly important because a variety of stakeholders rely on accurate predictions from building simulation programs. This study uses the BEopt Automated Residential Simulation Test Suite (BARTS) to facilitate comparison of two energy simulation engines across various building components and includes building models that isolate the impacts of specific components on annual energy consumption. As a case study, BARTS has been used to identify important discrepancies between the engines for several components of the building models. These discrepancies are caused by differences in the algorithms used by the engines or coding errors.
INTRODUCTION Residential building energy models can be used to estimate the energy savings and cost effectiveness of various retrofit measures, aid in the design of new construction homes, and evaluate the impacts of installing more efficient components across an entire region. Several simulation engines are available. The goal of this project is to compare two engines (referred to as Engine A and Engine B) to determine the differences in their energy consumption predictions. Understanding these differences can lead to improvements in the simulation engines, which reduces the uncertainty of energy savings estimates from both engines and results in more robust calculations of the impacts of efficiency measures and regional potential. Early validation efforts in building energy modeling focused on analytical verification using simple geometries (Wortman et al. 1981). This effort was followed by more detailed studies that defined verification and validation procedures as well as
1 This report is available at no cost from the National Renewable Energy Laboratory (NREL) at www.nrel.gov/publications.
mapping inputs of various simulation engines, (3) automating thousands of building simulations that represent existing and new construction, (4) creating diagnostic cases that help solve discrepancies between engines, and (5) having advanced visualization tools. In a case study demonstrating its capabilities, BARTS was used to compare two simulation engines and identify significant differences between the engines.
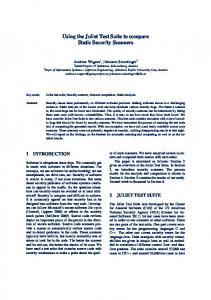
consistently as possible. Figure 1 shows the mapping process for walls. A specific wall assembly was selected in BEopt with properties for each layer: exterior finish, sheathing, cavity insulation, stud dimensions, and drywall. For Engine A the wall is explicitly modeled, including each layer, its thermophysical properties (thermal conductivity, density, and specific heat), and thickness. For Engine B the same wall assembly is simulated using Engine B’s recommended R-value based on a lookup table using stud spacing, stud dimensions, and cavity insulation. Scripts are used to map each BEopt component that is available in both engines. The level of difficulty in mapping the range of building components can vary significantly. Mapping windows, for example, is very straightforward with these engines, requiring only the same U-value and
APPROACH Following ASHRAE Standard 140 (ASHRAE 2011; Judkoff and Neymark 2006) and NREL’s methods to improve the accuracy of residential energy calculations (Polly et al. 2011), this study performed comparative testing of the building envelope and mechanical equipment to identify discrepancies in energy results between Engines A and B. BARTS uses BEopt to automate the process of running equivalent building models in these engines. BEopt is a “meta” program that can interface with multiple simulation engines. It also provides an easy-to-use graphical user interface for entering building geometry; option characteristics (wall construction, heating, ventilation, and air conditioning [HVAC] equipment, etc.); and site characteristics, including economic inputs. Using BEopt also ensures that components are always consistently compared (e.g., walls with the same insulation levels or furnaces with the same annual fuel utilization efficiency [AFUE]). The comparison philosophy and the mapping process (which was used to create equivalency between the engines) are described below.
Figure 1. Example of the mapping process for walls
Comparison Philosophy A comparison philosophy was established to capture all discrepancies for typical users of Engines A and B, caused by differences in: •
Recommended inputs
•
Available options
•
Built-in assumptions and values
•
Physics models and algorithms
solar heat gain coefficient as inputs (though the engines differ in their internal modeling of the windows). More difficult components include walls and HVAC systems, which have built in differences in how they are modeled in different engines and many more inputs. BEopt Automated Residential Simulation Test Suite BARTS is an automated tool within the BEopt framework that facilitates the comparison of simulation results between two engines for tens of thousands of equivalent buildings. It systematically sweeps through all technology categories in BEopt (walls, windows, HVAC equipment, etc.) and evaluates each component one at a time. Thus, it is essentially a sensitivity study over a large parameter space (Polly et al. 2012). It also follows a similar approach as the RESNET software verification test suite (RESNET 2013); it includes several HVAC systems, ducts, and hot water systems, among other building components. BARTS has previously been used to compare DOE-2.2 to EnergyPlus (Booten et al. 2012). For this case study, NREL modified BARTS to accommodate buildings, technologies, and climates that
• Coding errors in simulation engines The first two causes are related to recommended inputs for specific model components (e.g., R-value for wall assemblies) or workarounds (e.g., Engine B does not explicitly model vaulted ceilings, but has a recommended workaround). The last three are related to more fundamental differences within the engines. All these differences can lead to significant discrepancies between engines and are therefore captured by BARTS. Mapping Mapping is the process of creating equivalent inputs in both engines for a given BEopt building component. This is important to ensure the engines are compared as
2 This report is available at no cost from the National Renewable Energy Laboratory (NREL) at www.nrel.gov/publications.
are typical for the two simulation engines. The modified test suite consists of: •
3 building types: diagnostic, new, and existing
•
2 locations: Seattle and Boise
All new and existing building models are consistent with the Building America House Simulation Protocols (Hendron and Engebrecht 2010) and are similar to RESNET Test cases 1-4. After all the models are built, BARTS runs all the simulations and stores the results in a database where differences can be quickly visualized and filtered using the built in visualization tool, illustrated in Figure 2. Items 1 and 2 contain information on the analyzed simulation engines (in this case Engines A and B) and which BARTS run is being shown. The vertical axis shows the differences in predicted energy consumption between the engines; the building components run along the horizontal axis. All the energy use is disaggregated by end use (heating, cooling, ventilation, etc.). Users can also filter the results to look at specific scenarios to examine:
10 geometries: Different attic types, foundation types, and homes with and without attached garages. The combination of these parameters results in 60 buildings for which every BEopt component (~500) was evaluated within the context of each building, one at a time, for a total of roughly 30,000 building simulations in each engine. The three building types are: Diagnostic: The diagnostic building is used to isolate the energy impacts of a specific building component in the simulation engines. The idea is to eliminate the impacts of all other building components while running a parametric through the components of interest. For example, if windows are being analyzed, all other surfaces in the building are super-insulated, infiltration is minimized, ideal HVAC equipment is used, and all internal gains are eliminated so that the only heat transfer is through windows. This building type has similar characteristics to Case 195 from ASHRAE 140 (ASHRAE 2011), although is more generic since it tests all BEopt options. New: The new construction test building (Table 1) has a complete set of options typically found in new homes. Existing: The existing test building (Table 1) has a complete set of options typically found in older existing homes. Table 1. Characteristics of New and Existing Buildings New Existing Walls R-19 Uninsulated Attic R-38, Vented Uninsulated, Vented Basement R-21 Uninsulated Walls Crawlspace R-30 Ceiling, Uninsulated Vented Ceiling, Vented Slab Uninsulated Uninsulated Window Type Double Pane, Single Pane Low-e Window Area 15% of Wall 15% of Wall Area Area Infiltration 10 ACH50 15 ACH50 Appliances Standard Old Air Conditioner SEER 13 SEER 10 Furnace 78% AFUE, 78% AFUE, Gas Gas Ducts 7.5% leakage, 30% leakage, R-6 Uninsulated •
•
Building type
•
Climate/geometry
•
Category (this is used to zoom in to a specific category; e.g., heating set point)
•
Data (energy use, loads not met, HVAC capacities)
•
Graph type (bar or line graphs plotting differences between engines or actual values).
RESULTS Discrepancies between simulation engines can occur across nearly all technologies because of inherent differences in modeling algorithms, inputs, and assumptions. The results described here focus on a subset of technologies with the most significant differences for illustrative purposes.
3 This report is available at no cost from the National Renewable Energy Laboratory (NREL) at www.nrel.gov/publications.
Figure 2. BARTS viewer
4 This report is available at no cost from the National Renewable Energy Laboratory (NREL) at www.nrel.gov/publications.
discrepancy. Instead, BARTS visualization capabilities can be used to slice the data in various ways to isolate discrepancies, which generally affect the results of new and existing buildings. However, they are more easily observed when viewed in the context of the diagnostic building, which isolates the impact of individual building components. Most of the results from BARTS to follow demonstrate discrepancies in the diagnostic building.
Overall Engine A vs. Engine B Results Results from BARTS produced thousands of equivalent buildings simulated in both engines. Figure 3 and Figure 4 show the space heating energy use calculated in Engine A (x-axis) and Engine B (y-axis) for each building. Figure 3 shows results for the new construction buildings in Seattle. Figure 4 shows results for the existing buildings in the same location. The bold sloped line indicates results with perfect agreement; the two lighter lines to each side represent the ± 25% range for purposes of visualizing the magnitude of the discrepancies. There are more buildings with larger discrepancies in the existing building case, which suggests that some of the construction options used in existing buildings lead to significant discrepancies between the engines.
Identified Discrepancies Twenty-one significant discrepancies between Engines A and B were found in this case study. Not all are shown here, but examples of several different types (based on the comparison philosophy) are discussed below. Whole Slab Insulation Figure 5 shows heat loss through the slab for the diagnostic building. Initial results from Engine B indicated that the heat loss through the slab was nearly independent of the slab insulation level, in contrast to Engine A, which showed a significant difference when changing insulation levels. Discussion with Engine B’s developers revealed a bug in the internal calculation of heat loss that had previously set a lower limit to the slab heat loss rate, causing the discrepancy. This bug was addressed by removing the lower limit; the improved results in Figure 5 show that Engine B now follows the same trend as Engine A. However, discrepancies remain between the two engines that tend to be larger for cases with slab perimeter insulation.
Figure 3. BARTS results for new construction homes in Seattle
Air Leakage Figure 6 shows the energy use for a new construction building with different air leakage levels. Both engines agree very closely for higher ACH rates. However, when the air leakage rates drop lower than 4 ACH, Engine B starts to follow a trend of higher heating energy use for reduced air leakage levels. This discrepancy occurred when there are leaky ducts in the crawlspace combined with very low air leakage rates, which leads to different predictions in the air flow networks used in the models. This discrepancy is due to modeling differences between engines, because the infiltration model used in Engine B includes air exchange between the crawlspace and the living space; the infiltration model used when running Engine A with BEopt does not.
Figure 4. BARTS results for existing homes in Seattle Figure 3 and Figure 4 are useful as high-level snapshots of the differences between the engines. However, they are less useful for diagnosing the root cause of a given
5 This report is available at no cost from the National Renewable Energy Laboratory (NREL) at www.nrel.gov/publications.
Figure 5. Slab results for diagnostic building before (top) and after (bottom) fix
Figure 6. Infiltration results for new construction homes in Seattle
6 This report is available at no cost from the National Renewable Energy Laboratory (NREL) at www.nrel.gov/publications.
Crawlspace wall insulation Figure 7 shows the results for crawlspace wall insulation in the diagnostic building. Significant differences occur for uninsulated crawlspaces. Possible reasons for this discrepancy are: •
The Engine B recommended R-values for uninsulated crawlspaces are significantly higher than those used when running Engine A with BEopt calculated R-values.
•
Poorly insulated building components are more susceptible to differences in boundary conditions such as ground-coupling.
•
Poorly insulated building components are more susceptible to the differences in convection coefficient algorithms (Engine B uses a constant convection coefficient, while Engine A has a variable coefficient).
•
Poorly insulated building components are more susceptible to differences in boundary conditions such as sky temperature.
Figure 7. Crawlspace wall insulation results in diagnostic building Ceiling Insulation
Figure 8. Ceiling insulation results in diagnostic building
Figure 8 shows the results for ceiling insulation for a home with an attic in the diagnostic building. Differences between engines for varying levels of ceiling insulation can be observed, with particularly large discrepancies in uninsulated cases. There are few possible reasons for these differences, which are largely caused by differences in recommended inputs and in built-in assumptions: •
CONCLUSIONS This study shows the capabilities of the BEopt Automated Residential Simulation Test Suite (BARTS) in performing comparative software testing and validation. BARTS combines the BEopt interface and “meta” program capabilities, a comparison philosophy to capture all causes of discrepancies between engines, and visualization tools. In this study, BARTS was used to automatically compare tens of thousands of equivalent buildings in the two simulation engines. This
Engine B provides a recommended R-value for uninsulated ceilings that is significantly different than that used when running Engine A with the BEopt calculated R-value.
7 This report is available at no cost from the National Renewable Energy Laboratory (NREL) at www.nrel.gov/publications.
testing led to the identification (and in some cases resolution) of significant discrepancies that occurred for a variety of reasons, including differences in modeling assumptions, differences in recommended inputs, and coding errors. BARTS will continue to improve, both in terms of functionally and graphical user interface. Depending on funding and interest, future work may compare other simulations engines, investigate R-value for empty cavities, and/or perform full comparison with other comparative tests.
Judkoff, R., Neymark, J. 2006. Model Validation and Testing: The Methodological Foundation of ASHRAE Standard 140. ASHRAE Trans. 112 (2): 367-376 Liu, Z. et al. 2010. Going beyond a RESNET certification for code-compliant simulations: a comparison of detailed results of three RESNETcertified, code-compliant residential simulation programs, 4th IBPSA-USA National Conference, New York City, August 11 – 13: 277-284. Mills, E. 2004. Inter-comparison of North American residential energy analysis tools, Energy and Buildings 36: 865–880. Mukhopadhyay, J., Baltazar J.C., Haberl J.S., and Yazdani B.2014. Comparison of the performance predictions of a 2009 IECC code-compliant house using IC3 REM/Rate, EnergyGauge and ResCHECK, ESL-TR-13-09-02, Texas Engineering Experiment Station, Texas A&M. Polly, B., Horowitz, S., Booten C., Kruis N., Christensen C. (2012). Automated Comparison Of Building Energy Simulation Engines. Golden, CO: NREL/PR-5500-52651. Polly, B., Kruis, N., Roberts, D. (2011). Assessing and Improving the Accuracy of Energy Analysis Methods for Residential Buildings. Golden, CO: NREL/TP-5500-50865. RESNET. 2013. Procedures for Verification of RESNET Accredited HERS Software Tools, RESNET Publication No. 13-002 Tabares-Velasco, P.C., Griffith, B. 2012. Diagnostic Test Cases for Verifying Surface Heat Transfer Algorithms and Boundary Conditions in Building Energy Simulation Programs. Journal of Building Performance Simulation 5 (5): 329–346. Wortman, D., O’ Doherty, B., and Judkoff, R., 1981. Implementation of an analytical verification technique on three building energy-analysis codes: SUNCAT 2. 4, DOE 2. 1, and DEROB III. Golden, CO: Solar Energy Research Institute (now NREL).
REFERENCES Booten, C., Kruis, N., Christensen, C. 2012. Identifying and Resolving Issues in EnergyPlus and DOE-2 Window Heat Transfer Calculations. Golden, CO: National Renewable Energy Laboratory. NREL/TP-5500-55787. ASHRAE. 2011. ANSI/ASHRAE Standard 140-2011. Standard method of test for the evaluation of building energy analysis computer programs. Atlanta, GA: ASHRAE BEopt, 2014. https://beopt.nrel.gov/ Bland, B.H. 1992. Conduction in dynamic thermal models: analytical tests for validation. Building Services Engineering Research and Technology, 13 (4): 197–208. Bloomfield, D.P. 1999. Overview of validation methods for energy and environmental software. ASHRAE Transactions 105(2). CEN 2004. Thermal performance of buildings – calculation of internal temperatures of a room in summer without mechanical cooling – general criteria and validation procedures, EN ISO 13791, European Committee for Standardization, November 2004. Hendron, R., Engebrecht, C. 2010. Building America Research Benchmark Definition. Golden, CO: National Renewable Energy Laboratory. NREL/TP-550-47246. Irving, S.J. 1982. Energy program validation: conclusions of IEA Annex I. Computer-Aided Design 14 (1): 33–38. Jensen, S. Ø., 1995. Validation of building energy simulation programs; a methodology. Energy and Buildings, 22 (2), 133-134. Judkoff, R., et al. 1983. A methodology for validating building energy analysis simulations. Golden, CO: Solar Energy Research Institute (now NREL)
8 This report is available at no cost from the National Renewable Energy Laboratory (NREL) at www.nrel.gov/publications.