to classify and assess the condition of silicone rubber insulators using image .... temperature-vulcanizing (RTV) silicone rubber coating. Using the method ...
Using the Gray Level Co-occurrence Matrix to Improve the Swedish Hydrophobicity Class System Ibrahim Jarrar, Khaled Assaleh and Ayman H. El-Hag Department of Electrical Engineering American University of Sharjah, Sharjah, UAE judgment, several researchers have suggested the use of digital image processing (DIP) to analyze and measure the contact angle and hence evaluate the condition of the insulator. In [3] DIP has been used to calculate and evaluate the hydrophobicity of polymeric insulators. The suggested method utilizes human interference in specifying the region of testing and marking the area that contains the water droplets by extracting unrelated images’ backgrounds. The classification depends on the ratio of the area of the maximal water droplet divided by the area of the whole image. It also considers the shape coefficient of the maximal water droplet to measure the HC. Although this method is effective in online measurement of the insulator condition, it still depends on the interference of the operator in specifying the region of the image and removing the selected area’s background. The issue of human intervention is solved in [4] by creating an image processing algorithm that is based on extracting water droplets’ images from the background, fitting the water droplets’ contours using the orthogonal polynomial, and measuring the contact angle to estimate the insulator’s hydrophobicity. The main issue with this method is that it doesn’t apply to practical cases or to online evaluation of the insulator. A fixed rotation of 15° has been assumed for the water droplets and the droplet is considered to be in the middle of the insulator, which is not always the case. Also, the technique is based on a single droplet to evaluate the insulator rather than the practical case of several droplets of various sizes. In general, this method is applicable to certain and specific conditions and cannot be used to evaluate insulators in general. It is also a localized evaluation of the surface where the droplet resides and can’t be generalized to judge the whole insulator surface conditions. Several other researchers have used DIP to evaluate the HC of insulators [5-8]. Different techniques were implemented including circular factor, Hough transformation, segmentation, scaled entropy, histogram analyses, surface energy, textural analysis, and fractal dimension. While some researchers were successful in creating a mathematical relationship to the HC of the insulator, none of them were able to generalize a classifier. Recently, more than one feature such as area and shape have been combined together to overcome the shortage of utilizing a single feature [9], [10]. Utilizing several features to evaluate the condition of the insulator has eliminated the high error risk of making a single decision, poor reliability, and fault tolerance due to single-feature evaluation. Although these methods have enhanced the recognition rate, they are still not robust for evaluating the insulator in variable conditions. Their success depends on a specific arrangement
Abstract- The aim of this paper is to develop an automatic system to classify and assess the condition of silicone rubber insulators using image processing and pattern recognition techniques. In this research the gray-level co-occurrence matrices (GLCM) were used as an input feature vector for the classification system. Various classifiers were examined to evaluate the extracted features. The examined classifiers included k-nearest neighbor, neural networks, polynomial and linear classifiers. A database comprised of 358 images was collected and preprocessed representing the well-known seven hydrophobicity classes. A recognition rate of around 94% was achieved using GLCM as an input feature vector and classified by a neural network classifier.
I. INTRODUCTION Due to the importance of monitoring outdoor non-ceramic insulators aging condition, many utilities around the globe have developed several methods to evaluate insulators’ surface conditions. Most of these techniques depend on the observation of leakage current (LC) and partial discharge activities (PD) like infrared (IR) cameras, image intensifiers and current transformers (CT). Other techniques, such as contact angle measurements and hydrophobicity evaluation techniques are used to monitor the quality and the level of ageing in the polymer material [1]. Deterioration of the polymeric material is always accompanied with loss of its hydrophobicity. Hydrophobicity of the material is its ability to repel and resist water flow on its surface. When the surface of the insulator is hydrophobic, water droplets will form independent small droplets with contact angles >90°. When the surface of the insulator experiences ageing, this contact angle starts to decrease until the surface is completely hydrophilic and the water droplets transfer to water films. One of the techniques to measure hydrophobicity or the hydrophobicity class (HC) of nonceramic insulators (NCIs) is by measuring the contact angle. In this technique, water droplets are injected with a syringe and the contact angle of the droplet is measured on a flat surface. This method is only applicable in a laboratory environment and cannot be applied to field conditions. Another well-known measurement technique is by spraying a fine water mist on NCI insulators. Then, the surface can be classified from HC-1 (completely hydrophobic) to HC-7 (completely hydrophilic) [2]. The classes are determined based on the contact angle of the droplets and the size of the wetted area The main issue with this method is that it totally depends on human judgment. To overcome the subjectivity of human
135
of fixed distance, light level, and insulator position and shape. Any alteration of the experiment conditions would require a reconfiguration of the decision tree boundaries to correctly classify the insulator.
B. Database Preparation Since there are currently no such databases that represent the seven HC classes, a database of images was created for this purpose using the setup shown in Figure 3 followed by a series of image preprocessing steps. This database is comprised of 358 images representing the seven hydrophobicity classes with a minimum of 40 images per class. Since the color information is irrelevant for this application the images were converted to gray-scale images. Only a relatively small part of the image is needed; hence, a 480x480 pixel segment was cropped to represent each image. Figure 2 shows sample images of the collected database.
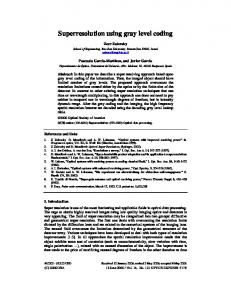
II. MATERIALS AND METHODS The objective of this research is to develop an online monitoring system to assess the condition of silicone rubber (SIR) insulators without the intervention of the operator. Figure 1 illustrates the various stages of the proposed system.
The image preprocessing steps were performed on the obtained images from the set up to enhance the relevant class information. The original RGB image acquired by the camera was downsized by a factor of 4 to reduce the storage computational complexity of the system since the high resolution of the acquired image is unnecessary for the application at hand. Further size reductions was done by cropping a square segment of size 480x480 pixels from the center of the image to remove any unneeded background objects in the image. The cropped images were then sharpened via a high pass filter, and their contrast levels were adjusted for better visual quality. Finally, the images were passed through a de-noising filter using Lucy-Richardson algorithm, followed by gray level adjustment based on an optimized threshold to enhance the textural information in the image needed for feature extraction. Figure 4 illustrates the preprocessing steps performed on each acquired image in the database. C. Feature Extraction In this research, the gray level co-occurrence matrix (GLCM) was used to extract the feature vector (FV). The GLCM is a method of analyzing the textural features of an image. By considering the spatial correlation between the images’ pixels, the GLCM returns what could be considered second-order statistical features. Based on the offset specified (distance and angle), the GLCM calculates how often a certain intensity level “i” co-occurs with an intensity level of a pixel with a “j” value. The fact that GLCM is considered as a statistical probability measurement of the gray-level variation between two intensity levels supports its effectiveness for extracting better features when applied to gray-level images directly. This is quite true, especially in this research, as the gray-level variances between the droplets indicate the size of the droplets or wetted areas and even the smoothness of their surfaces. The GLCM matrix can be considered a feature vector itself if the right gray level is used. D. Feature Selection Feature selection stage is often required to reduce the dimensionality of the feature vector. In this research, stepwise regression is used as a feature selection method. The stepwise regression helps in selecting the most contributing features to our model and hence helps reduce the size of the feature vector. Depending on the statistical significance of the features, the stepwise regression will discard the redundant or irrelevant features and the final FV will include the most
Figure 1. Proposed HC Classification System
A. Experimental Setup Samples used in this study were prepared using 10cm x 10cm ceramic tiles. The ceramic tiles were coated with a roomtemperature-vulcanizing (RTV) silicone rubber coating. Using the method suggested in [7], different hydrophobicity classes (HC), from class 1 to class 7 were obtained. The method suggests the use of distilled water and alcohol solutions to spray the coated samples. Alcohol solutions have lower surface tension reactions to coated surfaces, which makes the sprayed droplets react as if the surface is actually aged. Depending on the percentage of alcohol by volume (ABV) in the spraying solution, various HC classes can be obtained from class 1 with 0% ABV to class 7 with 100% ABV. Figure 2 demonstrates samples of the obtained HC images, using different ABV percentages. The experimental setup used in [11], shown in Figure 3, is adopted in this research for the purpose of acquiring the HC images. Spraying the solution mist can be done through a common spray bottle, or an automatic spraying system can be designed in a later stage as a part of an automated outdoor insulator inspection system as proposed in [11]. The prepared RTV coated tiles were sprayed with %ABV solutions for 1 minute to obtain the various HC images according to the STRI guide. Various %ABV solutions were prepared using a mixture of distilled water and surgical spirit that contained 68.6% ethyl alcohol and 3.7% methyl alcohol. More than 40 samples for each class were prepared. The tiles were placed at a 15 degree slope and at a distance of 400 cm from the camera. A FUJIFILM FINEPIX-JV200 camera was used [12].
136
distinguishing features. More details about stepwise regression can be found in [13].
were covered in the previous sections. In the classification stage, extracted features are mapped into the seven different classes. The choice of classifier depends on the features extracted in the previous stage. A post-processing stage may also be required to utilize the context, input depending information, improve the system performance, and reach the correct decision. In the next section, we will demonstrate the steps towards our final model while comparing and evaluating the classification results of various classifiers including, linear classifiers, polynomial, K-Nearest Neighbor (KNN), and Artificial Neural Network (ANN).
Figure 2. Samples of the Obtained Grayscale Database of the 7 HCs Using Different ABV% Solutions Figure 4. Image Preprocessing
III. RESULTS AND DISCUSSION Table 1 demonstrates the first comparison to obtain the best GLCM level to extract the most distinguishing textural features from the HC images. The setting of each GLCM matrix was fixed to a 00 direction with a distance of 1 pixel comparison distance to the neighborhood pixels. The results demonstrated in Table 2 suggest 94.15% using the ANN classifier and 92.98% using the KNN. The polynomial classifier performance was acceptable given the fact that all results demonstrated are after the application of the stepwise regression to remove the unrelated coefficients from the GLCM matrix.
Figure 3. Experimental Setup Used in Acquiring Various HC Images [11]
Table 2 demonstrates the effect of the GLCM directional angle while fixing the decomposition level to 8x8 and the pixel distance to 1. The angle has no significant effect in the textural analysis of the GLCM especially between the x and y axis directions due to the randomness of the droplet distributions.
A. Pattern Recognition System Pattern recognition (PR) is a mean of assigning objects or events to one of several pre-specified categories (classes) [14]. In this proposed system, the objects are the images of the insulators’ wetted surfaces, and the categories are the hydrophobicity classes. A typical PR system consists of the following stages as illustrated in Figure 5. The first four steps
137
IV. CONCLUSION In this research, the gray level co-occurrence matrix (GLCM) has been examined as a feature extraction method for insulators hydrophobicity class recognition. Stepwise regression was used as a method of feature selection and dimensionality reduction of the feature vector. The features are utilized using different classification techniques including linear classifiers, KNN, and ANNs. The best achieved recognition rate was 94.15% using a stepwise regression reduced feature vector comprised of an 8x8 GLCM at a zero angle and 1 pixel distance measurement. The classification was done based on a 3-layer ANN with 10 hidden neurons. Future work could study the effect of various factors such as weather conditions and contamination level on the performance of the proposed system.
Table 3 examines the setting of the best choice of pixel distance on an 8x8 GLCM with a zero angle direction. At the beginning, it seemed that the performance of the GLCM increased using the linear and polynomial classifiers when moving from a distance of 1 to 2 pixels. This was related to the reduction of the size of the FV after the stepwise regression as the number of zeros in the GLCM increased as well. The effect of increasing the pixel distance showed its effect when moving to the third pixel distance as the loss of the interclass distinguishing features came into effect. One of the most significant features in this research is the size of the droplets which is implied in the GLCM textural analysis. Increasing the pixel distance measurement setting has led to increasing the error rate especially between class 1 and 2 where the size difference between the droplets is slight. Table 1. Comparison of Various GLCM Levels GLCMGLCMGLCMClassifier Features 4x4 6x6 8x8 88.89% 90.64% 91.2% Linear Polynomial 2nd KNN:1 KNN:3 KNN:5 NN network (5 neurons) NN network (10 neurons) NN network (15 neurons)
REFERENCES GLCM10x10 91.23%
[1]
91.81%
91.81%
90.06%
88.9%
[2]
91.23% 90.64% 91.81% 90.64%
90.64% 90.06% 89.47% 91.81%
92.40% 90.64% 92.98% 90.64%
91.81% 91.81% 90.64% 89.47%
[3]
89.47%
90.64%
94.15%
88.9%
91.81%
90.64%
91.81%
91.23%
[4]
[5]
Table 2. Comparison of Various GLCM Directional Angles Classifier GLCM, 8x8, 450 GLCM, 8x8, 00 GLCM, 8x8, 900 Features 91.2% 91.2% 91.81% Linear Polynomial 2nd KNN:1 KNN:3 KNN:5 NN network (5 neurons) NN network (10 neurons) NN network (15 neurons)
90.06%
90.06%
88.9%
92.40% 90.64% 92.98% 90.64%
92.40% 90.64% 92.98% 91.81%
89.47% 89.47% 90.06% 90.64%
94.15%
92.98%
92.40%
91.81%
90.64%
91.23%
[6]
[7]
[8]
[9]
Table 3. Comparison of the Best GLCM Pixel Neighborhood Distance Classifier GLCM, 8x8, GLCM, 8x8, GLCM, 8x8, 00, d=3 Features 00, d=1 00, d=2 91.2% 91.81% 86.77% Linear Polynomial 2nd KNN:1 KNN:3 KNN:5 NN network (5 neurons) NN network (10 neurons) NN network (15 neurons)
90.06%
91.23%
88.9%
92.40% 90.64% 92.98% 90.64%
91.81% 90.64% 90.06% 91.81%
89.47% 90.64% 90.06% 88.9%
94.15%
89.47%
90.06%
91.81%
90.64%
88.9%
[10]
[11]
[12] [13]
[14]
138
I. Jarrar, A. El Hag and N. Qaddoumi, “Online techniques to detect defects in Non-Ceramic Insulators (NCI)”, GCC Cigre, Doha, Qatar, Nov-2010. STRI Guide: “Composite Insulator Status Program: Field inspection of composite insulators”, Guide 3, 98/1, 1998. X. Chen, C. Li, X. Huang, L. Zhao and W. Song, “On-line estimating the level of hydrophobicity of composite insulators using the digital images”, Proceedings of the Electrical Insulation Conference and Electrical Manufacturing Expo, pp. 216-221, 2005. Y. Liu et al, “A New Diagnosis Method on Insulators with Measuring Contact Angles,” International Journal of Intelligent Engineering and Systems, School of Electronic Information, Wuhan University, P.R. China,Vol.2, No.2,2009. B. X. Du and Yong Liu, “Pattern Analysis of Discharge Characteristics for Hydrophobicity Evaluation of Polymer Insulator,” IEEE Transactions on Dielectrics and Electrical Insulation, Vol. 18, No. 1; February 2011. M. Berg, R. Thottappillil and V. Scuka, “Hydrophobicity Estimation of HV Polymeric Insulating Materials: Development of a Digital Image Processing Method,” IEEE Transactions on Dielectrics and Electrical Insulation, Vol. 8 No. 6, December 2001. D. Thomazini, M. V. Gelfuso and R. Altafim, “Hydrophobicity Classification of Polymeric Materials Based on Fractal Dimension,” Materials Research, Vol. 11, No. 4, 415-419, 2008 T. Tokoro, Y. Omoto, Y. Katayama and M. Kosaki, “Image analysis of hydrophobicity and dielectric property of polymer insulating material,” IEEE 2002 Annual Report Conference on Electrical Insulation and Dielectric Phenomena S. Yi, L. Qin, T. Liangrui and Y. Qiuxia, “A Detection Algorithm of Hydrophobic Levels Based on Triangle Module Operator,” 2010 Seventh International Conference on Fuzzy Systems and Knowledge Discovery (FSKD), pp. 22-26, 2010. Y. Sun, Q. Li, L. Tang and Q. Yang, “The Fusion Estimating Algorithm of Hydrophobic Level Based on D-S Evidence Theory,” 2010 3rd IEEE International Conference on Broadband Network and Multimedia Technology (IC-BNMT), pp. 860-864, 2010. L. Khalayli, H. Sagban, H. Shoman, K. Assaleh and A. El-Hag, “Automatic Inspection of Outdoor Insulators using Image Processing and Intelligent Techniques” IEEE Electrical Insulation Conference (EIC 2013), Ottawa, Canada, June, 2-5, 2013. FINEPIX, JV 200 Series Owner Manual-01. [Online], Retrieved from http://www.fujifilm.com/products/digital_cameras/index.html R. Ghunem, K. Assaleh, and A. El-Hag, "Artificial neural networks with stepwise regression for predicting transformer oil furan content", IEEE Transactions on Dielectrics and Electrical Insulation, vol.19, no.2, pp.414,420, April 2012 R. Duda, P. Hart, D. Stork, Pattern Classification, Second Edition, 2000, John Wiley & Sons, Ltd.