www.nature.com/scientificreports
OPEN
received: 16 June 2016 accepted: 19 December 2016 Published: 24 January 2017
Using the MitoB method to assess levels of reactive oxygen species in ecological studies of oxidative stress Karine Salin1, Sonya K. Auer1, Eugenia M. Villasevil1, Graeme J. Anderson1, Andrew G. Cairns2, William Mullen3, Richard C. Hartley2 & Neil B. Metcalfe1 In recent years evolutionary ecologists have become increasingly interested in the effects of reactive oxygen species (ROS) on the life-histories of animals. ROS levels have mostly been inferred indirectly due to the limitations of estimating ROS from in vitro methods. However, measuring ROS (hydrogen peroxide, H2O2) content in vivo is now possible using the MitoB probe. Here, we extend and refine the MitoB method to make it suitable for ecological studies of oxidative stress using the brown trout Salmo trutta as model. The MitoB method allows an evaluation of H2O2 levels in living organisms over a timescale from hours to days. The method is flexible with regard to the duration of exposure and initial concentration of the MitoB probe, and there is no transfer of the MitoB probe between fish. H2O2 levels were consistent across subsamples of the same liver but differed between muscle subsamples and between tissues of the same animal. The MitoB method provides a convenient method for measuring ROS levels in living animals over a significant period of time. Given its wide range of possible applications, it opens the opportunity to study the role of ROS in mediating life history trade-offs in ecological settings. Over the last two decades evolutionary ecologists have shown a growing interest in the role of oxidative stress in shaping life-histories1–4. Oxidative stress occurs when the generation of reactive oxygen species (ROS) in an organism exceeds the capacity of its antioxidant defence and repair mechanisms to combat its effects, thereby causing the accumulation of oxidative damage5. Ecological studies investigating the effect of oxidative stress on life-histories have typically involved measurements of oxidative damage and/or the antioxidant system6–12. However, measurements of ROS have barely been attempted due to the complexity and specialized nature of the available methods. The vast majority of the ROS present in organisms are generated by the mitochondria13, and have traditionally been measured through in vitro assays of the rate of mitochondrial ROS production14. However, these assays measure mitochondrial ROS generated under highly artificial levels of oxygen and substrate availability15–17. Thus, there are significant limitations to extrapolating in vitro results to the in vivo situation18. In addition, in vitro assays require considerable expertise and laboratory facilities and must be conducted on fresh samples (to ensure that the mitochondria are functional), so virtually precluding assays of ROS in wild animals. Recently, Cochemé, et al.19 described an assay that measures ROS in living animals and offers the possibility to store samples prior to analysis, so finally overcoming the main limitations of in vitro assays. This method uses a newly-developed ratiometric probe, called MitoB, to measure levels of one major ROS, hydrogen peroxide (H2O2), within living animals19. When MitoB is administered to the living organism, it becomes concentrated in the mitochondria where it is converted by H2O2 into MitoP (Fig. 1). The selectivity of MitoB for mitochondrial H2O2 is based on the fact that it becomes almost entirely localized in the mitochondria because it is a lipophilic cation, and there it undergoes a specific reaction with H2O2 to give MitoP19, which chemically cannot be produced by other biological molecules (except peroxynitrite, which would reach mitochondria only under particular pathological circumstances20). Tissue samples from the animal can then be flash frozen for subsequent 1
Institute of Biodiversity, Animal Health & Comparative Medicine, University of Glasgow, UK. 2School of Chemistry, University of Glasgow, UK. 3Institute of Cardiovascular and Medical Sciences, University of Glasgow, UK. Correspondence and requests for materials should be addressed to K.S. (email:
[email protected]) Scientific Reports | 7:41228 | DOI: 10.1038/srep41228
1
www.nature.com/scientificreports/
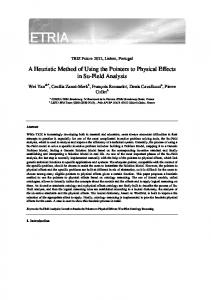
Figure 1. Schematic representation of the MitoB method. The animal is injected with the MitoB molecule. This becomes concentrated in the mitochondria, where it is converted to a stable alternative (MitoP) when reacting with hydrogen peroxide (H2O2), one major reactive oxygen species produced by the mitochondria. After an appropriate period of exposure (i.e. before the MitoB has all been excreted but after detectable amounts of MitoP have accumulated), samples are taken from the tissue(s) of interest; both MitoB and MitoP are then extracted, after having spiked the samples with known amounts of deuterium MitoB and deuterium MitoP (to determine extraction and quantification efficiency). The concentrations of MitoB, MitoP and their deuterated equivalents are determined by HPLC-MS, and the MitoP/MitoB ratio (the indicator of H2O2 levels) is calculated after taking account of any necessary correction factors. The dashed sections of the arrow represent the stages at which the protocol can be halted if samples are kept frozen. The diagram also indicates how each experiment described in the article address the assumptions of a particular step of the protocol; Step 4 tests whether there is any cross-contamination of MitoB or MitoP among individuals from the same water body (so validating its use in non-isolated aquatic animals).
extraction and quantification of the compounds MitoB and MitoP. The mitochondrial H2O2 level is then related to the proportion of MitoB that has been converted into MitoP, expressed as the MitoP/MitoB ratio (Fig. 1). A high MitoP/MitoB ratio indicates that the mitochondria have a high average level of H2O2 over the period of MitoB exposure; the ratio thus provides an estimate of the imbalance between the generation and scavenging of H2O2 in the mitochondria. Importantly, the conversion of MitoB to MitoP by H2O2 is about ten million times slower than the catabolism of H2O2 by the main mitochondrial peroxidase, so that MitoB does not alter physiological levels of H2O219. To date, this method has only been employed in a biomedical context using cultured cells and model organisms (fly Drosophila, worm Caenorhabditis elegans and laboratory mouse Mus musculus18,19,21,22), with the sole exception of our recent study using a species of fish, the brown trout Salmo trutta23. The MitoB method appears to be applicable to various animal models. However, several of the steps in the MitoB protocol need to be validated before it can be used in a broader range of species and contexts (in particular, its potential for use in the natural population). The aim of this article is to provide a detailed description of how to develop the MitoB protocol in organisms for which the method has never been applied before, with a general focus on issues that are likely to face ecologists and evolutionary biologists working on oxidative stress. We illustrate this by demonstrating how the protocols established for Drosophila by Cochemé, et al.21 had to be validated and extended for a new model, in our case brown trout23. Our previous paper showed that the MitoB method can be used in fish to study the relationship between mitochondrial ROS and metabolic rate23. Now, we explain in detail how the method was optimized for this new species, and also provide guidance on adapting this useful approach to other organisms in ecological studies. The steps needed to develop the MitoB method in a new organism were to (1) Establish the kinetics of the MitoB and MitoP compounds; (2) Verify whether the MitoP/MitoB ratio is consistent within and among tissues
Scientific Reports | 7:41228 | DOI: 10.1038/srep41228
2
www.nature.com/scientificreports/ of an individual; (3) Determine whether exposure duration and initial concentration of MitoB affect MitoP/ MitoB ratios; (4) Test whether the MitoB and MitoP molecules can transfer between fish and water, and so potentially between fish living in the same water body. By doing so, we establish that the method is suitable for aquatic organisms and for use in ecological studies of oxidative stress.
Experiments and Results
Step 1: Measurement of the time-course of MitoB and MitoP compounds in the animal. MitoB
is slowly converted into MitoP, while MitoB and MitoP compounds are progressively excreted by the animal21, but the rates of conversion and excretion may differ between animal models. Thus, an important step is to measure the time-course of the MitoB and MitoP compounds in each new organism model to determine the appropriate exposure duration of MitoB: a sufficient time has elapsed when detectable amounts of MitoP have accumulated yet sufficient MitoB still remains in the animal21. Moreover, it is necessary to confirm that the rate of disappearance is similar between MitoB and MitoP so that the ratio of these compounds is not altered by differential kinetics of the two molecules. To assess the time course of the two compounds in trout, some fish received an injection of MitoP (50 nmol/fish, n = 20 fish) while others were injected with MitoB (50 nmol/fish, n = 20 fish). The rate of disappearance of MitoB and MitoP in the fish was assessed by recording the amount of MitoB or MitoP still present in a liver sample 3 h, 12 h, 24 h, 48 h and 72 h post-injection (n = 4 fish per time point). Statistical procedures were performed using IBM SPSS Statistics 22 (SPSS Inc., Chicago, IL, USA). There was no detectable difference between MitoB and MitoP in their rate of disappearance from the liver (MitoB = −15.21 ± 9.87 pmol h−1; MitoP = −6.51 ± 9.80 pmol h−1; F1, 34 = 0.391, P = 0.536) after controlling for effects of the mass of liver used for the extraction of Mito compounds (F1, 34 = 0.238, P = 0.023). These results suggest that the MitoP/MitoB ratio in trout is unlikely to be affected by differential rates of disappearance of the two molecules, at least over the 72 h period covered by this trial. Moreover, the probe appears to accumulate rapidly within the tissues, as indicated by the large amount of MitoB present in the liver within 3 hours of injection (Table S3). MitoP was already detectable in some individuals 3 hours after injection with MitoB. However, in some cases MitoP was detected by the HPLC-MS but levels were still too low after 24 h to be accurately quantified (i.e. below the reliable detection limit of the HPLC-MS; Table S3). Finally, our results reveal that MitoB was still at high levels in the fish (i.e. had not all been excreted or converted to MitoP) 72 h after injection (Table S3). The sample size in the time course of MitoB experiment (n = 4 per time point) did not allow us to test conclusively as to whether the time-normalized MitoP/MitoB ratio remained constant over time. Thus, the exposure duration was set just above 24 h (range from 26 h to 29 h – see step 3 for discussion on effect of precise exposure duration on MitoP/MitoB ratio) for the rest of the study.
Step 2: Determination of within- and between-tissue variation in MitoB and MitoP content and MitoP/MitoB ratio. In order to evaluate whether the H2O2 level, estimated as the MitoP/MitoB ratio, is
consistent within a tissue and within an organism, liver and white muscle were sampled simultaneously from 20 fish exposed to MitoB for 26 h (26.15 ± 0.02 h), with two aliquots from each tissue being flash-frozen for separate extraction of compounds. White muscle was taken dorsally to the lateral line (to avoid contamination with red fibres) and just behind the caudal fin; one aliquot was collected from one side of the fish while the other aliquot was collected from the other side. Intra-class correlation coefficients (ICC) were used to test for the consistency of the quantification of the compounds between the two measures from the same tissue extract. The consistency was calculated using a two-way mixed effect ICC with an absolute agreement definition of concordance. This type of ICC was employed for all ICC used in our study as it assesses not only the correlation but also the exact similitude between measurements. The consistency of the MitoP/MitoB ratio between two subsamples from the same individual was high for the liver (ICC r = 0.785, P = 0.001), but not for the white muscle (ICC r = 0.007, P = 0.486). White muscle showed a significantly higher average MitoP/MitoB ratio than the liver within individuals (0.266 ± 0.028 and 0.073 ± 0.008 respectively, paired t test: t = 6.711, df = 19, P