Using the SMiLE Monitoring Infrastructure to Detect and Lower the Inefficiency of Parallel Applications Jie Tao ? , Wolfgang Karl, and Martin Schulz LRR-TUM, Institut f¨ur Informatik, Technische Universit¨at M¨unchen, 80290 M¨unchen, Germany E-mail: ftao,karlw,
[email protected]
Abstract. High computational demands are one of the main reasons for the use of parallel architectures like clusters of PCs. Many parallel programs, however, suffer from severe inefficiencies when executed on such a loosely coupled architecture for a variety of reasons. One of the most important is the frequent access to remote memories. In this article, we present a hybrid event-driven monitoring system which uses a hardware monitor to observe all of the underlying transactions on the network and to deliver information about the run-time behavior of parallel programs to tools for performance analysis and debugging. This monitoring system is targeted towards cluster architectures with NUMA characteristics.
1 Introduction Parallel processing is a key technology both for commercial and scientific applications. Besides traditional multiprocessor and multicomputer systems, clusters of PCs are gaining more and more acceptance. Due to the synchronization and communication between processes as well as unbalanced allocation of processors, however, the parallel performance is often not as excellent as expected. This situation is more serious in fine-grained parallel systems due to the management and organization overhead. In order to obtain high system performance, it is therefore necessary to develop tools which will improve the locality of memory references and balance the load distribution among processors. Growing complexity of hardware, however, makes performance evaluation and characterization more difficult. This is especially true for PC-Cluster with DSM character as in those systems any communication is handled implicitly without the ability for a direct observation. The challenge is to design a powerful performance monitoring framework, which is able to deliver detailed information about the run-time communication behavior and to help the run-time system make correct decisions concerning the partitioning and redistribution of data and threads. Such a monitoring infrastructure has been developed for the SMiLE (Shared Memory in a LAN-like Environment) project at LRR-TUM. The SMiLE project [2,9] investigates in high performance cluster computing. As the limited communication performance over standard LANs restricts performance of parallel applications, the high-speed low-latency Scalable Coherent Interface(SCI) [1,5] ? Jie Tao is a staff member of Jilin University of China and is currently pursuing her Ph.D at
Technische Universit¨at M¨unchen of Germany
is taken as interconnection technology. With hardware Distributed Shared Memory (DSM) and high performance communication characteristics SCI-based PC clusters are very suitable for High Performance Computing (HPC). Otherwise, fast data access and communication among cooperating threads within applications requires detailed information about the behavior of the system. Monitoring the dynamic behavior of a compute cluster with hardware-supported DSM like the SMiLE PC cluster, however, is very challenging as communication might occur implicitly on any read or write. This fact implies that monitoring must be very fine-grained, making it almost impossible to avoid significant probe overhead with software instrumentation. A hardware monitor is needed. The SMiLE hardware monitor provides the programmer or the system software with detailed information about any memory transactions on the network and the occurrence of user-defined events. With this information, the user or the system software is able to determine why a program runs slowly and how data and threads should be partitioned or redistributed. The hardware monitor, however, is not at its final stage. Performance tools must be developed which will analyze the observed behavior and manipulate the applications in order to achieve a more efficient execution. Based on a tight cooperation between monitor and tools, memory locality will be improved and load balancing mechanisms will be implemented. This article presents the design of the overall system. The remainder of this paper is organized as follows. In Section 2 the SMiLE hardware monitor will be introduced, followed by an experimental evaluation using a few typical DSM applications in Section 3. The monitor infrastructure is then described in Section 4. Finally, we conclude in Section 5 with a short description of related work and a brief summary.
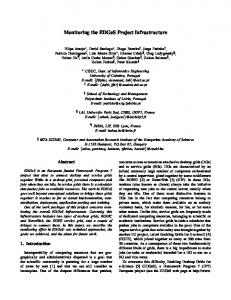
2 The SMiLE SCI Hardware Monitor The SMiLE cluster consists of a number of PCs connected via SCI to a parallel system with NUMA characteristics (Non-Uniform Memory Access). Each node is equipped with a PCI-SCI adapter which can be attached by a hardware monitor. The node architecture of the SMiLE PC cluster is shown in Fig. 1. The PCI-SCI adapter, described in detail in [2], serves as an interface between the PC’s I/O bus and the SCI interconnection network. Like any other available PCI-SCI adapter the SMiLE PCI-SCI adapter consists of three logical parts: a PCI unit which interfaces to the PCI local bus, a Dual-Ported RAM (DPR) in which the incoming and outgoing packets are buffered, and an SCI unit which interfaces to the SCI network and performs the SCI protocol processing for packets. The PCI unit is connected to the DPR via the DPR bus and the SCI unit via the B-Link. Here, the B-Link, a 64-bit-wide synchronous bus, serves as the carrier of all incoming and outgoing packets to and from the SCI interface. Control information is passed between the PCI unit and the SCI via a handshake bus. The SMiLE hardware monitor [6,8] as part of the event-driven hybrid monitoring approach is attached to the PCI-SCI adapter as an additional PCI card. As shown in Fig.1, it consists of three modules: B-Link interface, counter module, and PCI interface. The B-Link, a central point on which all remote memory accesses can be monitored,
PCI/SCI adapter
A
32
D
PCIbridge
Hardware Monitor PCI interface
main memory
B-Link D
SCI in
64
ribbon cable
processor/ cache
A
DPR
SCI out SCI unit
PCI unit
PCI
handshake bus
SCI network fabric
B-Link interface
counter modul associative static counter counter array array
event filter
Fig. 1. The SMiLE SCI node architecture: a PCI-SCI adapter and the hardware monitor card installed in a PC
is designed to acquire information from packets through the B-Link. The information includes: transaction command (read, write, lock, unlock), source and destination IDs, memory address (page number and offset), and other characters (incoming, outgoing, response, and request). As part of the hardware monitor, the counter module is responsible for the recording of the monitoring results. Its three components – an event filter, a static counter array, and an associative counter array – allow the programmer to utilize it in two working modes for performance analysis: the static and the dynamic mode. The static mode allows users to explicitly program the hardware for event triggering and action processing on definable SCI regions. This can be used to monitor given data structures or parts of arrays and will likely be applied in combination with language specific profiling extensions for detailed studies. Here, the event filter is used to allow the programmer to define events and the static counter array is used to record the frequency of events. The event filter comprises a page table and an event station. The descriptors of all pages to be observed by the hardware monitor in a node are stored in the page table. The accurate events, which specify packets including data from certain data structures or arrays, are described in the event station. The event station’s page frame field points to a page descriptor in the page table while the bottom and the top address fields specify the range within the indexed page. The transaction type describes the relevant operation to that page. The event selector is used to decide when to begin and to end the monitoring of an event. The counter is used to count the event. When the information about a packet arrives from the B-Link interface, first the page number and destination ID will be compared with the page number and node number in the page table. With
the index of the page table the corresponding entries of the event station are checked. If the event matches one of the count events defined by the programmer (and the event has been previously enabled), the corresponding counter is incremented. The programmer can also specify events in their programs to enable or disable the counting of an event defined in the event station. In case a counter overflow, its value will be spilled to a user-defined ring-buffer, which is also used by the dynamic mode. The dynamic working mode is designed to deliver detailed information to tools for performance evaluation. In this mode, all packets passing the B-Link will be monitored. In order to be able to record all remote memory accesses to and from a node with only limited hardware resources, the monitor exploits the spatial and temporal locality of data accesses in a similar way as cache memories do. The hardware monitor contains a content-addressable counter array managing a small working set of the most recently referenced memory regions. If a memory reference matches a tag in the counter array, the associated counter is incremented. If no reference is found, a new counter-tag pair is allocated and initialized to 1. If no more space is available within the counter array, first counters for neighboring address areas are merged or a c ounter-tag pair is flushed to a larger ring buffer in main memory. This buffer is repeatedly emptied by the system software in a cyclic fashion. In the case of a ring buffer overflow, a signal is sent to the software process urging for the retrieval of the ring buffer’s data. With typical PC I/O bandwidths of around 80 MB/s (PCI’s bandwidth of 133 MBytes/s can only be reached with infinite bursts), monitoring represents a more 0.8% of the system’s bus load and shouldn’t influence program execution too much.
3 First Results from the Memory Behavior Tests Using the SMiLE Monitor We have noticed that some parallel applications don’t run efficiently upon our SMiLE cluster due to too many remote memory accesses [14]. In order to understand the memory behavior of parallel programs in detail we have tested a few applications from the SPLASH-2 benchmarks suite [16]. As the physical implementation of the hardware monitor is currently under development, a simulator of the hardware monitor and its appropriate driver have been implemented. The simulator is based on the multiprocessor memory system simulator Limes [10], which allows to produce a trace file during the simulation of the parallel execution of an application. The trace file contains all packets which are transfered in the case that the application runs natively on an SCIbased cluster. The monitor simulator reads the trace file and treats every packet in the same way as a hardware implementation would. The monitoring results are collected by the driver and offered to the user. Fig. 2 and Fig. 3 provide a few examples of such statistics of the memory behavior of the FFT, LU, RADIX and OCEAN programs of the SPLASH-2 suite [16]. The results indicate that each page has a different access behavior. Some pages are accessed much more frequently by local processor while some ones are accessed more often by remote ones. There are also pages which are accessed evenly by all of the processors. The tests also reveal that for each application the remote memory accesses take a great proportion of all memory transactions. For FFT, e.g., among the total 93372
Number of Memory Accesses
50000
8000 7000 6000 5000 4000 3000 2000 1000 0
node1 node2 node3 local
FFT
LU
RADIX
OCEAN
Fig. 2. The number of memory accesses of a single page on node 0 related to different applications
memory accesses to shared data by all of the four nodes the remote ones are 48139 times, i.e. 51.6% of the total accesses. For the LU program, the ratio of remote accesses to total ones is even 79.1% (4415847 remote, 5582318 total).
4 The Software Infrastructure of the Monitoring System The results shown above dramatically demonstrate the necessity of memory locality optimization. In addition to a tool for this task, other tools like a dynamic load balancer are necessary to reach a close to optimal parallel execution. The locality optimizer needs information about memory behavior from the hardware monitor and the load balancer
page 0
1
2
3
4
5
6
7
8
1
13890
0
0
36676
17011
58154
7489
71522
1924
2
14945
0
0
47974
19473
69568
9902
91510
3
16269
0
0
32931
63486
17209
77154
local
71900
0
0
34832
51884
20496
65568
9
10
11
81469
0
442
2343
102254
0
13
6896
87099
511
89273
9
10256
74556
4112
79192
16
source
Fig. 3. The number of memory accesses of all different pages of LU on node 0
needs the CPU states of the processors from the operating system, etc. These tools work sometimes simultaneously and the communication among them is also at times necessary. Therefore, an interface must exist to connect the tools together and the tools with the low-level environment together. OMIS/OCM is just such an interface allowing the safe interoperability between arbitrary OMIS compliant tools. The OMIS(On-line Monitoring Interface Specification) [4] project at LRR-TUM provides the basis to integrate individual tools and the low layers of the computers into a single environment. OCM [15], an OMIS Compliant Monitoring system is a standardized interface which allows different research groups to develop tools that can be used concurrently with the same program. The OMIS/OCM system has two interfaces: one for interaction with the different tools, the other for interaction with the program and all system underlying layers which keep the program running. The interaction between tools and OMIS/OCM system is handled via asynchronous procedure calls. The tool invokes a service request and either waits for results coming back from the OMIS/OCM system or specifies a call-back to be invoked when results are available. OMIS/OCM provides means to extend these interfaces.
Memory Locality Optimizer
Load Balancer
......
Tools Tool/OMIS Interface
Tool Extension
Hardware with SCI Interconnect
SMiLE-Monitor
SCI-VM
OMIS SCI-DSM Extension
SyncMod
Parallel Applications
Program Extension
OMIS / OCM core OMIS/SCI Monitor Interface Low-level Environment
Fig. 4. The Software Infrastructure of the Monitoring System
With OMIS/OCM we have designed a whole monitoring infrastructure which is shown in Fig.4. This infrastructure consists of three main components: Tools, OMIS/OCM, and a Low-level Environment. As described above, the tools need information about the low-level environment such as node status and memory access behavior etc., which will be offered by the SMiLE-HW monitor, the program code, libraries, and the operating system. These are summarized as the Low-level Environment.
The information delivered from the SMiLE hardware monitor is purely based on physical addresses and does not suffice for the evaluation of applications. In order to make the information readable from the application level the translation of physical addresses seen by the monitor into virtual addresses visible from the application level must be realized. The translation of virtual addresses into physical address, on the other hand, also has to be supported as any event definition for the hardware monitor requires physical addresses. This translation is controlled by the DSM layer, in this case the SCI Virtual Memory(SCI-VM) [13]. This layer extends the virtual memory management of the operating system to a cross-node memory resource control and is responsible for setting up the correct virtual address mappings to both local and remote memory. It therefore is able to directly provide the required information to the monitor system and also the information which aid in the performance evaluation of applications. While the hardware monitor lacks the ability of monitoring synchronization primitives, which generally have a critical performance impact on shared memory applications, the SyncMod module delivers various statistical information. This ranges from simple lock and unlock counters to more sophisticated information like mean and peak lock times and peak barrier wait times. This information will allow the easier detection of bottlenecks in applications. To connect the Low-level Environment with OMIS/OCM system so that the observed information about system behavior can be delivered to various envisioned tools an OMIS SCI-DSM Extension is needed that is responsible for the realization of all the service requests related to hardware monitor, for the address translation in both directions, and for supplying the information about synchronization primitives. Another module, the Program Extension is responsible for abstracting the virtual addresses from the symbol-table of the compiler. Although the user can utilize the monitor information to optimize execution of their applications it is also important and necessary to develop tools to improve the efficiency of parallel programs transparently. From the results of the tests described in section 3 we notice that it is necessary to redistribute the data among processors in order to decrease the effect of remote memory accesses. A special tool for this purpose, a Memory Locality Optimizer, is currently under development. The Memory Locality Optimizer focuses on an optimization that can significantly reduce remote data accesses in DSM system. The performance of a parallel system with DSM character depends on the efficient exploitation of memory locality. Although remote memory accesses via hardware-supported DSM deliver high communication performance compared to traditional systems, they are still an order of magnitude more expensive than local ones. Therefore, powerful tools have to be introduced to exploit data locality. The Locality Optimizer consists of a decision-making subsystem and a data- and thread-migration subsystem. The first subsystem analyzes all memory transactions in order to recognize which part of the global memory is accessed frequently by which thread. Based on this analysis and also based on information available from the compiler, the user, the SCI-VM, and the synchronization system, it decides which page or thread should be moved. The migration subsystem will then automatically and transparently migrate data and threads at run-time. In this case the communication among parallel threads will be minimized.
In the following a few strategies that aid in partitioning and redistribution of data and threads are introduced: 1. Two or more logically unrelated data objects that are used by different application components (threads) should not be placed on the same page. 2. A page that is accessed frequently from a single remote thread but rarely from others should be migrated to node executing this thread. However, when local threads also access this page frequently then the page should not be migrated and it will be taken into consideration whether the remote thread should be moved to the node on which the page is located. 3. A page that is accessed often by more than one thread can be: a) distributed among threads with that each threads has only a part of this page in its local memory; or b) placed only in one memory; or c) replicated onto all nodes. In the late case additional consistency enforcing mechanisms have to be introduced. 4. A thread which access only different pages of a memory on a processor frequently should be migrated onto this processor. Each node of the cluster executes a Memory Locality Optimizer which is in charge of counting the accessed frequency of every active local page. For the LU program in the SPLASH-2 suite, for example, if page 9 in node 0 is moved to node 2 instead staying on node 0, the remote memory accesses of node 2 to node 0 would be lowered for 35.5% while the remote accesses of node 0 would be increased only for 0.1%. Good locality, however, is not the sole property needed to achieve optimal performance, load balancing is of equal importance. Another tool, the Load Balancer is therefore also being developed at LRR-TUM for the SMiLE project. This tool is used to increase the utilization of system resources and improve the performance by balancing the load. The main goal is to split the work evenly among all processors. It consists of two parts: a static and a dynamic load distribution mechanism. The static mechanism is responsible for the initial assignment of load, i.e., finding the most appropriate processor for a being created parallel thread according both to the varying system capabilities and the application varying needs, while the dynamic one deals with the load redistribution after startup, i.e., transferring load from an overloaded host to an idle or an underloaded one. Static load distribution strategies are only effective when applied to problems that can be partitioned into tasks with uniform computation and communication requirements. There exist, however, a large number of problems with non-uniform and unpredictable computation and communication requirements. Therefore, it is essential that a DSM system is adaptive to dynamic changes in the environment and is able to respond to varying needs of an application by adopting dynamic load distribution mechanisms. Dynamic load distribution mainly means thread migration, but this work must be done with the consideration of data locality as there is a potential conflict between data locality and load balancing. The threads that are chosen to be migrated by the load balancing policy must be selected with care, in order to minimize the resulting remote memory accesses. The destination of the migration must be also considered carefully and the choice of the most lightly loaded processor is not sufficient as improper placement of threads might degrade performance due to the high communication overhead.
In order to connect tools by OMIS/OCM, the Tool Extension module must be defined adding a description of the new service requests of the tools into OMIS/OCM system.
5 Related Work and Conclusion Over the last years, monitoring support has become increasingly available on research as well as on commercial machines. The SHRIMP hardware performance monitor has been developed to measure the running behavior of the SHRIMP PC cluster, which is connected with special network adapters capable of performing remote updates [12]. In contrast to our hybrid hardware monitor, it has a DRAM in the monitor card to record the complete access histograms and run-time measurements of running applications. Similar to the SMiLE approach, these measurement can be used to modify mutable parts of the system hardware and to help with software development and application tuning. Trinity College Dublin has designed a trace instrument for SCI-based systems [11] that allows full traces of interconnect traffic. This instrument provides hardware designers and software developers with a tool that allows a deeper understanding of the temporal behavior of their hardware and software. In contrast to the SMiLE monitoring system, however, this trace environment can not be used for on-line tools due to the large amount of trace data. Tool environments for DSM-oriented systems, however, are less wide-spread [3,7]. On-line tools based on hardware monitors with the purpose to improve system performance have, to our knowledge, not yet been presented. We believe that performance data provided by a hardware monitor should not only be utilized by programmer or offline tools to the analyzation of system performance, but also by on-line tools to enable the run-time manipulation of parallel executions. Data migration based on observed memory transactions, for example, can improve the performance of an application dramatically. The combination of the hardware monitor and on-line tools therefore offer a great potential for High Performance Computing.
References 1. IEEE Standard for the Scalable Coherent Interface(SCI). IEEE Std 1596-1992,1993, IEEE 345 East 47th Street, New York, NY 10017-2394, USA. 2. G. Acher, W. Karl, and M. Leberecht. PCI-SCI protocol translations: Applying microprogramming concepts to FPGAs. In Proceedings of the 8th International Workshop, FPL’98, volume 1482 of Lecture Notes in Computer Science, pages 238–247, Tallinn, Estonia, September 1998. Springer Verlag, Heidelberg. 3. D. Badouel, T. Priol, and L. Renambot. A performance tuning tool for DSM-based parallel computers. In Proceedings of Europar’96-Parallel Processing, volume 1123 of Lecture Notes in Computer Science, pages 98–105, Lyon, France, August 1996. Springer Verlag. 4. M. Bubak, W. Funika, R. Gembarowski, and R. Wism¨uller. OMIS-compliant monitoring system for MPI applications. In Proc. 3rd International Conference on Parallel Processing and Applied Mathematics - PPAM’99, pages 378–386, Kazimierz Dolny, Poland, September 1999.
5. Hermann Hellwagner and Alexander Reinefeld, editors. SCI: Scalable Coherent Interface: Architecture and Software for High-Performance Computer Clusters, volume 1734 of Lecture Notes in Computer Science. Springer-Verlag, 1999. 6. R. Hockauf, W. Karl, M. Leberecht, M. Oberhuber, and M. Wagner. Exploiting spatial and temporal locality of accesses: A new hardware-based monitoring approach for DSM systems. In Proceedings of Euro-Par’98 Parallel Processing / 4th International Euro-Par Conference Southampton, volume 1470 of Lecture Notes in Computer Science, pages 206–215, UK, September 1998. Springer Verlag. 7. Ayal Itzkovitz, Assaf Schuster, and Lea Shalev. Thread migration and its applications in distributed shared memory systems. The Journal of Systems and Software, 42(1):71–87, July 1998. 8. Wolfgang Karl, Markus Leberecht, and Martin Schulz. Optimizing data locality for SCIbased PC-clusters with the SMiLE monitoring approach. In Proceedings of International Conference on Parallel Architectures and Compilation Techniques(PACT ’99), pages 169– 176, Newport Beach, CA, October 1999. IEEE Computer Society. 9. Wolfgang Karl, Markus Leberecht, and Martin Schulz. Supporting shared memory and message passing on clusters of PCs with a SMiLE. In Proceedings of the third International Workshop, CANPC’99, volume 1602 of Lecture Notes in Computer Science, Orlando, Florida, USA(together with HPCA-5), January 1999. Springer Verlag, Heidelberg. 10. D. Magdic. Limes: An execution-driven multiprocessor simulation tool for the i486+–based PCs. School of Electrical Engineering, Department of Computer Engineering, University of Belgrade, POB 816 11000 Belgrade, Serbia, Yugoslavia, 1997. 11. Michael Manzke and Brian Coghlan. Non-intrusive deep tracing of SCI interconnect traffic. In Conference Proceedings of SCI Europe’99, pages 53–58, Toulouse, France, September 1999. 12. M. Martonosi, D. W. Clark, and M. Mesarina. The SHRIMP performance monitor: Design and applications. In Proc. SIGMETRICS Symposium on Parallel and Distributed Tools, pages 61–69, Philadelphia, May 1996. 13. M. Schulz. SCI-VM: A flexible base for transparent shared memory programming models on clusters of PCs. In Proceedings of HIPS’99, volume 1586 of Lecture Notes in Computer Science, pages 19–33, Berlin, April 1999. Springer Verlag. 14. Martin Schulz and Hermann Hellwagner. Global virtual memory based on SCI-DSM. In Proceedings of SCI-Europe ’98, pages 59–67, Bordeaux, France, September 1998. Cheshire Henbury. 15. R. Wism¨uller. Interoperability support in the distributed monitoring system OCM. In Proc. 3rd International Conference on Parallel Processing and Applied Mathematics - PPAM’99, pages 77–91, Kazimierz Dolny, Poland, September 1999. 16. Steven Cameron Woo, Moriyoshi Ohara, Evan Torrie, Jaswinder Pal Singh, and Anoop Gupta. The SPLASH-2 programs: Characterization and methodological considerations. In Proceedings of the 22nd Annual International Symposium on Computer Architecture, pages 24–36, June 1995.