Korean J. Chem. Eng., 29(7), 891-902 (2012) DOI: 10.1007/s11814-011-0269-0
INVITED REVIEW PAPER
Hydraulic characteristics analysis of an anaerobic rotatory biological contactor (AnRBC) using tracer experiments and response surface methodology (RSM) Yadollah Mansouri*, Ali Akbar Zinatizadeh** , Parviz Mohammadi***, Mohsen Irandoust****, Aazam Akhbari**** *****, and Reza Davoodi****** ,†
,
*Young Researchers Club, Ilam Branch, Islamic Azad University, Ilam, Iran **Water and Wastewater Research Center (WWRC), Department of Applied Chemistry, Faculty of Chemistry, Razi University, Kermanshah, Iran ***Department of Environmental Health Engineering, Kermanshah Health Research Center (KHRC), Kermanshah University of Medical Sciences, Kermanshah, Iran ****Department of Analytical Chemistry, Faculty of Chemistry, Razi University, Kermanshah, Iran *****Sama Technical and Vocatinal Training College, Islamic Azad University, Kermanshah Branch, Kermanshah, Iran ******Kermanshah Water and Wastewater Company, Kermanshah, Iran ( ) Received 19 June 2011 • accepted 15 October
Abstract−The hydraulic characteristic of an anaerobic rotating biological contactor (AnRBC) were studied by changing two important hydraulic factors effective in the treatment performance: the hydraulic retention time (τ) and rotational disk velocity (ω). The reactor hydraulic performance was analyzed by studying hydraulic residence time distributions (RTD) obtained from tracer (Rhodamine B) experiments. The experiments were conducted based on a central composite face-centered design (CCFD) and analyzed using response surface methodology (RSM). The region of exploration for the process was taken as the area enclosed by τ (60, 90 and 120 min) and ω (0.8 and 16 rpm) boundaries. Four dependent parameters, deviation from ideal retention time (∆τ), dead volume percentage and dispersion indexes (Morrill dispersion index (MDI) and dispersion number (d)), were computed as response. The maximum modeled ∆τ and dead volume percentage was 43.03 min and 37.51% at τ and ω 120 min and 0 rpm, respectively. While, the minimum predicted responses (2.57 min and 8.08%) were obtained at τ and ω 60 min and 16 rpm, respectively. The interaction showed that disk rotational velocity and hydraulic retention time played an important role in MDI in the reactor. The AnRBC hydraulic regime was classified as moderate and high dispersion (d=0.09 to 0.253). As a result, in addition to the factors studied, the reactor geometry showed significant effect on the hydraulic regime. Key words: Anaerobic Rotatory Biological Contactor, Hydraulic Characteristics, Tracer Experiment, Response Surface Methodology
INTRODUCTION
mance, determination of hydraulic characteristic is of great importance. Poor hydraulic conditions reduce the HRT and effective volume, resulting in lower removal efficiencies of the bioreactor. The presence of a good design model for the RBC reactor is a useful tool for describing and predicting the RBC hydraulic regime [4-6]. There are several examples of tracer tests being used to indicate the presence of short circuiting streams and dead volume in different reactors. Hydraulic characterization is performed by a retention time distribution (RTD) curve [7-11]. Not many tracer studies have been done on the hydraulic characteristics of the RBC reactor, but a few quantitative models have been proposed [12-16]. In all these models, there is no common agreement on whether an RBC behaves as a plug-flow or a completely mixed reactor. Various indexes have been used to describe the mixing and hydraulic flow pattern in the different operational units. These are Morrill (MDI), Peclet, dispersion (d) numbers etc [1-3]. Non-ideal flow models such as the tankin-series (TIS) model and dispersion plug flow (DPF) model are used to describe the hydraulic flow pattern of an anaerobic baffled reactor (ABR) [17]. Today, improvements in computer and computational technology and the development of a new generation of highly efficient computer programs like computational fluid dynamic (CFD) analysis
The hydraulic behavior in biological reactors is of fundamental importance for the efficiency of wastewater treatment processes. Examples of hydraulic phenomena with adverse impacts on the bioreactors performance include short circuiting streams and dead volumes. The unfavorable hydraulic situations in the bioreactors may cause lower process performance and thus higher residual concentrations in the treated water. This may be particularly significant in high loaded bioreactors and anaerobic RBC reactors [1,2]. Owing to a lack of appreciation for the hydraulics of reactors, many of the treatment plants that have been built do not perform hydraulically as designed. Comparison of actual hydraulic characteristics of a reactor measured using tracers, to the expected theoretical response can be used to assess the degree to which the ideal design has been achieved [2,3]. Anaerobic rotating biological contactors (AnRBCs) offer an alternative treatment technology to the conventional anaerobic digester. Because of the widespread use of RBCs in recent years, and because the reactor hydraulics directly affects the treatment perforTo whom correspondence should be addressed. E-mail:
[email protected],
[email protected] †
891
892
Y. Mansouri et al.
have made it possible to show the inside dynamic flow situation in structures such as clarifiers and activated sludge reactors [18,19]. Response surface methodology (RSM) is a collection of statistical and mathematical techniques useful for the process modeling and optimizing. This methodology is more practical compared to the other approaches as it arises from experimental methodology, which includes interactive effects among the variables and, eventually, it depicts the overall effects of the parameters on the process [20]. In an earlier work published elsewhere [21], we found that low hydraulic retention time (τ) and disk rotational velocity (ω) had an adverse impact on the process performance. Hence, in the present study, in order to explore the best operational conditions achieving a high hydraulic performance in an anaerobic RBC, the interactions among two effective variables (τ, ω) as well as their direct impacts on the hydraulic regime of the AnRBC were investigated. The responses (deviation from ideal retention time (∆τ), volume of dead space and dispersion indexes (MDI and d)) were determined using the data obtained from the tracer experiments, and the hydraulic characteristics were analyzed and modeled by RSM.
MATERIALS AND METHODS 1. Bioreactor Configuration
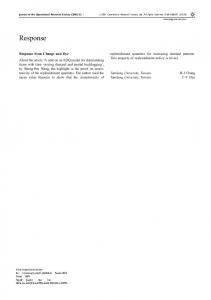
The AnRBC reactor made of Plexiglas is illustrated in Fig. 1. The trough size of the reactor was 15.5 cm in total length and 14.5 cm in width, having a semi-circular bottom in cross-sectional view.
Fig. 1. Experimental set up. July, 2012
The reactor had a 2,890 ml as working volume; 12 fully immersed disks with 12 cm in diameter which were connected via a stainless steel shaft to a motor and rotated at 0-16 rpm parallel to the direction of wastewater flow. The opening of each of the disks was 1 cm and the distance between disks was about 1 cm. The influent flow rate was regulated by a peristaltic pump. The reactor was cleaned at the end of each run.
2. Tracer Experiments Procedure
A unique technique for studying the flow pattern in a reactor is analysis of tracer-response profiles. In this study, Rhodamine B was used as a tracer, because this substance is not absorbed on or reacted with the exposed reactor surface, and can be detected at very low concentration with a spectrophotometer. In each run, the desired flow of tap water into the reactor was introduced by peristaltic pump according to the experiments that were designed by Design Expert software (Stat-Ease Inc., version 6.0.7) with two variables, hydraulic retention time (τ) and disk rotational velocity (ω). The samples were taken from the effluent after each interval time. The Design Expert software is a windows-compatible software which provides efficient design of experiments (DOEs) for the identification of vital factors that affect the process and uses RSM to determine optimal operational conditions. The results can be obtained as 3D presentations for visualization and also as contours to appreciate the effect of system variables on responses. In this experiment, 2.5 ml of a concentrated solution of Rhodamine B (0.0123 M) was instantly introduced into the inlet of the reactor. Effluent
Hydraulic characteristics analysis of an AnRBC using tracer experiments and RSM
893
Table 1. Experimental range and levels of the independent variables Variables Hydraulic retention time (τ), min Disk rotational velocity (ω), rpm
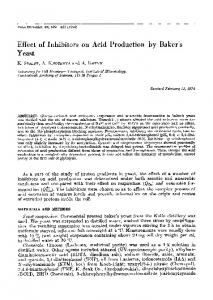
Fig. 2. (a) Absorption spectra of 2×10⁻⁴ M Rhodamine B, (b) Calibration graph for determination of Rhodamine B at its respective absorbance (λmax=554 nm). samples were collected immediately after the observation of the tracer in the effluent at every 5 min or at lesser time intervals and tested by spectrophotometer. The operation was continued until no tracer was detected for at least 2 or 3 times of HRT. Absorption spectra of Rhodamine B (2×10⁻⁴ M) were obtained in the range of 400-630 nm (Fig. 2(a)). Maximum absorption appeared at 554 nm at room temperature with UV-visible spectrophotometer (Agilent 8453, Germany). This maximum absorption was used throughout the experiments. Fig. 2(b) shows the calibration curve obtained for Rhodamine B at its respective absorbance λmax (554 nm) with correlation coefficient value of 0.999.
3. Experimental Design
Three important hydraulic factors that influence the treatment
performance of a RBC reactor are hydraulic retention time (τ), disk rotational velocity (ω) and degree of submergence. The latter variable is eliminated for anaerobic RBC as the disks were fully submerged in the system. In this study, τ and ω were therefore chosen as the independent and most critical operating factors on the hydraulic regime. The region of exploration for hydraulic regime in the AnRBC reactor was decided as the area enclosed by τ (60, 120 min) and ω (0, 16 rpm) boundaries (Table 1). Selection of the range of the ω was based on the results obtained from the earlier studies [22,23]. The operating conditions as well as their standard deviations are presented in Table 2, indicative of good agreement between the designed and actual values. The statistical method of factorial design of experiments (DOE) eliminates systematic errors with an estimate of the experimental error and minimizes the number of the experiments [24]. In this study, as no reaction occurs and both variables and responses are inherently hydraulic parameters, the face-centered design with the minimum levels was proposed. In the face-centered design, the axial points occur at the center of each face of the factorial space, rather than outside the faces as in the case of a spherical region, so α =±1. This design requires three levels of each factor. In addition, another reason for selecting face-centered design in this study was that the effects of the variables on the responses in the values between the range studied (− 1 to +1) had not shown any unknown curvature in the literatures as well as in our preliminary study, meaning that it does not affect the obtained trend. Therefore, the RSM used in the present study was a central composite face-centered design (CCFD) involving two different factors, τ and ω. The hydraulic regime of the AnRBC reactor was assessed based on the full face-centered CCD experimental plan (Table 3). The design consisted of 2k factorial points augmented by 2k axial points and a center point where k is the number of variables. The two operating variables were considered at three levels namely, low (− 1), central (0) and high (1). Accordingly, 13 experiments were conducted with nine experiments organized in a factorial design (including four factorial points, four axial points and one center point) and the
Table 2. Standard deviation of operating conditions applied in this study Factor Hydraulic retention time (τ), min Disk rotational velocity (ω), rpm
Designed value in DOE 060 090 120 000 008 016
Range and levels 0 1 60 90 120 00 08 016
−1
Range of measured value during experiment 060.84 091.75 122.46 0. 8. 16.0
Standard deviation ±0.092 ±0.148 ±0.113 ±0.000 ±0.000 ±0.000
Korean J. Chem. Eng.(Vol. 29, No. 7)
894
Y. Mansouri et al.
Table 3. Experimental conditions and results of central composite design Variables
Run
01 02 03 04 05 06 07 08 09 10 11 12 13
Factor 1
Factor 2
Hydraulic retention time (τ) min 060 090 120 060 090 090 120 060 090 090 120 090 090
Disk rotational velocity (ω) rpm 16 16 16 00 08 08 00 08 08 08 08 08 00
Deviation from ideal retention time min 03.61 22.20 31.31 19.12 13.57 09.56 43.18 09.58 17.57 15.00 26.51 13.00 32.43
remaining four involving the replication of the central point to get good estimate of experimental error. Repetition experiments were carried out after other experiments followed by order of runs designed by DOE as shown in Table 3. To do a comprehensive analysis on the hydraulic regime, four dependent parameters were calculated as response. These parameters were deviation from ideal retention time (∆τ), volume of dead space, Morrill dispersion index (MDI) and dispersion number (d). The parameters were determined by the following relationships. C(t ) E(t) = ---------------∞ ∫ C ( t ) dt
(1) (2)
∆τ = τ − t
(3)
Volume of dead space, % = ⎛⎝1− -t ⎞⎠ 100
(4)
MDI = P-----90P10
(5)
τ
t
(6)
F(t) = ∫ E(t)dt 0
2 c
∫ t C ( t )dt 0 - − ( t )2 = -------------------∞ ∫ C ( t ) dt 2
(7)
c
0
σ D D 2 σθ = ----2- = 2------ + 8⎛ ------⎞ ⎝ ⎠ uL uL τ 2 c
-----p = uL D e
July, 2012
Peclet number
0.23 0.19 0.13 0.14 0.16 0.17 0.10 0.18 0.15 0.16 0.13 0.14 0.13
03.9 04.2 04.9 07.1 05.2 05.1 10.0 04.9 05.4 04.9 07.7 05.4 07.7
%
64 51 30 26 26 29 36 44 23 35 26 20 56
07.29 17.12 28.20 33.46 17.12 14.30 37.86 17.79 21.12 24.00 24.30 19.00 37.67
D d = -----uL
(10)
where, C(t) is tracer concentration at time t, mg/l; t is mean residence time, min; E(t) is residence time distribution function; ∆τ is deviation from ideal retention time, min; MDI as a measure of the dispersion is Morrill dispersion index; P90 is 90 percentile value from log-probability plot, %; P10 is 10 percentile value from log-probability plot, % and F(t) is cumulative residence time distribution function. After the experiments were conducted, the coefficients of the polynomial model were calculated using the following equation [25]: i
t = ∑ (t)E(t)∆t
σ
Dispersion number (d)
Y = β 0 + β X + β X + β X2 + β X 2 + β X X + …
0
∞
Responses Dead volume MDI percentage
2
(8) (9)
i
j
j
ii
i
jj
j
ij
i
j
(11)
Where i and j are the linear and quadratic coefficients, respectively, and β is the regression coefficient. Model terms were selected or rejected based on the P-value with 95% confidence level. The results were completely analyzed using analysis of variance (ANOVA) by Design Expert software. Three-dimensional plots and their respective contour plots were obtained based on the effect of the levels of the two factors. From these three-dimensional plots, the simultaneous interaction of the two factors on the responses was studied. The experimental conditions and results are shown in Table 3.
RESULTS AND DISCUSSION 1. Tracer Study
The hydraulic performance of the AnRBC reactor was analyzed by studying water flow patterns or hydraulic residence time distributions (RTD) obtained from the tracer experiments. Fig. 3(a)-(c) presents the modeled and experimental data curves of the tracer concentration versus time distribution at different τ (60, 90 and 120 min) and ω (0, 8 and 16 rpm). It is clear from the figure that increase in τ resulted in an increase in deviation from ideal flow pattern, while
Hydraulic characteristics analysis of an AnRBC using tracer experiments and RSM
895
In general, the RTD curve shows a discrepancy between the mean residence time and the theoretical residence time. However, it is possible that stagnate hydraulic zones exist near the inlet or between the disk, where the tracer can be trapped and slowly released. It must be noted that, in this reactor, the liquid volume between the disks is 60% of the total liquid volume. Furthermore, the small space between the disks (1 cm) can hinder the tracer flow, resulting in high dead volumes for some conditions of τ.
2. Hydraulic Performance Analysis
Fig. 3. Mathematical and empirical curves of tracer concentration time distribution for (a) τ =60 min, (b) τ =90 min, (c) τ = 120 min. an increase in disk rotational velocity caused a decrease in the deviation. Comparing the results presented in the figures, it can be seen that the maximum deviation was obtained at τ and ω, respectively, 120 min and 0 rpm, whereas, the minimum value of the deviation was obtained at minimum τ (60 min) and ω (0 rpm). As depicted in Fig. 3, high volume of the tracer arrives at the outlet before mixing with bulk of the liquid in the reactor as disk rotational velocity equals zero. It was due to the short-cut phenomenon that occurred which originated from the reactor geometry, inlet and outlet design and inadequate mixing. From the viewpoint of hydraulic operation, the values of τ and ω, respectively, 60 min and 16 rpm were advisable since they corresponded to the lowest deviation detected.
2-1. Statistical Analysis The ANOVA results for all responses are summarized in Table 4. As various responses were investigated in this study, different degree polynomial models were used for data fitting (Table 4). To quantify the curvature effects, the data from the experimental results were fitted to higher degree polynomial equations (i.e., quadratic model). In the Design Expert software, the response data were analyzed by default. The model terms in the equations are those remained after the elimination of insignificant variables and their interactions. Based on the statistical analysis, the models were highly significant with very low probability values (from 0.019