Using UniMod for Maintenance Tasks: An Experimental Assessment in the Context of Model Driven Development Filippo Ricca, Maurizio Leotta, Gianna Reggio, Alessandro Tiso, Giovanna Guerrini, Marco Torchiano
Abstract: One of the claimed advantages of Model-driven development is the improvement in maintainability. However, few studies consider this aspect from an empirical point of view. This paper reports the results of a controlled experiment with 21 bachelor students aimed at investigating the effectiveness of Model-driven development during software maintenance and evolution activities. The tool used in the experiment is UniMod, a specific implementation of executable UML. Preliminary results indicate a relevant shortening of time with no significant impact on correctness, gained through the use of UniMod instead of conventional programming (i.e., code-centric programming).
Digital Object Identifier (DOI): http://dx.doi.org/10.1109/MISE.2012.6226018
Copyright: © 2012 IEEE. Personal use of this material is permitted. Permission from IEEE must be obtained for all other uses, in any current or future media, including reprinting/republishing this material for advertising or promotional purposes, creating new collective works, for resale or redistribution to servers or lists, or reuse of any copyrighted component of this work in other works.
Using UniMod for Maintenance Tasks: An Experimental Assessment in the Context of Model Driven Development Filippo Ricca1 , Maurizio Leotta1 , Gianna Reggio1 , Alessandro Tiso1 , Giovanna Guerrini1 , Marco Torchiano2 1 Dipartimento di Informatica e Scienze dell’Informazione (DISI) – Universit`a di Genova, Italy 2 Dipartimento di Automatica e Informatica (DAUIN) – Politecnico di Torino, Italy {filippo.ricca|maurizio.leotta|gianna.reggio|alessandro.tiso|guerrini}@disi.unige.it,
[email protected] Abstract—One of the claimed advantages of Model-driven development is the improvement in maintainability. However, few studies consider this aspect from an empirical point of view. This paper reports the results of a controlled experiment with 21 bachelor students aimed at investigating the effectiveness of Model-driven development during software maintenance and evolution activities. The tool used in the experiment is UniMod, a specific implementation of executable UML. Preliminary results indicate a relevant shortening of time with no significant impact on correctness, gained through the use of UniMod instead of conventional programming (i.e., codecentric programming). Keywords-Model Driven Development; UniMod; Controlled experiment; Maintenance tasks.
I. I NTRODUCTION Model-driven development (MDD) is a software development methodology based on the concepts of model and model transformation [12]. In practice, higher-level models are transformed into lower-level models until the model can be made executable using either code generation or model interpretation. In this latter case, executable models are directly executed/interpreted by means of specific environments. The main claimed advantages of MDD are improvements in productivity, portability, maintainability and interoperability [9]. Unfortunately, in the literature empirical studies — in particular, controlled experiments — evaluating MDD and considering these aspects are really rare. Since we are interested in investigating the effectiveness of MDD, we applied empirical methods to better understand the MDD phenomenon. The first step was an Industrial Italian survey on adoption and maturity of software modelling and model-driven development [13], [14]. The second step consists of controlled experiments with students. Obviously, not all the development methods and related tools can be experimented with respect to every software characteristic (e.g., portability, maintainability and interoperability). Thus, we had to select an instance among all the possible MDD proposals and to select a characteristic. Finally, after having consulted the literature looking for non proprietary MDD tools, we resort to UniMod [5] and maintainability as main software characteristic to study.
Thus, our main research question can be stated as follows: “Is UniMod1 effective during software maintenance tasks? And, if yes, how much is UniMod effective?”. UniMod is a MDD method for designing and implementing object-oriented programs with explicit emphasis on the state concept. We chose it for three reasons: (1) the method relies on UML that is well-known by our students, (2) a MDD free tool2 (available also as an Eclipse plug-in) based on this method exists, (3) the UniMod tool is simple to use and to install and thus suitable for students. In this work, we compare UniMod programming (Eclipse IDE + UniMod plug-in) with respect to code-centric programming (Java language with the Eclipse IDE) in the context of maintenance tasks. The paper is structured as follows. Section II presents UniMod. Section III provides details on the design of the experiment, including the definition of the experiment, context selection, hypotheses formulation, and instrumentation. Sections IV, V and VI present some preliminary results, threats to validity that could affect our results and related work, respectively. Section VII concludes the paper with final remarks and future research directions. II. U NI M OD UniMod is a MDD method for designing and implementing object-oriented programs. The method relies on a specific instance of automata-based programming (SWITCHtechnology [11]) and on UML. A tool for the development and execution of UniMod models is available. The tool allows one to create, edit and execute UML class diagrams and state machines, which correspond to the core ingredients of UniMod: connectivity schemas and transition graphs. We will briefly explain them by using a personalized instance of the “Helloworld” program: it prints the string “Hello, World!” on the console for ten times, then it prints the string “Bye, World!” for ten times. The interested reader can read more about UniMod in [5]. In the remainder of this section we discuss connectivity schema and transition graph, and later we present the UniMod Eclipse plugin. 1 I.e.,
our specific instance between all the available MDD proposals.
2 http://unimod.sourceforge.net/
A. Connectivity Schema A connectivity schema is a class diagram depicting classes with the following stereotypes: EventProvider (an event source), StateMachine (an automaton) and ControlledObject (a controlled object). Between these stereotyped classes, directed associations of the following three types may exist: 1) from an event source to an automaton; 2) from an automaton to a controlled object; 3) from an automaton to another automaton. Usually a connectivity schema is depicted as follows: the left part of the schema shows the event providers, the central part depicts one or more automata and the right part contains the controlled objects. The event providers are connected to the automata by means of UML associations and supply them with events. On the contrary, the automata are connected to the objects they control. The event sources are active: they affect the automata by means of events. By contrast, controlled objects are passive: they perform actions when the automata call them (i.e., they offer some operations). Controlled objects can also be used as input for the automata. In UniMod, by convention, the operations of a controlled object used as input (i.e., returning a value) for the automata are named xi (with “i” ranging from 0 to n) while the operations used as output (i.e., changing the value of an controlled object’s field) are named zi. The automata are activated by the events and, depending on the values of the input variables, controlled objects are affected and/or transitions to new states are executed.
print some messages on the console. A comment explaining the meaning of the operations is shown in the connectivity schema between brace parentheses. B. Transition Graph For each automaton, shown in the connectivity schema, a state machine, named transition graph in UniMod, needs to be created. That state machine can have simple and composite states, one initial state and one or more final states. Transitions between states have labels of the form: event [guard] / actions (all of them are optional). The square brackets contain a boolean formula, which is the condition of the transition firing (i.e., the guard condition).
Figure 2.
Transition Graph for A1
The transition graph for A1 is shown in Figure 2. It contains one initial state, one final state and two simple states (s2, s3): the program is in the first state (s2) when it is printing the string “Hello, World!” while it is in the second one (s3) when it is printing the string “Bye, World!”. For example, the label on the transition between the states s2 and s3: e101[o1.x4>=10] /o1.z1
has the following meaning (see comments between brace parentheses in Figure 1): when 1 sec elapsed [if counter>=10] / reset counter
C. UniMod Plug-In for Eclipse Figure 1.
Connectivity Schema for Helloworld
The connectivity schema of our running example is depicted in Figure 1. It contains: (1) an event provider p1 (a timer) that sends an event (called e101) each second (a tick of clock) to the state machine A1, (2) a state machine (A1) described by the transition graph (see below) and (3) two controlled objects (o1 and o2) used to count the iterations (“Counter”) and to print the strings on the console (“Printer”), respectively. For example, o1 provides five operations: the first (x4) is used as input for the automata while the others are used to affect the state of o1 and/or
The UniMod tool is available also as Eclipse plug-in. The plug-in provides the following software components: 1) a graphical editor to create/edit the connectivity schema and the transitions graphs (on the contrary, event providers and controlled objects are directly edited with the Eclipse textual editor given that they are pure Java code); 2) an on-the-fly model validator that notifies to the user errors/warnings and suggests possible quick-fixes; 3) a launcher that allows to execute the UniMod model3 in “one click”. 3 The UniMod model is composed by one connectivity schema and one or more transition graphs, event providers and controlled objects.
Figure 3.
Mind Map of the experiment
III. E XPERIMENT D EFINITION , D ESIGN AND S ETTINGS We conceived and designed the experiment following the guidelines by Wohlin et al. [15]. The mind map shown in Figure 3 summarizes the main “ingredients” of the controlled experiment and the obtained results. The goal of the study is analysing the effectiveness of UniMod (i.e., method + tool) during maintenance tasks with respect to code-centric conventional programming (i.e., directly implementing the change requests in the code using an IDE). The perspective is of researchers, evaluating how effective is UniMod in terms of (1) correctness of the final artefacts and (2) time required to perform the maintenance tasks. In what follows hypotheses, treatments, objects, subjects, variables and other aspects of the experiment are discussed in detail. A. Hypotheses The null hypotheses for the study are the following: • H0a Using UniMod does not affect the correctness of the maintained artefacts. • H0b Using UniMod does not affect the time required by the maintenance tasks. H0a and H0b are two-tailed since we cannot postulate a difference expectation in terms of correctness and time. B. Treatment and Experimental Design Two cases can be distinguished: (i) maintenance tasks executed on Java code using the Eclipse IDE and (ii) maintenance tasks executed on the UniMod model using the Eclipse IDE with installed the UniMod plugin. Thus, only one independent variable occurs in our experiment (main factor), which is nominal. It assumes two possible values: “–” (Java only) or “+” (UniMod).
Table I E XPERIMENTAL D ESIGN ( – = JAVA ONLY, + = U NI M OD ). Group A
Group B
Group C
Group D
Lab 1
Svetofor
+
Svetofor
–
Telepay
–
Telepay
+
Lab 2
Telepay
–
Telepay
+
Svetofor
+
Svetofor
–
The experiment adopts a counterbalanced design (see Table I), thus ensuring that each subject works with both the treatments (UniMod and Java only) in the two lab sessions (2-hours each). Subjects were split randomly into four groups, each one working in Lab 1 on the maintenance tasks of a system with a treatment and working on Lab 2 on the other system with a different treatment. This design was chosen because it mitigates possible learning effects between labs (Lab1 and Lab2). C. Objects The objects of the study are two software systems: Svetofor and Telepay. The UniMod versions of these two systems were downloaded from a Website managed by the UniMod’s designers4 . In that Website, several full featured sample UniMod projects are available on-line for download. Starting from the two downloaded UniMod projects, we completely built in Java two new software systems (Svetofor– and Telepay–) equivalent to Svetofor+ and Telepay+. During the transformation, we chose to implement the state machines using the nested switch approach [4]. 4 http://is.ifmo.ru/unimod-projects-en/
The subjects had a good programming knowledge, in particular Java programming, and an average UML knowledge (which was explained during the course). Subjects have been trained in UniMod programming with a two hours tool-demo. Moreover, they experimented UniMod on a simple example (HelloWorld, presented in Section II) implementing some simple change requests on the given UniMod model. E. Variables
Figure 4.
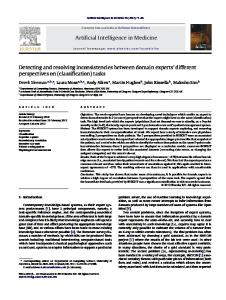
Svetofor GUI
Svetofor5 is a smart traffic lights simulator equipped with a GUI representing pedestrians and cars (see Figure 4). The user can click the buttons on the right to make pedestrians and cars appear in the GUI. The system simulates a smart traffic light that works as follows. If there are no cars, but some pedestrians are waiting on the crossing, the traffic light indicates green light for pedestrians until at least one car appears, and vice versa. If there are neither cars nor pedestrians, the green light is for cars (they need more time to slow down and speed up). The UniMod version of the Svetofor system consists of three event providers (with 12 events in total), three state machines (A1, A2, A3) and two controlled objects (with 30 operations in total). A1 has two states and 8 transitions, A2 has 11 states and 15 transitions and A3 has four states and 9 transitions. On the contrary, the Java version of the system consists of five Java classes for a total of 1711 LOCs. TelePay6 simulates a mobile phone payment terminal. The user can use the keyboard to insert the phone number. Then, she/he can select some banknotes to charge the mobile phone. The UniMod version of the Telepay system consists of three event providers (with 8 events), three state machines (A1, A2, A3) and three controlled objects (with a total of 15 operations). A1 has six states and 13 transitions, A2 has three states and four transitions and A3 has three states and three transitions. By contrast, the Java version of the Telepay system consists of 10 Java classes for a total of 1824 LOCs. D. Subjects The subjects were 21 students from the Software Engineering course, in their last year of the bachelor degree in Computer Science at the University of Genova (Italy). 5 http://is.ifmo.ru/unimod-projects-en/svetofor/
6 http://is.ifmo.ru/unimod-projects-en/teleplay/
The dependent variables to be measured in the experiment are (i) the artefact correctness after the execution of the maintenance tasks and (ii) the time required to perform the tasks. Similarly to [10], the correctness of each maintenance task (four for each system) was manually assessed by one of the authors executing an acceptance test suite and giving a score from 0 (totally incorrect or not executed task) to 4 (completely correct) to each task according to the number of test cases passed and failed. Then, another author examined the assessment. In case of disagreement between the two authors on a score, a discussion was undertaken to reach an agreement. The total correctness for each subject is computed summing up the four scores. Thus, the variable correctness ranges from zero (no correctly executed tasks) to 16 (four completely correctly executed tasks). The time was measured by means of time sheets. Students recorded start and stop time for each implemented maintenance task. In this way, we were able to compute the time required to execute each maintenance task simply computing stop time − start time. Finally, the time variable is computed for each subject summing up these four values. F. Material, Procedure and Execution The development environment was Eclipse (with and without the UniMod plugin, depending on the received treatment). For each group, we prepared an Eclipse project containing the software (UniMod or Java only). The projects were zipped and made available on a Web server. The experiment was introduced as a laboratory assignment about UniMod. Every subject received: • summary description of the application (Svetofor or Telepay) common for both the treatments. We used the original documentation downloaded by the UniMod projects repository, containing also the representation of the state machines; • instructions to set-up the assignment (how to download the zipped Eclipse project, import it, and execute the application); • a sheet containing the four maintenance tasks (for Svetofor or Telepay). For each lab, the subjects had two hours available to complete the four maintenance tasks: CR1-CR4 (Table II
Table II C HANGE R EQUESTS FOR S VETOFOR
CR2 – When the light is green for the cars and a pedestrian appears, the green for the car begins to flash (for about 5 seconds) and then goes to yellow. Change the application so that the green light for the car does not flash but remains fixed (again for about 5 seconds) and then move on to the yellow. CR3 – The modelled traffic light system is “smart” because: “It has some information about cars on the road and foot-passengers on pedestrian crossing. In presence of some foot-passengers and cars, traffic-light works like a common traffic-light. If there are no cars, but footpassengers are waiting on pedestrian crossing, it will be indicating green light for them until at least one car appears, and vice versa”. You have to delete the “smart” behaviour, i.e., after the change the system has to simulate a normal traffic light. CR4 – When the traffic light for cars goes from green to red, the yellow has to flash (for 5 sec) instead of being fixed (for 5 sec). shows the English translation of the change requests for the Svetofor system). The first two change requests are very easy to implement, while the third and fourth ones require more work to locate the code and/or the portions of the model to be changed and to implement the change. The maintenance/evolution tasks, for the two different systems, are very similar and of comparable difficulty. The same holds for the two systems. Between the two laboratory sessions (Lab 1 and Lab 2) a break was given. For each Lab session, the experiment execution followed the steps reported below: 1) We delivered a sheet containing the description of the system. 2) Subjects were given 10 minutes to read the description of the system and understand it. 3) Subjects had to write their name on the delivered sheet. 4) Subjects had to download from a given URL the Eclipse project and import it. 5) A sheet containing the four change requests was delivered.
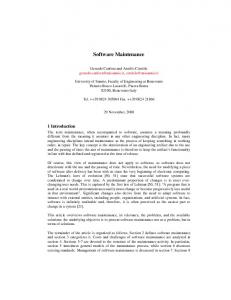
25%-75%
Non-Outlier Range
14
12
10 Correctness
CR1 – Reverse the side of appearance of cars. In the original version of the application, when you press the button “Add car left (right)” a new car from the left (right) appears. After the change when you will press the: (1) “Add car left” button the car should appear from the right and (2) “Add car right” button the car should appear from the left.
Median 16
8
6
4
2
System: SVETOFOR
System: TELEPAY
0 UNIMOD
JAVA
Figure 5.
UNIMOD
JAVA
Boxplots of Correctness
6) For each change request (CR1-CR4): a) Subjects had to satisfy the change request (for Svetofor or Telepay). b) Subjects had to record the time they need to execute the modification (start/stop time). Finally, subjects were asked to compile a post experiment questionnaire. That questionnaire aimed at both gaining insights about the students’ behaviour during the experiment and finding motivations for the quantitative results. It included questions about the tasks and systems complexity, the adequacy of the time allowed to complete the tasks and the perceived usefulness/effectiveness of UniMod. IV. P RELIMINARY R ESULTS This section reports some preliminary results from the performed experiment, analysing only the effect of the main factor on the dependent variables (correctness and time). More detailed analyses (e.g., analysis of co-factors such as task order or students ability) and the analysis of the post experiment questionnaire are not presented here for space reasons. Results of statistical tests are considered to be significant for a significance level of 95%. A. Correctness Figure 5 summarizes the distribution of the correctness variable by means of boxplots. Observations are grouped by treatment (UniMod or Java) and shown partitioning by system (Svetofor and Telepay). The y-axis represents the cumulative correctness of the four maintenance tasks – the cumulative score 16 represents the maximum value of correctness and corresponds to four tasks completely correct. The boxplots show that the subjects achieved a better correctness level when accomplishing the tasks with UniMod. This is true for both the systems but it is more evident
Median
120
25%-75%
Non-Outlier Range
Outlier
110 100 90
Time (Minutes)
80 70 60 50 40 30 20 10
System: SVETOFOR
System: TELEPAY
0 UNIMOD
JAVA
Figure 6.
UNIMOD
JAVA
Boxplots of Time
for Telepay (see the slopes of the two lines connecting the medians of the distributions in Figure 5). To be as much as possible conservative, we test the overall difference (i.e., without partitioning by system) in correctness by applying an unpaired non parametric statistical test7 . By applying a two-tailed Mann-Whitney U test, we found the difference not to be statistically significant (p-value=0.53), therefore we cannot reject the first null hypothesis (H0a ). B. Time The second hypothesis can be easily tested by looking at the time required to complete all the tasks. For this reason, we analyzed only the time for the students able to complete all the four tasks (25 observations in total). Figure 6 summarizes the distribution of the time variable by means of boxplots. The boxplots show that, for both systems, students using code-centric programming (i.e., Eclipse + Java) employed more time than students using UniMod. The difference between the two treatments is more evident for Svetofor. Overall, the mean time reduction, achieved with UniMod, is 33 minutes (with UniMod the mean is 65 minutes while with conventional programming it is 98 minutes), i.e., approximately 33,7%8 . To test the second hypothesis, we used a Mann-Whitney U test as done for the first hypothesis. The results of the twotailed Mann-Whitney test show that the overall difference is statistically significant (p-value