Using Visualizations to Learn Algorithms: Should Students Construct Their Own, or View an Expert’s? Christopher Hundhausen
Sarah Douglas
Laboratory for Interactive Learning Technologies Information and Computer Sciences Department University of Hawai`i Honolulu, HI 96822
[email protected]
Human-Computer Interaction Lab Computer and Information Science Department University of Oregon Eugene, OR 97403–1202
[email protected]
Abstract Algorithm visualization software graphically illustrates how computer algorithms work. Past experiments designed to substantiate the software’s pedagogical value have yielded mixed results. A review of these studies suggests that the more actively involved learners are in the visualization process, the better they perform. Given this trend, and inspired by ethnographic fieldwork we conducted in an undergraduate algorithms course, we hypothesize that students who use simple art supplies to construct their own visualizations will learn an algorithm better than students who interact with computer-based visualizations constructed by an expert. We conducted an experiment to test this hypothesis, and found no significant differences between the two pedagogical approaches. Thus, students who use “low tech” materials to construct their own visualizations may learn algorithms just as well as students who study conventional “high tech” visualizations constructed by an expert. This result motivates a markedly different kind of algorithm visualization software: one that enables learners to construct their own “low tech” visualizations.
1. Introduction Algorithms, the building blocks of computer software, are inherently abstract entities. Intuition suggests that, by making algorithms more concrete, graphical representations would help one to better understand how they work. This intuition inspired the development of algorithm visualization (AV) software, which supports the creation and interactive exploration of graphical representations of computer algorithms, e.g., [2, 13, 16]. Despite the enthusiasm and high expectations of AV software developers, a review of ten experiments ([4], §2 and 3; [9]; [11], ch. 4–9; [15]) fails to substantiate the software’s pedagogical benefits. Indeed, only six of those experiments ([4], §2 and 3; [9]; [11], ch. 6, 7, 9) showed that some aspect of AV technology or its pedagogical application significantly impacted learning outcomes.
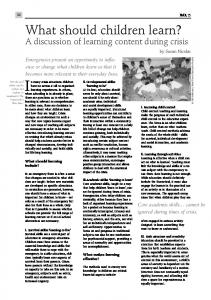
Further analysis of these experiments suggests that they fall into two broad categories based on the factors they identify as critical to the experimental evaluation of AV. Lawrence ([11], ch. 4, 5, 7, 8) and Stasko, Badre, and Lewis [15] varied representational characteristics of the learning materials, including (a) text versus animation, (b) text-first or animation-first, and (c) various graphical attributes of animations. By contrast, a second group of studies ([4], §2 and 3; [9]; [11], ch. 6 and 9) varied level of learner involvement. In addition to having learners passively view an animation, these studies involved learners more actively by having them (a) construct their own data sets, (b) make predictions regarding future animation states, or (c) program the algorithm. If one considers the results of the experiments vis-à-vis these two categories (Figure 1), a notable trend emerges: experiments that manipulate learners’ level of involvement have consistently yielded significant results, whereas experiments that have manipulated representation have not. This suggests that what learners do, not what they see, may have the greatest impact on learning—an observation that well accords with the current “constructivist” thinking of educational theorists, e.g., [10]. Representation Learner Involvement 0
1
2
3
4
5
20%
Significant Result
100%
Nonsignificant Result
6 7
8
Experimental Results
Figure 1. Results of AV effectiveness experiments broadly classified by their independent variables Given this observation, it makes sense to consider pedagogical alternatives that get students maximally involved in the process of visualizing an algorithm. To that end, Stasko [14] advocates the use of “visualization assignments” in which students use AV technology to construct their own visualizations of algorithms under study.
To better understand the benefits of student-constructed visualizations, we conducted a pair of ethnographic studies of a junior-level undergraduate algorithms course ([8], ch. 4). During the first study, students were required to use AV technology to construct conventional “high fidelity” visualizations—that is, visualizations that illustrate an algorithm for general input, and that have the polished look of textbook figures. During the second study, we had students use conventional art supplies (e.g., pen, paper, scissors) to construct “low fidelity” visualizations—that is, visualizations that illustrate an algorithm for only limited input, and that have a sketched, unpolished look. The key finding of the study was that constructing high fidelity visualizations is distracting with respect to the focus of a course that emphasizes the conceptual foundations of algorithms. Students spent an average of over 33 hours programming high-fidelity visualizations. They spent much of that time mired in the details of graphics programming. By contrast, students spent significantly less time—just over 6 hours on average—constructing low-fidelity visualizations. For much of that time, they focused on higher level issues relating to how, and sometimes why, an algorithm works. This finding raises an important research question: While having students self-construct low fidelity visualizations appears to focus students on activities that are relevant to an undergraduate algorithms course, does this method actually help students to learn algorithms better than other “active viewer involvement” methods that have been considered by prior experiments? In the remainder of this paper, we present an experiment designed to answer this question, we consider its implications for the design and pedagogical use of AV software, and we describe one promising direction for future research.
2. Experiment The specific hypothesis tested by our experiment was that students who construct their own visualizations will obtain a better procedural understanding, and better recall abilities, than students who view a predefined AV operating on their own input data sets. To test this hypothesis, the experiment employed a single factor, between-subjects design with two treatments: Self Construction and Active Viewing. In the Self Construction treatment, students learned about an algorithm by constructing their own visualizations out of simple art supplies. In the Active Viewing treatment, students learned about the same algorithm by designing their own input data sets and viewing a predefined visualization operate on those input data sets. Participants’ learning outcomes were assessed according to four dependent measures: (a) trace accuracy, (b) time to construct trace, (c) program accuracy, and (d) time to construct program.
We will describe our approach to measuring (a) and (c) below. Participants were assigned to treatment groups such that the two treatment groups were optimally matched according to self-reported grade point average. To counterbalance any potential task order effects, we further divided participants in each treatment into two groups, such that half the participants in a given treatment completed the tracing task before the programming task, and the other half completed the programming task before the tracing task.
2.1. Equalizing the treatments To ensure that any observed effects were due to the manipulation of the independent variable (construction), we had to take great care to make the two treatments as equivalent as possible. Two equalization issues deserve discussion here. First, in earlier studies [7], we found that the content of visualizations constructed by students with simple art supplies varies widely, ranging from textbookstyle figures involving polygons to creative metaphors that tell a story. We opted to equalize the content of each group’s visualizations by ensuring, to the greatest extent possible, that both treatments worked with visualizations with story content. In the case of the Active Viewing group, we created a visualization that portrayed the algorithm in terms of a story. In the case of the Self Construction group, by contrast, the participants themselves were required to create their own visualizations, so we ultimately had little control over whether their visualizations told stories. The best we could do was to word the instructions carefully. Self Construction participants were asked to devise a personally-meaningful story to illustrate the algorithm; however, we emphasized that creating a story may be difficult, and that they should not spend more than a few minutes trying to create one. If they could not come up with a story within a few minutes, we asked them to go with whatever geometric visualization came to mind. Second, we took great care to equalize input generality: the range of input data considered by each group. Here, our strategy was to word the experimental instructions for both treatments equivalently. For the Active Viewing group, the instructions asked students to view the animation for at least five input data sets. For the Self Construction group, the instructions asked students to construct at least five versions of their homemade animations—one for each of five input data sets. In both cases, students were free to explore more input data sets as time allowed. Thus, students had the opportunity to study an equivalent range of input data sets in both treatments, although it is important to note that students in the Active Viewing treatment generally explored more input data sets because of the lower overhead required to do so.
2.2. Participants We recruited 23 students (6 female, 17 male) out of the Winter, 1999 offering of CIS 315, a standard, juniorlevel undergraduate algorithms course. Student participants were all majoring in computer and information science, and had an average self-reported average cumulative grade point average of 3.12 (on a 4 point scale). We paid them a $50 honorarium for their participation in the study.
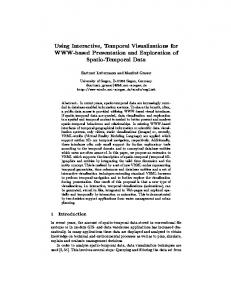
The animation also includes an ancillary “History” window (see Figure 3), which presents a summary of all of key algorithm steps that have occurred up to the current point in the animation unfolding in the Forest Rangers window.
2.3. Materials Participants learned about the QuickSelect algorithm (see [6], pp. 153–155, 185, 187–188), which had been covered in a CIS 315 lecture prior to the study. The QuickSelect algorithm uses the same divide-and-conquer strategy used by the well-known QuickSort algorithm. However, instead of sorting a list of elements, QuickSelect finds the ith smallest element in a list. For the learning phase of the study, participants in both treatments were given a three-page description, adapted from [6], of the QuickSelect algorithm and the Partition procedure on which it intimately relies. In addition, each group was given a set of instructions describing how to use their respective learning materials. Participants in the Active Viewing group interacted with an input-general AV developed with the Polka animation package [16]. The animation explains the QuickSelect algorithm through the Story of the Forest Rangers: Head Ranger Rhonda has just been notified by her bosses at the National Forest Service that a stand of trees is to be clear-cut. However, Rhonda is also told that ith shortest tree in the stand can be spared. It is her job to find that tree. With the help of her trusty assistants, Junior Rangers Rodham and Rachel, Rhonda proceeds to apply the QuickSelect algorithm to the stand of trees in order to find the tree to be spared from the clear-cut.
Upon launching the animation, the user is asked to enter the number of elements (trees) to select from, the individual values (heights) of the trees, and the rank of the tree to select. The animation then commences; the user is able to pause it and adjust its speed at any time. The main action of the animation unfolds in the “Forest Rangers” window (see Figure 2). In that window, Rhonda introduces the plot of the story, and, with the help of Rodham and Rachel, walks through the QuickSelect algorithm for the input data specified by the user. Each ranger has a speaking bubble, which flashes when he or she talks. In addition, a caption across the top of the window summarizes each key step of the algorithm as it unfolds.
Figure 2. “Forest Rangers” animation window In contrast, participants in the Self Construction group were given a packet containing the raw materials for the homemade animations they were to construct: a variety of art supplies, including colored pens, scissors, glue sticks, scotch tape, construction paper in a spectrum of colors, colored notecards, and white scratch paper.
2.4. Learning tasks To guide participants’ learning activities, each treatment group was given the same two explicit learning objectives: Upon completing this part of the study, you should be able to (1) perform a detailed trace of the QuickSelect algorithm (including the Partition procedure) operating on any input data set; and (2) remember the QuickSelect algorithm (including the Partition procedure) well enough to implement it in a programming language, if you had to.
Each treatment group received detailed instructions on how to proceed. Along with a complete description of the Forest Rangers animation, the Active Viewing group was given step-by-step instructions on how to use the animation. These instructions recommended that they run the animation on at least five, carefully chosen input data
Indicates subarray of trees passed to this recursive call to QUICKSELECT Indicates subarray of trees to consider in next recursive call to QUICKSELECT; rank of tree to select in next recursive call is shaded blue
Green outline contains subarray of trees that will be passed to subsequent recrusive call to QUICKSELECT Position of tree outlined in red corresponds to mid in the pseudocode (i.e., the value returned by PARTITION in this recursive call to PARTITION) Trees shaded gray have been eliminated from consideration
Figure 3: History view of animation (annotations added for clarification) sets, and that they study the “History” window each time the animation runs to completion. The Self Construction group received instructions on how to create a homemade animation out of art supplies. To get participants started with their homemade animations, we demonstrated how to construct a homemade animation for a simpler algorithm: Bubblesort. We asked that participants walk through their homemade animations for at least five input data sets. As they walked through their animations, they were asked to think or say to themselves a playby-play narrative explaining how the algorithm works. Moreover, in order to document that they had actually instantiated their animations on five input data sets, and in order to place them on equal footing with Active Viewing participants, Self Construction participants were asked to use an 8½” by 11” sheet of paper to create a “history view” for each of their five input data sets. Just like the “history” view included in the Forest Rangers animation (see Figure 3), their history views were to summarize each execution of their animation by including “snapshots” at key points in that execution. In our demonstration of how to construct a homemade animation of Bubblesort, we showed an example of what a history view might look like.
2.5. Evaluation tasks To evaluate participants’ procedural understanding and recall abilities, we had participants perform tracing and programming tasks. For the tracing task, participants were asked to trace through the execution of the QuickSelect algorithm for four different input data sets. We selected the input data sets so as to cover a broad range of possible inputs: best case, worst case, average case, and degenerate case (the algorithm did not halt on all input). Participants documented their traces by using a word processor to fill in
a table like the one presented in Table 1. Each row they filled in was to correspond with one recursive call to the QuickSelect algorithm. Notice that table entries correspond quite closely with the summary information provided by the “history” view included in the visualization used by the Active Viewing treatment. For the programming task, participants were given a partially complete specification of the QuickSelect algorithm written in either C++ or Java (they could choose which one). Using a word processor, they were instructed to fill in the missing code, which included the following three segments: (a) the recursive Select method; (b) the Partition method; and (c) the parameter list in the original call to the Select method. The skeleton programs that they edited were extensively documented, and places where code was to be filled in were clearly marked with ***TO DO*** blocks.
2.6. Procedure At the beginning of the experimental session, participants had 2½ hours to study the QuickSelect algorithm by using the three page description we provided, along with AV technology (either the Forest Rangers animation or art supplies. Following that, they had a maximum of 25 minutes to complete each of the four tracing tasks, and a maximum of 35 minutes to complete the programming task. At the end of the experimental session, participants were asked to complete a brief exit questionnaire.
2.7. Scoring the traces and programs To evaluate tracing accuracy, we created answer keys containing perfect traces for the four tracing tasks. We
Value of low
Value of high
The values of low and high, which define the subarray to process in the current call to QUICKSELECT.
Rank of element to select
Value returned by partition
the rank of the element to select within current subarray
State of array after partition
the value returned by the PARTITION procedure
Values of all array elements after (not before) the call to the PARTITION procedure (one array value per box)
Table 1. Trace table completed by participants (annotations added for clarification) assigned one point to each correct entry for low, high, rank of element to select, and value returned by Partition (see Table 1). With respect to the state of the array after each call to Partition, we assigned one point to each changedvalue in the array, and one additional point total to the remaining unchanged values. Thus, the number of correct points for a given trace depended on the total number of rows (one for each recursive call), and the number of changed array values in each of the rows. To evaluate programming accuracy, we used the CIS 315 textbook’s [6] pseudocode description of the Partition procedure and the recursive Select procedure to develop a list of semantic elements for each procedure. Essentially, a semantic element constituted a line of pseudocode, including the parameter lists to the two procedures. Each semantic unit was worth a varying number of points (1 – 3), depending on its composition and complexity. We gave participants’ programs a score based on the number of correct semantic elements they contained. While we did deduct points for semantic elements that were not ordered correctly, we did not mark off for minor syntax errors. The recursive Select procedure and Partition procedure were weighted equally.
Average Case Score (out of 40) % Correct Time (in minutes) Best Case Score (out of 11) % Correct Time (in minutes) Degenerate Case Score (out of 32) % Correct Time (in minutes) Worst Case Score (out of 63) % Correct Time (in minutes) Combined Total Score (out of 143) % Correct Time (in minutes)
ACTIVE VIEWING
SELF CONSTRUCTION
22.3 (107) 55.7 (26.8) 18.6 (5.5)
28.3 (9.0) 70.8 (18.9) 18.9 (5.4)
6.08 (1.6) 76.0 (20.5) 3.0 (1.2)
7.1 (1.3) 88.6 (16.3) 4.0 (2.6)
17.96 (10.0) 56.1 (31.1) 15.6 (5.6)
17.83 (6.3) 55.7 (19.8) 15.5 (7.3)
40.6 (17.8) 64.5 (28.2) 14.5 (3.7)
36.8 (19.2) 58.3 (30.5) 15.4 (6.4)
87.0 (35.7) 60.9 (25.0) 51.4 (13.5)
90.0 (32.5) 62.9 (22.9) 53.9 (16.9)
Table 2. Mean scores, percent correct, and times for tracing tasks (standard deviations are in parentheses)
3. Results Table 2 presents the mean scores, percent correct, and times of the two treatments for each of the four traces, along with the combined totals for all four traces. Figures 4 and 5 present box plots of the combined total scores and times. In these figures, the boxed regions delineate the middle 50% of scores and times for each treatment group; the horizontal line through each box marks the median. While the Self Construction participants scored slightly higher, a two sample t-test found no significant difference between the two treatments (t = -0.211, df = 21, p < 0.83). Likewise, while the Self Construction participants took slightly longer, on average, to complete the tracing tasks, a two-sample t-test determined that the difference was not significant (t = -0. 0.353, df = 21, p < 0.72). Table 3 presents the mean score, percent correct, and time of the two treatments for the programming task; Figures 6 and 7 present the scores and times as box plots.
Figure 4. Box plot of trace scores
Figure 5. Box plot of trace times
Score (out of 31) % Correct Time
ACTIVE VIEWING
SELF CONSTRUCTION
15.6 (9.9) 50.3 (32.0) 32.5 (4.3)
19.8 (9.3) 63.8 (31.6) 30.3 (5.1)
Table 3. Mean scores, percent correct and times for programming task (standard deviations are in parentheses)
Figure 6. Box plot of program scores
Figure 7. Box plot of program times Once again, although the Self Construction group scored higher, a two sample t-test found no significant difference between the two groups (t = -1.067, df = 21, p < 0.300). Similarly, although the Self Construction group took slightly less time on average, a two-sample t-test found that the difference was not significant (t = 1.083, df = 21, p < 0.29). Given that the Self Construction group performed better on the first two traces, while the Active Viewing group performed better on the second two traces, we performed a repeated measures test in order to determine whether treatment significantly affected trace task performance on a task-by-task basis; however, no significant effect was found (Wilk’s Lambda = 0.722, f3,19 = 2.443, p < 0.10). Finally, a linear regression was performed in an attempt to correlate the four dependent measures with student grade point average. The analysis yielded r2 values that ranged from 0.022 to 0.155. This suggests that grade point average is an extremely poor predictor of performance, since it accounted for less than 16% of the variance in all cases.
4. Discussion This experiment attempted to test rigorously the hypothesis that constructing one’s own visualization leads to better procedural understanding and recall than actively
viewing a visualization constructed by an expert. As has been the case for many of the researchers who have staged controlled experiments in an attempt to understand better the pedagogical benefits of AV technology, we are faced with the difficult task of explaining why this experiment failed to confirm its hypothesis. In interpreting the results, one should first double-check whether participants had any chance at all of doing well on the tasks. In an attempt to avoid the kind of design flaw discovered in the experiment of Stasko, Badre, and Lewis [15], we conducted an informal programming walkthrough [1] prior to the study. Our goal was to ensure that the information that participants would need to complete the two tasks would be available to them in the learning exercises in which they would engage. An important finding of our walkthrough was that the learning materials for the Active Viewing group originally lacked a display that made the important trace information explicit. As a result, we added the “history” view to the Active Viewing group’s predefined visualization, and we added the requirement that Self Construction participants construct their own history view. With respect to the programming task, our walkthrough noted that the three-page algorithm description that participants received included an explicit pseudocode description of the Select and Partition procedures. Since participants were likely to study this pseudocode as they explored the algorithm, and since participants had a background in programming, we expected that they would have a good chance of developing an ability to program the algorithm. If nothing else, they could elect to memorize the code—an approach taken by at least a couple of participants, according to exit questionnaire responses. Departing from the procedure of prior experiments, we elected in this experiment to tell participants the kinds of things they would be expected to do in the evaluation phase of the experiment. We hoped that making the learning objectives explicit would enable participants to be more directed than they might have been if they had not known what would be expected of them. A reality check of the data suggests that the experimental design succeeded in giving participants an honest chance of doing well on the tracing and programming tasks. On the tracing tasks, the highest individual percent correct was 94.4%, and the average for all participants was 61.8%. On the programming task, the highest individual percent correct was 91.9%, and the average percent correct for all participants was 56.2%. In both cases, it appears that the tasks were difficult, but not exceedingly difficult. Some participants excelled in the tasks, while others did poorly. Abnormalities in the data might also explain the failure of this experiment to detect significant differences. Further inspection of the data does, in fact, reveal three peculiarities. First, one participant’s time for the second trace is missing. Second, one participant’s programming time exceeds the 35 minute maximum by over 4 minutes. Third, the box plots presented above (Figures 4 – 7) indicate that,
while the trace scores and times are symmetrically distributed around the median, the distributions of the programming scores and times are slightly skewed. While these three peculiarities are worth noting, none of them is particularly serious, and none of them comes close to offsetting the overwhelming similarities observed between the Active Viewing and Self Construction data. In fact, the means of the two treatments on all measures appear so well matched that one might suspect that they come from identical populations. To test for the statistical equivalence of two treatments, Rogers, Howard, and Vessey [12] introduce to social scientists a technique that is well established in the biological sciences. The test that they describe is essentially the converse of the t-tests used above: Rather than determining the probability that two samples could have come from the same population, a statistical equivalence test tells us the likelihood that two samples could be equivalent if they came from different populations. To determine whether the trace scores, trace times, program scores, and program times of the two treatment groups are statistically equivalent, we first made the assumption that no meaningful difference exists between scores and times that are within 5% of each other. Then, using the confidence interval approach described in [12], we performed four statistical equivalence tests—one for each dependent measure. All four tests of equivalence failed, with p values that fall within a range (0.20 to 0.49) that is quite similar to the range of p values produced by the t-tests presented above. Thus, it appears that the most plausible reason that no significant differences or similarities were detected between the two treatments is that the self-construction factor, as manipulated in this experiment, is simply not reliable enough to produce an effect. In other words, if one gives two groups of students two and a half hours to learn an algorithm using these two alternative approaches, neither group is likely to perform appreciably better on tracing and programming tasks. Indeed, given the tremendous amount of variance in the data (which is quite common in studies of human cognitive performance), this experiment had little chance of demonstrating an effect. To see how small the chances for success were, one need only perform a back-of-the-envelope power analysis (e.g., [5]). Take, for example, participants’ tracing task accuracy. In order for the Self Construction group to have performed significantly higher on that task, it would have needed an average trace score of roughly 116—a full 26 points higher than it scored. Conversely, given the small difference (< 4%) between the mean tracing task scores of the two groups, one would require a sample size of more than 1,000 participants per treatment group in order to have just a 50% chance of detecting such a small difference with statistical significance! This is not to say that an experiment like the one presented here could not show an effect, if it were strong. Although the difference between the two group’s average
scores and times appears small, a visual inspection of the box plots presented in the previous section clearly indicates that there is less variance in the data of the Self Construction group. Given this, it seems plausible that applying the two treatments over a longer time could serve to solidify any differences between the two groups. For example, if students were to use these two alternative techniques to learn, say, five algorithms over the course of an entire academic quarter, one might see the slight trend in favor of the Self Construction group noted in this experiment turn into a significant difference.
5. Summary, implications, and future research A review of past experiments designed to substantiate AV technology’s pedagogical benefits suggests that the more actively learners are involved with AV technology, the better they learn the target algorithm. Building on this finding, we empirically compared two alternative pedagogical approaches with increasing levels of learner involvement. We hypothesized that students who created their own visualizations (Self Construction) would demonstrate better procedural understanding and recall than students who were active users of a predefined visualization (Active Viewing). The Self Construction students used simple art supplies to construct their own visualizations, and to simulate those visualizations executing on input data sets of their own design. The Active Viewing students interacted with a predefined visualization designed by an expert, observing the visualization as it executed on input data sets of their choosing. Unfortunately, the results of the experiment fail to confirm our hypothesis. Since this failure does not appear to be due to design flaws in the experiment, one must take the result at face value: As manipulated in this experiment, the self construction factor does not produce an effect that is reliable enough to detect. However, the results of this experiment would appear to have important practical implications. Using conventional (“high fidelity”) AV technology to prepare visualizations for classroom use is notoriously difficult and timeconsuming (see, e.g., [3]). In contrast, having students construct their own “low fidelity” visualizations using art supplies is cheap, easy, and requires a relatively small investment of time on the part of instructors. Thus, instructors looking for a low-overhead way to incorporate AV technology into their curricula can take comfort in the finding that students who use “low fidelity” art supplies to construct their own visualizations may learn algorithms just as well as students who interact with visualizations developed by an instructor using conventional “high fidelity” AV technology. Additionally, the results of this experiment have practical implications for the design of AV technology. Most extant AV systems, e.g., [2, 13, 16], support experts in the construction of “high fidelity” visualizations, which work
for general input, and which have the polished look of textbook figures. This experiment motivates the design of a different kind of AV technology: one that enables nonexperts to rapidly construct “low fidelity” visualizations, which do not necessarily work for general input, and which have a sketched, unpolished look. Along these lines, as part of his dissertation research ([8], ch. 7), the first author developed a high-level interpreted language for programming “low fidelity” algorithm visualizations, along with a directmanipulation, sketch-based environment for programming in the language. This experiment is actually the first in a series of proposed experiments that explore the learning benefits of various factors derived from our ethnographic fieldwork ([8], ch. 4). The second major factor posited to influence learning is instructor communication: whether or not students have the opportunity to discuss, with an instructor, the visualizations that they construct or interact with. In reflecting on the results of the experiment, one cannot help but speculate that instructor communication, in interaction with self-construction, may be vitally important in facilitating the improved understanding and recall that we hypothesize. Indeed, it is interesting to note that, because they did not have the opportunity to receive feedback from an expert, participants in the Self Construction group frequently constructed visualizations that did not accurately portray the algorithm. By contrast, participants in the Active Viewing group studied visualizations that were guaranteed always to be correct. Given this fact, it is remarkable that the Active Viewing group did not significantly outperform the Self Construction group. One can only wonder how much better the Self Construction group might have done, had they been able to discuss their visualizations with an instructor.
6. Acknowledgments This research was completed as part of the first author’s doctoral dissertation [7], supervised by the second author. The first author is grateful for the second author’s astute guidance on the project. Ted Kirkpatrick provided invaluable assistance with the statistical analysis of the data. Participant honoraria were funded by grants from the University of Oregon’s College of Arts and Sciences (Mary Chambers Brockelbank Fellowship) and Graduate School (Graduate Student Research Award).
7. References [1] Bell, B., Rieman, J., & Lewis, C. “Usability testing of a graphical programming system: Things we missed in a programming walkthrough,” in Proc. ACM SIGCHI '91 Conference. New York: ACM Press, 1991, pp. 7-12. [2] Brown, M. H. Algorithm animation. Cambridge, MA: The MIT Press, 1988. [3] Brown, M. H., & Sedgewick, R. “Techniques for algorithm animation,” IEEE Software, vol. 2, 1985, pp. 28-39. [4] Byrne, M. D., Catrambone, R., & Stasko, J. T. Do algorithm animations aid learning? Tech. Rep. No. GIT-GVU-96-18, Graphics, Visualization, and Usability Center, Georgia Institute of Technology, Atlanta, 1996. [5] Cohen, J. Statistical power analysis for the behavorial sciences. Hillsdale, NJ: Lawrence Erlbaum, 1988. Cormen, T. H., Leiserson, C. E., & Rivest, R. L. Introduction to algorithms. Cambridge, MA: The MIT Press, 1990. [6] Douglas, S.A., Hundhausen, C.D., & McKeown, D. “Exploring human visualization of computer algorithms,” in Proc. 1996 Graphics Interface Conference. Toronto: Canadian Graphics Society, 1996, pp. 9–16. [7] Hundhausen, C.D. Toward Effective Algorithm Visualization Artifacts: Designing for Participation and Communication in an Undergraduate Algorithms Course. Ph.D. Dissertation (Tech. Rep. No. CIS-TR-99-07), Dept. of Computer and Info. Science, U. of Oregon, Eugene, 1999. [8] Kann, C., Lindeman, R. W., & Heller, R. “Integrating algorithm animation into a learning environment,” in Computers & Education, vol. 28(4), 1997, pp. 223-228. [9] Lave, J., & Wenger, E. Situated learning: Legitimate peripheral participation. New York: Cambridge Univ. Press, 1991. [10] Lawrence, A. W. Empirical studies of the value of algorithm animation in algorithm understanding. Ph.D. Dissertation, Graphics. Visualization, and Usability Center, Georgia Institute of Technology, Atlanta, 1993. [11] Rogers, J. L., Howard, K. I., & Vessey, J. T. “Using significance tests to evaluate equivalence between two experimental groups,” in Psych. Bulletin, vol. 113(3), 1993, pp. 553-565. [12] Stasko, J. T. “Using direct manipulation to build algorithm animations by demonstration,” in Proc. ACM CHI'91 Conference New York: ACM Press, 1991, pp. 307-314. [13] Stasko, J. T. “Using student-built animations as learning aids,” in Proc. ACM Technical Symposium on Computer Science Education. New York: ACM Press, 1997, pp. 25-29. [14] Stasko, J.T., Badre, A., & Lewis, C. “Do algorithm animations assist learning? An empirical study and analysis,” in Proc. ACM INTERCHI '93. New York: ACM Press, 1993, pp. 61-66. [15] Stasko, J.T., & Kraemer, E. “A methodology for building application-specific visualizations of parallel programs,” in Journal of parallel and distributed computing, vol.18(2), 1993, pp. 258−264.