USING WEB 2.0 FOR MAPPING ALTERNATIVE AUSTRALIAN VIEWPOINTS William Cartwright School of Mathematical and Geospatial Science, RMIT University, Australia
[email protected]
KEYWORDS: Web 2.0, collaborative mapping Abstract “Getting the message across” demands access to communication media. When small, independent groups wish be heard their inability to mobilise conventional media can disallow any message being broadcast. Using the Web as a publishing medium has allowed these relatively small voices to disseminate their viewpoint, which might otherwise be impossible if only conventional media could be utilised. For publishing ‘small voice’ information that includes geographical information Web 2.0 provides a conduit whereby ‘individual’ maps can readily be produced and made available, globally. The need to have skills and tools for paper or ‘conventional’ Web mapping production disappears. The message broadcaster becomes the cartographer. This paper explores the use of subversive cartographies in Australia. It begins by providing a historical overview about how maps have been used, historically, to illustrate aspects of dissent, focusing on Australian movements for nationhood, Republic Australia and environmental and social issues. Then it focusses on the use of maps produced and published via Web 2.0 to promote alternative viewpoints in contemporary Australia. Finally, it considers whether these maps do provide the Australian community with useful information that complements ‘mainstream’ Australian media resources. Introduction Movements for social change, environmental protection, labour conditions, the status of minority groups etc. need artefacts and communication systems to disseminate their message. Like the Reformation in Europe that used Gutenburg’s printing press to produce documents that supported their cause, movement groups also seek to use the most efficient communications media and systems to voice their demands. In many cases the focus of these demands need to be spatially defined and their locations visualized. This has generally meant that various graphics and maps have been employed. Due to the very nature of the organisations, which, in many cases are staffed by volunteers, the maps produced have been produced by non-experts and generally printed on paper for subsequent distribution – until relatively recently. With the wide access to relatively inexpensive or freeware computer software for map production and using the Internet and the World Wide Web for dissemination this process has been automated somewhat, enabling the production of products and (Web) publishing to be fairly straight-forward. The paper begins with a description of the publishing / communication phenomena that is Web 2.0. Then, a brief description of some Australian movements that use the Web to communicate their cause is provided. This section is accompanied by examples of the use of traditional maps to highlight issues and activities is provided, and accompanied by how these organizations use Social Software and Web-map Application Programmatic Interfaces (APIs) via Web 2.0 to publish geo-located information more effectively. Finally, the usefulness of Web 2.0 products is considered.
Web 2.0 Over the last decade by far the most widely used method for the dissemination of geographical information recently has been the World Wide Web. Mapping products delivered by the Web are by-and-large the products of cartographers and, particularly products that are provided as ‘packaged’ products, whereby users are unable to sometimes make their own maps from supplied databases, but otherwise cannot make personal contributions. Web 2.0 is the use of the World Wide Web by individuals and groups of individuals to provide and share information by utilising the Web in a different manner. Users of Web 2.0 communicate differently and they do not require materials packaged by publishers – they do this themselves, and, they are computer literate, equipped with versatile computers and appropriate software and, perhaps most importantly, ready to use the Web in different ways. About Web 2.0, O'Reilly (2004) coined a term "architecture of participation" to describe the nature of systems that are designed to encourage user contribution. Therefore, with Web 2.0 users make their own contributions, share documents and they are attuned and skilled at composing their own media compilations to facilitate ‘self-help’ information provision. Web 2.0 and mapping products Relatively recently, maps have been published on the Web by user/producers using a process called ‘mash-ups’ with Web 2.0 and Social Software. Mash-ups allow maps to be produced by mixing services delivered through a third party using a publicly-accessible and usable interface or an API. Perhaps the most widely-used mapping application is that provided by Google Maps. It provides base maps of almost anywhere that can be used as an ‘underlay’ for individual annotation with default symbols or specially-created symbology. Map views are available as topographic or street maps (perhaps the most widely used maps are street maps), imagery (satellite or aerial), hybrid (maps plus imagery) and street (360 degree views of some locations). Google-based applications are also available that allow user-producers to generate information overlays and map annotations that could be described as ‘geo-notes’. Activist Movements in Australia Activist movements have been part of Australia’s history, and one of the early issues that brought about protest (and rebellion) focused on Miners Rights, and later class struggles (Builders Labourers Federation, 2008; Button, 2004; Department of Primary Industries, 2007; Walshe, 1954). Another highly charged issue was the move towards federation, and those against federation (the ‘anti-billites’) (National Library of Australia, 2008), and those that wanted to secede from the nation altogether, especially Western Australia, where its isolation from the other, eastern, States was seen to make it more independent (State Library of Western Australia, 2008; Western Australian Government, 2008; Scott, 1916; Western Australian Historical Society, 1953; LISWA, 2008). Later, movements against uranium mining in general, the atomic bomb and the testing of British nuclear weapons in Australia, Australia’s involvement in the Vietnam war and environmental issues like wide scale logging enterprises became established (Australian Institute of Criminology, 2008; Cahill, 2001; Martin, 1982; Strangio, 2003). In Australia there are numerous causes that have been and are being addressed. Movements are large and small, formally organised or ad-hoc. Communications that comment on their activities come from within and with out these movements and they can assist in shaping public opinions. Maps are part of the communications tools of movements and they can be powerful mediums for informing. The following section provides examples of the historical
use of maps (and map/graphics) to promote causes or to comment on causes. This section is deliberately graphical in nature, as the images can “speak for themselves”. Maps and map/graphics As noted in the previous paragraph, maps and map/graphics have been used to support campaigns, and to comment on campaigns using various communications formats. They are produced by ‘formal’ organisations like newspapers and journals and government. They also come from small organisations that enthusiastically promote their message via maps. The following examples are provided to illustrate the rich information resources that they have provided. They are presented in no particular order and no one communication format is seen as being the ‘best’ communication method. During the campaign for federation The Bulletin journal ran articles on Federation, supported by maps/map graphics. They clearly had a message to tell and this was told in a highly graphical manner. The illustration in figure 1 shows the feelings about having separate Crown Colonies instead of a federated nation.
Fig 1. Map of Australia showing progress of Federation up to date, The Bulletin, Sat February 4 1899 p.1. Source: http://www.trinity.unimelb.edu.au/publications/archive_displays/federation/comics
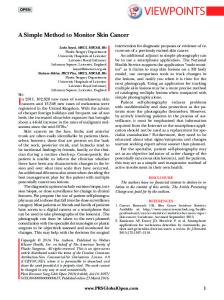
There were also very emotive maps to support Secession in Western Australia. The Dominion League of Western Australia commissioned a map (Figure 2) to support their cause. It was annotated with a myriad of facts supporting the remoteness of Western Australia to the other, more populous Eastern States. It appealed to Western Australian voters to vote ‘YES’ for the State to leave the Commonwealth of Australia by pointing-out the anomalies between their remote State and the rest of Australia.
Fig 2. The Dominion League set out its reasons for secession using clear and simple examples like this map. Battye Library [PR10563/11]
These examples show just some of the map/map graphics produced as part of mainstream journalism in The Bulletin, by governmental agencies, at home and abroad, by secession movements and environmental bodies. Historically, these maps were prepared by handdrawn techniques and replicated by printing. Later, publications like that shown in Figure 3, were probably produced using DeskTop Publishing tools and multiple copies made using relatively inexpensive processes like photocopying.
Fig. 3. Source: http://www.green.net.au/ppg/creerywetlands.html
The latter genre of publications is of interest here – those produced by amateur / volunteer cartographers. The production of the maps was hampered by the availability of graphics production tools or software. This could result in products that, when evaluating the ‘look’ of maps compared to their commercially-generated counterparts, appeared be inferior. New and available tools were needed for map production and publication. Web 2.0 provided a method for collaborative publishing using Social Software that enabled amateur cartographers to produce professional products. This method for map publishing is covered next.
Web 2.0 and maps to support movements International and national organisations have embraced Web 2.0 for map publishing. It has enabled them to produce high-quality graphics to promote their particular cause. Using Social Software and Web 2.0 they can make available almost immediately maps that communicate information that might otherwise be hidden. The United Nations Environment Programme (UNEP) Atlas of Our Changing Environment (Figure 4) uses Google Earth imagery as an underlay for depicting environmental changes. Users can view global information and make international comparisons. As well, individual country and regional information can be viewed by zooming into a particular area of interest. Hot spots then allow interrogation of specific information elements and to open additional pages. The product is a Web-delivered atlas, with base imagery and maps coming from the Google Earth application. Organisations like UNEP can become almost instant atlas publishers, without the need to build their Web atlas application from scratch.
Fig 4. Source: http://na.unep.net/digital_atlas2/google.php
Now looking at Web 2.0 and three Australian examples – one urban - Squat Space - a local organization in the Redfern/Waterloo suburb of Sydney and two national environmental movements – the Wilderness Society and Bad Developer. Squat Space is a small organization that endeavours to improve the living conditions of this deprived inner city area. At the other extreme is the Wilderness Society: nationally organized, enthustiacally supported and championing causes that stand against actions that might degrade the quality of Australia’s environment. These two case studies have been chosen to illustrate the diverse nature of how Web 2.0 has been used to support the dissemenation of spatially-defined information. Squat Space organised the Redfern/Waterloo ‘Tour Of Beauty’, an event that invites residents to explore their suburb, so as to better understand the elements that constitute where they live and also to provide an opportunity for residents to get to know each other. Advertising for the event began with the distribution of a paper map and accompanying literature asked residents interested in participating in the Tour of Beauty to return the map, with their location of domicile marked. Once this information was returned and collated the Tour was planned and advertised. This was done using Google Maps (Figure 5).
Fig. 5. Redfern/Waterloo Tour Of Beauty. Source: http://www.squatspace.com/blog/.
This example shows how local resident action movements can promote and organize their activities using Web 2.0. The maps from the Tour of Beauty supported information communication much more effectively than conventional ‘print and post’ methods. The Anti-logging movement in Australia involves many active organizations. They coordinate activities at a national level and act locally. One major concern in Australia is inappropriate logging of prime forests, with little influence from the general public about what happens. Because timber harvesting occurs in remote areas the problem, for many, was that the actual logging activities were “out of sight out of mind”. Massive tracts of forest were being removed, causing untold devastation to the environment. For example, each year in the Australian State of Tasmania, approximately 15,000 hectares of native forest are destroyed. A total of 155 areas, (57 square kilometers), of native forest will be permanently cleared of forest and converted to plantations in 2006 (The Wilderness Society, 2006). Information about what would happen is hard to get for an interested citizen. Areas designated for felling need to be identified on ‘formal’ governmental publications like appendices to Acts (maps) or to make educated speculations, supported by official forest reserve maps. But, for information seekers who might me inexpert at map resource research they will remain uninformed or ill informed without the means to track-down pertinent information. How can they discover “what’s happening”? Currently the Wilderness Society uses Google Earth to show the impact of forest clearing. Its Web site provides immediate information about Australia-wide environmental issues. For example, the Tasmanian arm of The Wilderness Society and the Victorian Rainforest Network (VRN) produced maps (Figure 6) pinpointing where trees were being harvested, providing clear evidence of the impact of timber harvesting in this State. Google Earth imagery was also used to highlight the sheer size of woodchipping in the State by including an image of the Gunns' woodchip mill at Bell Bay, Tasmania (Figure 7). It was included in the Wilderness Society Web page that highlighted the impact of clearfell timber harvesting and the eventual use of this natural resource: to produce woodchips for export.
Fig. 6. Source: http://www.wilderness.org.au/campaigns/forests/tasmania/tasforests-google/
Fig. 7. Gunns' woodchip mill at Bell Bay, Tasmania Source: The Wilderness Society. http://www.wilderness.org.au/campaigns/forests/tasmania/tasforests-google/
Looking further north, in the State of Victoria, clearfell logging was permitted in the Otways until 2008, when all remaining sawlog licences expire. Google Earth images were generated to illustrate where logging would occur up until this time (Figure 8). The overlays were developed by the Otway Ranges Environmental Group (The Wilderness Society, 2006).
Fig. 8. Red lines are the National Park boundary. Green lines are new nature conservation reserves. Source: Otway Ranges Environment Network Inc. http://www.oren.org.au/oren/ge.html Copyright (c) by Otway Ranges Environment Network Inc. www.oren.org.au
Fig. 9. Map showing the location of channels sprayed with Acrolein. Source: Bad Developers http://www.baddevelopers.green.net.au/Docs/gmw.htm
Bad Developers has published maps using Google Earth in the State of Victoria, where a water supply company, Southern Rural Water, was found to be using Acrolein. Bad Developers exposed the results of this practice. On the mashup shown in Figure 9 the orange shows location of channels sprayed with Acrolein in January and November 2005.
This section has provided some examples of how Google Earth and Google Maps has been used to publish maps by an inner city urban movement and environmental organizations for highlighting inappropriate development or activities in environmentally sensitive areas. These organizations have found that publishing in this manner is a most effective conduit for their information transmission. They have said: “Google Earth allowed the group to more effectively convey the impact of logging, which had been difficult to do previously as many Tasmanian forest areas were closed off to the public”. … "For those people who don't go out to the forest a lot, it basically unlocks the gates," … (Moses, 2006). It works, but do these, really conventional maps, impart the feeling of passion about the subject matter that other publishing media might provide? The maps in the previous section illustrated the potential that Web 2.0 and Applications Programming Interfaces (APIs) provide for amateur cartographers. But are they better than hand-drawn or rudimentary maps that do not have the same ‘look and feel’ of professional products. Do naive publications, exhibiting the gusto of their authors, achieve more than slick maps based on already available, and already seen, maps from Web 2.0 providers? Perhaps more than ‘just maps’ is needed? ‘Starbucks’ maps or homespun geo-located narratives? When providing artefacts with which to explore geography, the general method for the depiction of the attributes that combine to present a picture of the real world is to use of the map metaphor. Whilst an effective means for the portrayal of geographical information, the map metaphor can be enhanced using other metaphors, which can be readily delivered using contemporary technology and communications. Maps alone, or standardized maps, shouldn’t be seen as the only type of metaphor available to promote a cause. The use of standard Starbucks maps limits the ability to promote a cause in the best possible manner. Tufte (1990, p. 12) has noted that: “Escaping this flatland is the essential task of envisioning information – for all the interesting worlds (physical, biological, imaginary, human) that we seek to understand are increasingly and happily multivariate in nature. Not flatlands.” I see Starbucks maps emanating from flatlands: they work, but they are standardized, homogenised (no pun intended) and dispensed with little emotion. The concept of one-shoe fits all (Starbucks maps) cannot work in all geo-depiction cases. Graphics generated by Australian movements have traditionally included emotive elements. They carry not only the message, but they also publicly declare the emotions behind the message being communicated. Perhaps the most poignant graphics are those used to support the movement for indigenous rights in Australia. They can evoke immediate responses, compared to text, when issues need to be communicated with impact. The image below (Figure 10) was produced to support the ‘YES’ vote in the 1967 Referendum that gave Aborigines the right to vote. This was the highest ‘YES’ vote in Australia’s history – 90.77% of voters agreeing that Aboriginal should be recognized as citizens within their own country (Peters-Little, 200?).
Figure 10. Herbert McClintock drawing from Common Cause, 20 May 1967, the journal of the Miners Federation of Australia. Source: Fryer Library Online Exhibition, The University of Queensland. http://www.library.uq.edu.au/fryer/1967_referendum/campaign2a.html
Cartoons also transmitted powerful graphics about inequalities between black and white Australia. Take for example Frith’s cartoon From the rich man’s table (figure 11), which looks at the walkout of the Gurindji Aboriginal people from the Wave Hill Station. They protested over their working conditions and lack of access to their traditional lands. This is seen as a watershed for the Aboriginal land rights movement (The Herald, 1968).
Fig. 12. From the rich man’s table cartoon by John Frith. The Herald, July 1968 Source: National Library of Australia. http://www.oph.gov.au/frith/theherald-01.html
Whilst these examples are not maps per se, they do illustrate how emotions can be communicated using graphics. The message may not be as precise as cartographic products, but they are powerful messages. Whilst the use of APIs allows movements to produce highquality maps for Internet distribution they do not, in most instances, convey the emotions behind the message. Creating media is one thing, conveying a powerful message is another. Conclusion With access to sophisticated computer hardware and software, linked by contemporary communications devices, the map-maker’s palette is now richly and extensively provisioned with the means for depicting and delivering renderings of geographical information in a more timely, resourceful and exciting manner. The use of Web 2.0 typifies this. This paper has provided an overview of some movements in Australia and offered examples of the maps and graphics that they have, and do, use to communicate their messages. Web 2.0 allows small amateur mapmaker to produce maps that can almost immediately be published to promote and support their cause. The use of such technologies and their ability
to communicate globally is clear. How best to include emotion in these sandardised look and feel products needs to be addressed if powerful messages are to be delivered. References Australian Council of Trade Unions, 2008, A Short History of Australian Unions. http://www.actu.asn.au/AboutACTU/abouttradeunions/default.aspx Australian Institute of Criminology, 2007, “A toxic legacy : British nuclear weapons testing in Australia”. http://www.aic.gov.au/publications/lcj/wayward/ch16.html. Web page acessed November 23, 2007. Button, J., 2004 “Rebels, redcoats and a bloody dawn”, The Age, December 3, 2004. http://www.theage.com.au/news/National/Rebels-redcoats-and-a-bloodydawn/2004/12/02/1101923272413.html. Web page accessed December 3, 2007. Cahill, R., 2001, A Turbulent Decade: Social Protest Movements and the Labour Movement, 1965-1975, Sydney Branch, Australian Society for the Study of Labour History. Courtice, B., 2008, “Desal plant an unnecessary corporate hand-out”, Green Left Weekly issue #738 6 February 2008. http://www.greenleft.org.au/2008/738/38190 Department of Education, Australia, 2008, Who Rules? Australian democracy. http://www1.curriculum.edu.au/ddunits/guide/g1e_aust_democ.htm Department of Primary Industries, 2007, “Gold Fever”, http://www.dpi.vic.gov.au/dpi/nrenmp.nsf/childdocs/1D2EC1B62844E5074A2567C4001F371A-240A1FB448A3F0674A256DEA0025AA302A2A416C262C7813CA256CFC0019D216?open. Web page accessed October 14, 2007. English, D. and Delonno, P., 1980, “SA Atom Tests: Was Cost Too High?”, The Advertiser 16 April, pp. 8 - 9. Green Left Online, 1999, “1949 coal strike: Labor's `boots and all' sell-out”, 9 June 1999 http://www.greenleft.org.au/1999/364/364p13.gif. Web page accessed November 20, 2007. Jensen-Lee, C., 2004, “Power, Profit and Protest: Australian Social Movements and Globalisation”, The Australian Journal of Politics and History, Vol. 50. Leung, C. C., 2007, Desalination plant protest moves to the water, The Age, November 19, 2007. http://www.theage.com.au/news/climate-watch/desalination-plant-protest-moves-to-thewater/2007/11/18/1195321608779.html LISWA, 2008, Western Australia and Federation. http://www.liswa.wa.gov.au/federation/fed/028_gold.htm. Web page accessed April 9, 2008. Martin, B., 1982, “The Australian anti-uranium movement”, Alternatives: Perspectives on Society and Environment, Vol. 10, No. 4, Summer 1982, pp. 26 - 35. Moses, A., 2006, “Satellite images unlocks extent of logging”, The Age, December 13, 2006. http://www.smh.com.au/news/web/satellite-images-unlocks-extent-oflogging/2006/12/13/1165685727367.html National Library of Australia, 2008, Federation. http://www.nla.gov.au/guides/federation/politics.html O’Reilly, T., 2004, The Open Source Paradigm Shift. http://tim.oreilly.com/articles/paradigmshift_0504.html. Accessed Dec 18 2006. Peters-Little, F., 200?, Television documentary - VOTE YES for Aborigines. SBS Australia Roush, 2004, Web 2.0, MIT Technology Review. Royal Geographical Society, 1838, Considerations on the Political Geography and Geographical Nomenclature of Australia, Journal of the Royal Geographical Society, London. Scott, E., 1916, A Short History of Australia. http://gutenberg.net.au/ebooks02/0200471h.html. Web page accessed April 9, 2008.
State Library of Western Australia, 2008, Secession 1929-1939. http://www.slwa.wa.gov.au/federation/sec/066_fail.htm. Web page accessed 9 April 2008. Strangio, P., 2003, “From Vietnam to Iraq, a tale of two protest movements”, The Age, February 18 2003. http://www.theage.com.au/articles/2003/02/17/1045330536752.html The Herald, 1968, “A Brush with Politics. The life and work of John Frith”. http://www.oph.gov.au/frith/theherald-01.html. Web page accessed November 27, 2007. The Australian, 2007, Protest movement achieves global reach, September 27, 2007. http://www.theaustralian.news.com.au/story/0,25197,22490101-25837,00.html. Web page accessed September 30, 2007. The University of Queensland, 2008, “The 1967 Referendum - the fight for citizenship rights for Aborigines”, Fryer Library Online Exhibition. http://www.library.uq.edu.au/fryer/1967_referendum/campaign2a.html The Wilderness Society, 2006, Tasmania's devastating logging practices exposed”. http://www.wilderness.org.au/campaigns/forests/tasmania/tas-forests-google/ Tufte, E. R., 1990, Envisioning Information, Cheshire, Connecticut: Graphics Press. Walshe, R.D., 1954, The Eureka Stockade, Sydney: Current Book Distributors. http://www.agitprop.org.au/lefthhistory/19541101_rdw_the_eureka_stockade_1854_1954.ph p. Web page accessed November 20, 2007. Western Australian Government, 2008, 1925 to 1950: From Federation to Thoughts on Secession. http://www.175anniversary.wa.gov.au/index.cfm?fuseaction=background.19251950. Web page accessed April 9, 2008. Western Australian Historical Society, 1949, "Separation movement on the Eastern Goldfields, 1894-1904". Journal and proceedings Western Australian Historical Society 1949, vol.4, part 5, pp. 41 - 58. ??, 1982, “The Australian anti-uranium movement”, in Alternatives: Perspectives on Society and Environment, Volume 10, Number 4, Summer 1982, pp. 26 - 35.