Intelligent Data Analysis 7 (2003) 501–519 IOS Press
501
Utilisation of administrative registers using scientific knowledge discovery Reijo Sund National Research and Development Centre for Welfare and Health (STAKES), P.O.Box 220, 00531 Helsinki, Finland Tel.: +358 9 3967 2469; Fax: +358 9 3967 2485; E-mail:
[email protected] Received 1 November 2002 Revised 11 December 2002 Accepted 25 February 2003 Abstract. The volume of data being produced for administrative purposes is increasing rapidly. Data must be analysed in order to extract useful information to support decision making. The demand for evidence-based information means that the analysis must be conducted according to the principles of scientific research. Unfortunately, the massive second-hand data sets seem not to fit very well into the traditional methodological paradigm. A secondary data source imposes limitations on the formulation of a problem and concepts, because the measurement can only be based on existing data. The aim of this paper is to present a methodological framework for the utilisation of administrative registers in the creation of scientifically valid information. This is done by discussing fruitful methodological aspects encountered in the practical knowledge-discovery process. The ideas presented originate from many different fields, such as statistics, data mining and sociology. The emphasis lies on understanding connections between problem, data and analysis in the case of massive secondary administrative data sources. Keywords: Scientific research process, secondary data, administrative registers, event history analysis, statistical data mining, health care provider profiling
1. Introduction Data have been produced for hundreds of years. The reasons for such production were originally administrative in nature. There was a need for systematically collected numerical facts on a particular subject. Later, a belief in the advantages of quantitative information accompanied by advances in statistical techniques led to the birth of a widely used methodological paradigm for scientific research. Even more recently, advances in information technology have made it possible to more effectively collect and store larger and larger data sets. Administrative information systems have been at the forefront of data gathering, since there have been a growing demand for evidence-based information to support decision making and other administrative purposes. In many cases, however, raw data as such are of little value. Data must be analysed in order to convert them to useful information. Unfortunately data-driven analysis and the massive size of data sets seem not to fit very well into the traditional methodological paradigm. A traditional way of creating scientifically valid information is to design and carry out a scientific study, in which data production, analysis and reporting are all strictly problem-specific. Data represent tailored measurements of observational reality that are needed in problem solving. Analysis is then used 1088-467X/03/$8.00 2003 – IOS Press. All rights reserved
502
R. Sund / Utilisation of administrative registers using scientific knowledge discovery
to reveal ‘how things work’ in empirical data. By interpreting these empirical results in the theoretical context and discussing relevant limitations, it is hopefully possible to create a sophisticated answer to a problem in such a way that it can be evaluated by the scientific community. The most important challenge for the traditional paradigm is the nature of data. If it is not possible to produce tailored data according to the problem in question, the whole problem-solving process becomes more restricted. The secondary data sources utilised impose limitations on possibilities for technical analysis. Moreover, the formulation of a problem and the associated concepts inevitably becomes opportunistic, because the measurement can only be based on existing data [6]. For some researchers, even the validity of data is suspect if they were not produced for the specific purpose for which they are used. Such criticism is not necessarily based on evidence concerning the quality of the information contained by the data but rather on philosophical beliefs regarding the connection between data origin and data quality [35]. In addition, the growing size of data sets has raised some issues that must be dealt with in a different way: data exploration and description plays a more general role than it does in the case of small data sets; efficient algorithms (and computers) are needed in analyses; the unfeasibility of manual analysis results in separation between the data and the analyst; the manual management of all errors in the data is not possible; and the chance occurrence of patterns is more likely in large data sets. In addition, some databases include the whole population and not just a sample, which changes the nature of the whole statistical inference [13]. In other words, in the analysis of secondary data, the problem must be defined under preconditions arising from the data. Moreover, massive data sets are usually so overwhelming that their processing and analysis is difficult (‘data overload syndrome’). It may also be tempting to screen the data for significant associations without having an adequate prior hypothesis (‘snooping/dredging/fishing’). Rather than tackling too much on what can and can not be done, analysis should achieve an appropriate compromise between the practical problem and the data. This kind of activity has been characterised as ‘greater statistics’, which tends to be inclusive, eclectic with respect to methodology, closely associated with other disciplines and also practised by many non-statisticians [3]. Moreover, the larger the data sets are, the more important the general-science and collaboration aspects of the analysis process seem to become relative to the ‘statistical’ aspects. Since statistical research has traditionally focused on probabilistic inference based on mathematics, it has not been able to offer very much concrete help in these different circumstances. The practical need for information has led to the development of alternative ways of analysing data, such as data mining [9]. However, these strategies for analysing data have much in common, and formal statistical expertise also provides an excellent basis for the understanding and evaluation of these ‘new’ ideas. Statisticians ought to take advantage of the situation, get involved in interdisciplinary activities, learn from the experience, expand their own minds – and thereby their field – and act as catalysts for the dissemination of insights and methodologies [15]. 1.1. The aim of the paper The aim of this paper is to present a methodological framework for the utilisation of administrative registers in the creation of scientifically valid information. This is done by discussing the fundamental methodological issues encountered in the practical knowledge discovery process. The ideas presented originate from many different fields, such as statistics, data mining and sociology. The paper emphasises a broader understanding of connections between problem, data and analysis in the case of massive secondary data sources.
R. Sund / Utilisation of administrative registers using scientific knowledge discovery
Debate Context
Problem Question Perspective
Idea
503
Method Data
Analysis
Answer
Theory Fig. 1. Research process schema.
The development of this paper is heavily influenced by the context of health services research, a field in which the most valuable official data sets are individual-based. In these circumstances, the histories of individuals recorded in administrative data are the most general starting point for any analysis – and a fruitful starting point for this paper, too. A practical real-world example – used to demonstrate the research made by following the guidelines presented in the paper – is also taken from the context of health services research. 2. The scientific knowledge-discovery process The ultimate goal in all research is – or at least should be – to search for appropriate answers to relevant problems. To find sensible and scientifically valid solutions requires not only a knowledge of the phenomena being investigated but also the capacity to think originally about the nature of inference and the process of conceptualisation. The whole problem-solving process must be conducted in a systematic way, using appropriate methods. Even though it is not in general possible to split research process completely into distinct phases, certain common phases are encountered repeatedly and even simultaneously during the research process. The process does not proceed in such a way that one phase is completed first, after which one moves on to the next. Findings made during the research process inevitably have effects on the final conclusions, since these preliminary findings provide a deeper understanding of the phenomenon and data in question. One sophisticated characterisation of complex problem-solving, is known as a knowledge-discovery process (see e.g. [2,4,8]). However, despite the practical usefulness of a process description of this kind, some critical issues concerning the scientific nature of the research process are not mentioned at all. To see what is actually happening in the research process, it is helpful to place it in a wider context. For this purpose, an alternative schema for a research process is presented in Fig. 1. The interactive phases related to this schema are: understanding the phenomenon, understanding the problem, understanding data, data preprocessing, modelling, evaluation and reporting. Research is conducted in order to obtain an answer to some problem. The researcher has to choose the perspective from which solving the problem is approached, since research requires rigorous communication and careful definitions of concepts related to a phenomenon of interest. However, all researchers have some more or less latent foreknowledge, which provides directions and criteria for understanding the world and also guides understanding gained and interpretations made during the research process. The researcher must be aware that these choices and interpretations are his or her ideologically and historically dependent decisions. The choice of perspective and conceptions may even prevent one from seeing (or enable one to see) something important or interesting. In order to move from the theoretical level to the empirical level, the researcher must operationalise the research frame in such a way that it is possible to produce useful information from the phenomenon
504
R. Sund / Utilisation of administrative registers using scientific knowledge discovery
and thus create some answers to the problem. This kind of operationalisation is fundamental to the plausibility of research. This is the stage at which the research defines the point of view from which the phenomenon and concepts are examined. Data represent the empirical world in research. Observed information can not cover all details which are relevant to the phenomenon of interest. The observation and measurement must also be dealt with in a conceptual context. This means that some compromises must be made between the exactness of measurement and the ambiguity of observation. Definitions can not replace the empirical information, but definitions affect the organisation of information and the decisions based on such information. From this point of view, it is easy to argue that data should be produced strictly according to the research problem. That is not the case with secondary data sources, such as administrative registers, since secondary data are originally produced for some other purposes. The available data and the conceptual definitions used in their production are not necessarily compatible with the research problem at hand. As an extreme example, imagine that your observational world is all that you see, hear, smell and feel. Would you trade your observational world for an old black-and-white photo, if you could trade it for a high-quality three-dimensional digital image with full colour scale, including infrared? All in all, the researcher must decide what to observe, how to conceptualise variables, what kind of operationalisation to make and how to acquire appropriate data. The same freedom also applies to the choice of analysing strategy, interpretation of the results and discussion of alternative interpretations. Therefore it is important to reflect upon decisions made during the research process. Every scientific explanation is valid only in so far as the investigator can provide a rationale for what has been done. At each stage of the research, decisions and arguments must not rest on the uncritical or automatic use of established techniques but on a set of logical decisions which must be taken on theoretical grounds with full consciousness of what is being done. Results must be justified. In the example above, one obvious question to be answered is: Why was that particular black-and-white photo chosen? In this example, ideology may be viewed as the position of and lighting for the camera, and historical dependency as the moment of taking the picture in question. Since in the case of administrative registers the data typically have certain common properties, it is possible to make some suggestions of which it is useful to be aware if data originating from such a source are to be utilised. The next section briefly describes a few ideas that have been found very worthwhile in practice. In the research process these ideas may be seen as aspects of the following three phases: understanding the problem, understanding data, and data preprocessing. 2.1. Understanding the problem Time is an essential factor in many problem domains. For example, disease processes evolve in time, and patient records give the history of patients. In research on such dynamic phenomena, interest very often focuses on the sequences of events which occur in time and reflect changes in research objects. A good example is an employment career, which can be regarded as consisting of the sequences and timing of the various jobs and of their association with other events, such as changes in marital status and place of residence. In fact, the importance of the longitudinal event history approach has long been recognised in many areas, especially in the social sciences, econometrics and medical research (see e.g. [5,19,34]). 2.1.1. Operationalisation For the purposes of problem solving, the problem has to be ‘matched’ against the corresponding domain knowledge and data. This can be done by characterising the important properties of the phenomenon carefully, i.e. by operationalising it as a system. A system is defined as a ‘group of things or parts
R. Sund / Utilisation of administrative registers using scientific knowledge discovery
B: Outpatient care
A: No care
505
D: Death
C: Hospital care
Fig. 2. A system shown as a directed graph.
working together or connected in some way so as to form a whole’. This definition of a system requires that the concepts, objects and restrictions related to the system be adequately described. In the case of event histories, a common approach to characterising the phenomenon is to categorise events in such a way that they describe transitions across a set of discrete states in time. In the simplest case only one qualitative change is possible – for example, the transition from the state ‘alive’ to the state ‘dead’. However, in many cases one transition can not describe the dynamics of a phenomenon in a realistic way. For example, the slow development of a disease which finally results in the state ‘death’, can not be modelled accurately using only the time elapsing between the first diagnosis and death. If the system is constructed in a reasonable way, the individuals’ event histories can be regarded as ‘paths’ through the system. Pictorially the system can be presented as a directed graph whose nodes and edges have characteristics which describe the properties of possible states and transitions in a system (Fig. 2). This kind of presentation can be criticised as simplistic or even confusing, since it may seem that nothing happens to an individual as long as he or she remains in the same state. On the other hand, it has been found that this kind of formalisation of a problem is easily understandable even for technical outsiders and that it thus provides a common language for the experts from different fields which is required for effective co-operation between members of a research group. As a matter of fact, the presentation technique described above does not restrict the number of possible states. If it seems too unrealistic to assume that nothing happens during a stay in a state or that stays in the same state are not comparable, it is not a problem to split a state into a greater number of more specific states. In general there is no limit to this kind of hierarchical splitting. The choice of an appropriate degree of hierarchical structure is a good example of a fundamental decision on how to reach a compromise between exactness of measurement, ambiguity of observation and – most importantly – the practical needs of the problem-solving process in question. 2.2. Understanding data In register-based analyses, the data themselves impose restrictions on the whole problem-solving task. Such data are known as secondary data, in contrast to the primary data obtained by the investigator through direct observation or interviewing. The use of secondary data raises particular problems associated with the need to take account of the process by which the data were compiled. In general, data must have a form appropriate for storage and analysis purposes, and in addition for intuitive interpretation.
506
R. Sund / Utilisation of administrative registers using scientific knowledge discovery
Noise
Phenomenon
Coding
Register
Decoding
Data
Fig. 3. Schematic diagram of information communication via administrative registers.
2.2.1. The nature of data If we apply the traditional Shannon’s communication model in the context of administrative registers, the transmission of information in register utilisation can be regarded as having a structure such as that presented in Fig. 3 (cf. [31]). The main idea is that some parts of the phenomenon of interest are observed and coded to signal, which is then transmitted using a possibly noisy channel into a database and then decoded in order to obtain proper data concerning the phenomenon. Even though this is a very simple and technical representation of communication, it seems to contain the essential elements needed in the common-sense understanding of secondary data. In other words, it is assumed that there exists some phenomenon which can be observed. Since it is impossible to completely observe all details or make exact measurements, some kind of coding is used to describe things. This coded signal is then stored in a database. The noise can be interpreted as an explanation for measurement compromises, possible inconsistencies and coding errors, and coding practices existing in the stored signal. When this signal is to be utilised, it must be decoded into understandable data, i.e. into a form which tells us something about the phenomenon. This phase is also subject to noise caused by incompatibility of choices and interpretations made by the data producer and the data user. In other words, there are many problematic preconditions in the case of administrative data. Most importantly, the limitations of data are determined by the choices made by the producer of the data: easily available data are also easier to collect; data are produced using fixed categorisations and may be dependent on producers’ interpretations; there may be many data producers, with consequent variation in production practices and categorisations used; and information systems may not be flexible enough to take changes in phenomena and society into account. In practice, secondary data are interpreted in order to utilise them for purposes other than those for which they were originally intended. The most typical problems encountered in such a situation are the lack of data on important background phenomena and discrepancies between the users and producers of data as regards their beliefs and knowledge concerning the nature of data. It is possible to grasp the real nature of the data only if one understands (a) what factors have led to the production of certain data and a particular information system, (b) what are the sources and consequences of the type of organisation and data structures used, and (c) whether the data have an effect on the understanding of their domain [24,32]. 2.2.2. Data structures Event-history data consist of observations of the form (τ k ,Dk ), where τk is an ‘occurrence time’ and Dk is an ‘explanation’ for the event (and n is the number of observations and τ 1 ! τ2 ! . . . τn and τi < τj for at least one observation i != j and i, j, k = 1, 2, . . . , n). Usually Dk consists of a set of attributes (variables). However, not all the attributes necessarily contain important or interesting information. Some attributes can be irrelevant to the solving of particular problem or can be easily derived from other attributes. It is often reasonable to divide up the relevant information into two subsets of attributes. The first subset defines an event type E k and the other includes important
R. Sund / Utilisation of administrative registers using scientific knowledge discovery
tk
Ek
0
A
4
C
8
B
10
C
13
D
507
A B C D 0
2
4
A
6
0
8
C
10
2
4
B
6
8
12
C
10
14
16
18
16
18
time
D
12
14
time
S = < {(0,A)}, {(4,C)}, {(8,B)}, {(10,C)}, {(13,D)} > Fig. 4. An example of event-history data and the corresponding event sequence.
‘covariate’ information ik . For the sake of generality it is useful to allow a transformation f k for the occurrence time τk . If not stated otherwise, fk (τk ) = τk (k = 1, 2, . . . , n). Let m be the number of distinct occurrence times, t i be the ith distinct occurrence time (i = 1, 2, . . . , m) and the event set A i be the set of relevant information on observations occurring at the same time, i.e. Ai = {(ti , Ek , ik )}, where i = 1, 2, . . . , m and for every i, k is over the observations for which ti = fk (τk ). The generalised event sequence S is defined to be a queue of event sets sorted by the (transformed) occurrence time, i.e. S =< A1 , A2 , . . . , Am >. In addition, let the conditional event sequence, to be called an event subsequence, be a sequence S θ =< Ai |Ai ∈ S and condition θ is true >, where i = 1, . . . , m. The definition of the generalised event sequence given above is not very rigorous and can be used in the absence of any knowledge about the event-history framework. However, if one uses this framework, generalised event sequences acquire a constructive and intuitively clear interpretation. Moreover, transformations allowed in generalised event sequences make it possible to use the same data structure in the implementation of different statistical and data mining methods. 2.2.3. An example of a generalised event sequence Figure 4 shows an example of event-history data and the corresponding event sequence, which could be produced by system – say system P, presented in Fig. 2. Two graphical representations of this particular event history are also shown. The first is an event-history description of transitions in a system where an individual actually stays in a current state until there is a transition to another state. In the second, only the events occurring are marked on the figure. Since the time between two consecutive events is also the length of stay in a particular state, it is often very useful to include a ‘length of stay’ attribute in the covariate attributes ik , even though it can be easily calculated from the corresponding occurrence times. In the definition of a generalised event sequence, parallel occurrences of events are allowed. In principle, the systems approach can be rendered valid in this case by defining each combination of event
508
R. Sund / Utilisation of administrative registers using scientific knowledge discovery A
a)
0
C
2
4
6
G
0
B
C
8
10
G A
D
12
14
16
18
time
2
4
6
8
10
12
14
16
18
F B
C
8
10
D
b) 0
F
C
2
4
6
12
14
16
18
time
time
S = < {(0,A), (0,G)}, {(4,C)}, {(8,B), (8,F)}, {(10,C)}, {(13,D)} > Fig. 5. An example of a situation with parallel occurrence times.
sets as a ‘new’ event type. In other words, one can think of the explanation for an event type as a combined description of events occurring at the same time. However, in many cases it is reasonable to assign the parallel events to different event types, since it is possible to find ‘natural’ interpretations for these parallel events. The data shown in Fig. 4 constitute a description of movements of individual X in a system P. Let Q be a system with two states (state F: ‘married’ and state G: ‘not married’). As a result, data corresponding to the movements of individual X in the system Q have the same form as the data in Fig. 4. Figure 5a shows an example of this kind of situation. Now there are two event histories for individual X, one corresponding to the path through the system P and the other to that through the system Q. In this case it is known that the systems which ‘generate’ the data are parallel, but the two event histories can be combined into one event sequence (Fig. 5b). In the case of two parallel systems, the information concerning the ‘source system’ of an observation is a very valuable covariate. In general, there can, of course, be more than two data-generating systems. If there is a need to restrict analyses to the observations obtained from some particular system, this can be done easily by using an event subsequence conditional to the corresponding system. In practice there are always event histories for more than one individual. It is thus trivial to include a covariate which identifies an individual, for example his or her social security number, while the whole data set still has the form of a generalised event sequence. Again it is possible to restrict the analyses to a pretermined set of observations by using event subsequences with suitable conditions. 2.2.4. Censoring An additional point to consider is the fact that in practice, data constitute only a narrow window on the dynamics of a phenomenon. In other words, the observations contained in the data set fulfil the condition a < ti < b, where a and b are finite constants and t i is the occurrence time of an event. The problems caused by a limited observation window are illustrated in Fig. 6, which shows examples of different types of ‘censoring’. Each case corresponds to an individual’s length of stay in some particular state, i.e. each case is combination of two events: transition to the state of interest and away from it. Dotted parts of the lines are unobserved; this corresponds to the case where the ‘true’ transition to or from the state is not observed. Censoring in fact guides the possibilities for analysis, and it must be taken into account in such analyses. In the cases (a) and (g), there are no observed transitions to or from the state. This kind of censoring can be very problematic if the very first (or last) occurrence of some event type is considered more important than other occurrences (for example the first diagnosis of schizophrenia or the first backsurgery operation). In the case (b), the true transition to the state is not observed, but the individual was
R. Sund / Utilisation of administrative registers using scientific knowledge discovery
509
a b c d e f g h t1
t2
time
Fig. 6. Examples of censoring.
in that state when the observation began, and the transition time from the state is known. In the case (c) both transitions are observed, but there is a potential problem, because the data outside the observation window are not complete for all individuals (typical situation for hospital discharge data). The case (d) corresponds to the uncensored observation. In the case (e), there has been an unknown or ‘wrong’ transition from the state (drop-outs or ‘competing risk’). It is also possible that the follow-up has ended before the occurrence of the event of interest (case f) or the transitions to and from the state are outside of the observation window (case h). 2.2.5. Statistical interpretations of a generalised event sequence A generalised event sequence can be interpreted as a sample path of a marked point process, if the occurrence times for all events are distinct. This leads to a very general family of statistical hazard-rate models suitable for censored data (see e.g. [1]). In practice, all methods in the event-history framework are special cases of this general interpretation. For example, there are many situations in which the ‘calendar time’ of event occurrence is not important, since the ‘real’ information is the time between two consecutive events. In other words, the ‘starting time’ of a follow-up can vary between individuals. A traditional solution, very common in survival analysis, is to transform the time axis from calendar time to ‘failure time’. This can be done using a transformation function f k (τk ) = τk − bk , where bk is the occurrence time of ‘starting event’ of a corresponding individual and k = 1, 2, . . . , n (see e.g. [7,18]). Assuming that the probability of the next event type (state) depends only on time spent in the current state, an appropriate choice for a model is a semi-Markov-model (see e.g. [29]). By restricting the probabilities to change only at discrete time points, the semi-Markov model can be formulated using the Markov chain, where the state space is expanded in a proper way (see e.g. [14]). In the traditional Markov chain, the probability of the next event type (state) depends only on the current state (first-order Markov property), and the probabilities are time-homogeneous. In fact, the Markov chain interpretation corresponds to a situation in which the exact occurrence time is not important and only the order of observations matters. A generalised event sequence can be transformed to an event type sequence of this kind by using the transformation f k (τk ) = k(k = 1, 2, . . . , n). Moreover, by choosing the transformation function f k so that it is of the form fk (τk ) = c, where c is an arbitrary constant and k = 1, 2, . . . , n, the time dimension of the event sequence can be eliminated and the sequence reduces to the data miner’s classical market basket model (see e.g. [12], Chapter 6) .
510
R. Sund / Utilisation of administrative registers using scientific knowledge discovery
2.3. Data preprocessing Usually massive second-hand data sets contain so much information and so many domain-specific features, inaccuracies and problems that raw data as such are not usable. In order to use data in problem solving, there must be understanding of the connections between the problem and the data. In registerbased analyses, the problem, domain knowledge and data determine the most suitable model for the final problem solving. Typically it is possible to construct data sets of the event-history type using register data. Preprocessing can also be interpreted as a kind of technical operationalising phase in the research process. 2.3.1. Data abstraction Often the connections between highly specific raw data and the highly abstract domain knowledge are so complicated that it is not possible to find any direct links between data and knowledge. An intelligent interpretation of raw data must be embedded into analyses, so that the resulting derived data set is at the level of abstraction corresponding to the current problem. Since noise is an unavoidable phenomenon, some kind of data validation and verification which makes use of knowledge should also be performed. This kind of task, performed in order to abstract higher-level concepts from possibly time-stamped data, is called data abstraction (see e.g. [20], Chapter 2; [30]). In the discovery of medical knowledge, data are usually patient-specific, while medical knowledge is patient-independent and consists of generalisations that apply across patients. For example, a complication after surgical operation is a medical concept, but from individual-based data it must be abstracted by using some ‘rules’, such as a list of some particular diagnosis codes recorded in data[RF6]. 2.3.2. Data cleaning Real-world data are very often more or less incomplete, noisy and inconsistent. Data cleaning involves detecting and removing errors and inconsistencies from data in order to improve the quality of data (see e.g. [25]). Compared to data abstraction, cleaning is more data-driven and technically oriented. In other words, corrections of erroneous and inconsistent codes as well as missing values can be usually made to the whole database, but data abstraction always results in problem-specific derived data sets. 2.3.3. Data integration and reduction Two other common types of preprocessing are known as data integration and data reduction. The idea in data integration is to include data from multiple sources in analyses; the process is also known as record linkage (see e.g. [26,36]). Data reduction results in a reduced representation of a data set which is much smaller in volume than the original data set, yet produces the same (or almost the same) analytical results (see e.g. [12], Chapter 3). Data reduction can in fact consist of anything from simple database queries to very complicated analyses. 2.3.4. Preprocessing tasks in the event-history framework Sometimes it can in fact be difficult to distinguish what is operationalising, what is preprocessing and what is modelling. All these phases need interpretation and evaluation of the results. Since these are also highly domain-specific and problem-specific, it is difficult to give any general suggestions concerning tasks and methods for analyses, other than that the problem in question implicitly defines the most suitable technique and that the assumptions underlying techniques applied must be valid.
R. Sund / Utilisation of administrative registers using scientific knowledge discovery
511
However, some non-trivial preprocessing tasks in the event-history framework could include: ‘defining’ the state space for some system (What happens to a patient after a surgical operation?); finding interesting and frequent combinations of patterns (What combinations of diagnosis and operation codes are frequent?); assigning patterns to adequate hierarchies (What diagnoses relate to complications of a surgical operation?); and confirming the expert’s ‘hypotheses’ about the phenomenon from data. Most analysing techniques are feasible only in the case of moderately small data sets, since these typically need access to the whole data set, and the processing time will be directly proportional to the physical file size. In fact, many data mining methods are very well suited in such circumstances and are clearly something that is needed in practical data analysis. It can be stated that a sophisticated preprocessing operation incorporating non-technical domain knowledge in order to scale things down to a size fit for more specific statistical analyses is the most important and time-consuming part of register-based data analysis. One very straightforward but extremely useful preprocessing technique is ‘pattern remapping’. The idea is to first ‘forget’ the time dimension in the generalised event sequence and to use a levelwise search (see e.g. [21]) to extract the frequent patterns from data, regardless of occurrence times. These patterns (such as a list of medical diagnoses) are then given to a domain expert, who can identify and make hierarchical groupings for the relevant patterns. In the remapping phase, interesting patterns are then assigned to appropriate event types simply by ‘renaming’ interesting patterns according to suggestions made by the domain expert. Finally, the time dimension is restored and records lacking interesting event types are removed. This abstraction usually results in a considerably reduced data set with an interpretation corresponding to the current problem. 3. Practical example: Hip-fracture surgery This example is a simplified extract from a study, which aimed 1) to develop and implement registerbased performance indicators to measure the effectiveness of surgical treatment of hip fracture and 2) to evaluate and compare the effectiveness of health-care providers. The complete results are reported elsewhere [27,33]. The study is a part of a larger project which aims to develop register-based methods for the measurement of effectiveness in specialised health care. 3.1. Defining the problem The first task of the project was to build up a research group consisting of experts from different fields. The group defined the actual problem more meticulously: the idea was to identify all hip-fracture patients from the Finnish Health Care Register and follow the life events that they encountered after hip-fracture surgery according to register data. A simplified system related to this particular problem is shown in Fig. 7. As can be seen, the first hip-fracture operation performed on an individual patient has a key role in the characterisation of this phenomenon. Actually, the state preceding the first hip-fracture operation also matters from the clinical point of view, since the patients coming from home are usually in better condition than patients who are already in residential or hospital care. However, the major interest is in the events and pathways of care following the first hip-fracture operation. In this case, these events are classified into four categories. If everything goes well, the patient should return home. Hip fracture is a serious condition for the elderly, and it can also be a starting point or catalyst for other problems which may result in the need for residential or hospital care. A hip-fracture operation may even be followed by fatal complications. This
512
R. Sund / Utilisation of administrative registers using scientific knowledge discovery
Home
Home Hip-fracture operation Residential/ hospital care
Residential/ hospital care
Complication
Death
Fig. 7. System characteristics of significant life events related to hip-fracture surgery.
particular categorisation was chosen because the event types comprised the events of interest from the viewpoint of the original problem; and even more importantly, these life events are recorded in various registers. For the sake of generality, the system’s formulation also allows there to be multiple events after hipfracture surgery. As a matter of fact, the pathways of care are more interesting than single events in situations such as a cost-effectiveness evaluation. In the formulation of the system, only death is an absorbing state; all other states can be followed by any other state, i.e. only the death state ends a path in the system. Moreover, even though these four states are distinct, they are not necessarily independent. For example, death may be more probable after complications, or it may not be very likely that the patient will return home if long-term residential care is approved. The absorbing death state causes even more problems, because it is not possible to say of any individual that there is an increased risk of complications after death. However, it is possible to speculate what would have happened if death had not occurred. All in all, this kind of quite simple system definition seems to result in an extremely complicated competing risks model, and more simplifications are needed in the actual modelling. 3.2. Understanding and preprocessing data A cohort of patients with hip fracture in 1998 or 1999 was identified in the Finnish Hospital Care Register using a simple diagnosis-group abstraction (all patients with at least one ICD-10: S72 diagnosis in 1998 or 1999). Using the unique personal identity codes of the patient cohort, data on all inpatient and outpatient hospital care and deaths for this cohort were obtained from the Finnish Health Care Register, the data warehouse of the Finnish Hospital Benchmarking Project and the National Causes of Death Register. The results of these straightforward database queries were integrated into a new data set containing 167 952 records for 17 099 patients. Each record in this data set corresponds to one care episode in hospital (or death), not any actual event of the system, i.e. each observation includes information, such as patient and hospital ID-numbers, age, sex, area codes and diagnosis and operation codes, as well as dates of admission and discharge (or death). Data cleaning was performed in order to correct impossible simultaneous hospital episodes, systematic
R. Sund / Utilisation of administrative registers using scientific knowledge discovery
513
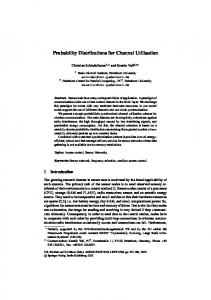
errors in the use of symptom vs. cause diagnoses, and some missing or erroneous attribute values in area codes. Many types of censoring occur in this data set: the first hip-fracture operation (or other important event) can be outside the observation window; some hospital episodes may have begun before 1998; follow-up finishes at the end of 1999 (there are census data available for the last day of every year in the Finnish Health Care Register); and follow-up may be terminated by the death of a patient. Operation codes corresponding to hip-fracture surgery were abstracted into two different operation types. Using this and the diagnosis-group abstraction of hip fracture, hip-fracture operations were identified from the data. Since the state preceding a hip-fracture operation was also important, the histories of the patients were traced backwards and the preceding state was classified as home or residential/hospital care by using data abstraction of a more complicated nature. The forward-direction abstractions were even more complicated, and all event types needed special abstractions and techniques. For example, the acute complication events were identified using the pattern remapping technique, in which all clinically relevant complication diagnoses were remapped to one event type. 3.3. Modelling, evaluation and reporting For statistical modelling purposes it was assumed that any acute complication event occurring after a hip-fracture operation is an outcome which reflects the effectiveness of the surgical treatment. In addition, deaths and the upper limit of the observation window were assumed to cause censoring of the event of interest. With these assumptions, the modelling reduced to standard survival analysis (see e.g. [7]) where the variables of interest are the time between a hip-fracture operation and a complication or censoring event, and the censoring indicator. These variables were calculated for all of those patients who were (a) aged over 60 years and (b) had been living at home before surgery. The final preprocessed data set had 8824 records, each containing relevant variables for one patient. In survival analysis, the distribution function of failure time random variable T is F (t) = P (T ! t), where t " 0, and S(t) = P (T > t) = 1− F (t), t " 0, is the corresponding survival function. Assuming F to be absolute continuous and f to be the corresponding density, the hazard function is defined by r(t) = f (t)/S(t), t " 0. The differential r(t)dt = P (T ∈ dt|T " t) has the intuitive interpretation of ‘the conditional failure probability at time t, given survival to at least t’. Moreover, the hazard function determines uniquely the distribution function, and hazard-based models are often a convenient way to handle censored observations. In spite of the fact that the time dimension includes a lot of information, the actual effectiveness indicators should be as easy as possible to interpret. In this study the continuous time scale was reduced to a simple dichotomous scale which merely indicates whether or not the event of interest has occurred in the case of an individual during some particular ‘limit’ time period. However, it is not obvious how such ‘limit’ times should be chosen. In addition to using clinical knowledge, it is also possible to utilise data empirically in this task. Since the outcome was an acute complication, the hazard function of acute complication occurrences was estimated. According to the hazard function presented in Fig. 8, the probability of acute complications was higher during the first 30-day period after a surgical operation. This finding based on the data corresponded to the domain knowledge and provided some evidence that the data abstraction was done in a proper way. Since there are censored observations in the data, the proportion of the risk population for whom an event of interest occurred within the ‘limit’ time period does not necessarily correspond to the ‘true’
514
R. Sund / Utilisation of administrative registers using scientific knowledge discovery
Hazard function for acute P 0.01 0.009 0.008 0.007 0.006 0.005 0.004 0.003 0.002 0.001 0
0
30 60 100 150 200 250 300 350 400 450 500 550
Time (days) Fig. 8. Hazard function for acute complication.
occurrence rate. In other words, rates must be estimated using more sophisticated methods. In this study the censoring was assumed to be independent (survival experience in the future is not statistically altered by censoring and survival experience in the past). The ‘limit’ time rates were estimated using product-limit (Kaplan-Meier) estimators. In addition, the counts of events were needed, and the corrected ‘observed’ counts were calculated using the relation O i = Ni Fˆi (t), where i indexes the risk population, Ni is the size of risk population i and Fˆi (t) is the estimated cumulative probability of event occurrence at time t (‘limit’ time rate) in risk population i. 3.4. Profiling the providers The most useful information is obtained when rates are evaluated for health-care providers, such as hospitals or hospital districts. Profiling analyses of this kind also allow comparisons of effectiveness between providers. However, the profiling can be quite complicated, since there is variation between providers for at least three reasons: 1) differences may be attributable to random variation caused by the size of the provider, 2) the patient case-mix may vary from provider to provider, and 3) providers may differ in the effectiveness of their care. For these reasons, a statistical model for provider profiling in which provider differences are modelled explicitly was constructed in the study. For an individual patient j , an observed outcome has the form (Y j |xj , zj ), where xj is a vector of patient characteristics and z j is a provider-specific effectiveness component. The expected outcome for a patient is E(Yj |xj ), i.e. a constant degree of effectiveness is assumed. Obviously, if the expected outcome is subtracted from that observed, the remaining residual reflects the effectiveness of care of a provider. In the case of binary outcomes, a logistic regression is a suitable tool for the calculation of the expected outcomes. The idea is to construct and estimate a model in which the observed outcome is a dependent variable and patient characteristics are independent variables. Using this kind of model, it is possible to calculate predicted values for all individuals using patient characteristics and estimated values of parameters with the inverse logit transformation.
R. Sund / Utilisation of administrative registers using scientific knowledge discovery
515
Since the focus in profiling is on providers and not!on individuals, ! the observed and expected outcomes must be aggregated to the provider level, i.e. O i = Yj and Ei = logit−1 (xj β), where the sums are over patients treated by provider i and β is an estimated parameter vector. Traditionally the ratio of observed to expected outcomes multiplied by the mean rate is used as a risk-adjusted rate for a provider. This quantity forms the basis for comparisons between providers and can be interpreted as the estimated event rate for a given provider if the population of patients treated were identical to the nationwide case-mix. Since the observed outcomes O i are non-negative integers describing frequencies of events, they can be assumed to have a Poisson distribution with unknown mean µ i . That is, Oi ∼ Poisson(µi), where log µi = log Ei + θi and i is the provider index. In other words, it is assumed that the expected outcomes Ei adjust the patient characteristics, and θ i describes the variation caused by provider. The use of logarithms guarantees that θ i remains positive in the model. Case-mix adjustment does not necessarily eliminate the variation in performance indicators in such a way that the indicators reflect a provider‘s effectiveness of care. For example, in data sets with a hierarchical structure there often exists correlations between observations, and this may result in overestimated differences in profiling analyses. Differences in the sizes of providers may also cause problems. For example, rates can not be estimated accurately for small providers. Assuming the exchangeability of providers (i.e. that the results for all providers are equal if there is infinite number of (similar) patients), a two-level hierarchical model can be used to solve the problems mentioned above. A simple solution is to assume that variation caused by providers is normally distributed, i.e. θi ∼ N (α, σ 2 ), where exp(α) is the ‘general’ case-mix-adjusted risk ratio and σ 2 describes the variance between providers (in logarithmic scale). This kind of hierarchical Bayes model needs appropriate prior distributions for the hyperparameters α and σ 2 , such as α ∼ N (0, 106 ) and σ −2 ∼ Γ(0.001, 0.001). The estimation of posterior distributions for parameters of interest (in this case θi s for all providers i) can be done using Markov chain Monte Carlo (MCMC) simulation [22]. Multiplying the obtained adjusted risk ratios by the mean rate results in easily interpretable riskadjusted rates for providers. The use of a hierarchical multilevel model eliminates many drawbacks of traditional profiling analyses. Multilevel models are well suited to the simultaneous calculation of many confidence intervals (multiple comparisons problem), and they give more conservative estimates for differences between providers than do traditional methods [11]. 3.4.1. Example drawn from the results Figure 9 shows the hospital-district-specific risk-adjusted rates for 30-day complication rates. The mean 30-day acute complication rate was 13.0%, and there were no significant differences between districts according to the 95% confidence intervals of rates. However, according to the 50% confidence intervals, hospital districts 9 and 15 seem to have slightly higher rates than others. For more results, see [27] and [33]. 4. Conclusions This paper has presented a methodological framework for the utilisation of administrative registers in the creation of scientifically valid information. This has been done by discussing essential methodological criteria encountered in the practical research process and by combining fruitful methodological ideas from different fields, such as statistics, data mining and sociology. The emphasis has been on the understanding of connections between problem, data and analysis in the case of secondary data sources.
516
R. Sund / Utilisation of administrative registers using scientific knowledge discovery
Hyvinkaa-Porvoo Lohja-L-Uusimaa Helsinki Jorvi-Peijas V-Suomi Satakunta K-Hame Pirkanmaa P-Hame Kymenlaakso E-Karjala E-Savo I-Savo P-Karjala P-Savo K-Suomi E-Pohjanmaa Vaasa K-Pohjanmaa P-Pohjanmaa Kainuu L-Pohja Lappi
33 34 31 32 3 4 5 6 7 8 9 10 11 12 13 14 15 16 17 18 19 20 21
(dottedline).
10 11 12 13 14 15 16 17 Fig. 9. Hospital district-specific risk-adjusted 30-day complication rates in 1998 and 1999. Rates as complications per 100 patients. Thin parts of lines correspond to 95% confidence intervals and thick parts correspond to 50% confidence intervals. Mean rate is 13 complications per 100 patients (dotted line).
In the introduction, the problem caused by a changing paradigm of data analysis was discussed. Different perspectives are needed in analyses. Bringing carefully defined ideas originating from some field into the body of knowledge concerning other fields may create new possibilities or solve some problems – if the scholars working in the ‘object field’ are open-minded enough. Moreover, some pieces of knowledge, such as the criteria for scientific information and the phases of research processes, may be ‘self-evident’ issues for many researchers and data analysts, but the listing of these principles is useful in any case, since it helps to anticipate and avoid the most crucial pitfalls. The paper contains some key points concerning the research process when it is based on massive secondary data sources. The secondary nature and massive size of data sets highlight the importance of scientific issues as compared to the technical questions. Effective research utilising massive secondary data sources requires broad expertise and active collaboration, since it is waste of time to reinvent things which are trivial to some other scholars. This can easily lead to the problem that there is no common language shared by experts in different fields. The ‘slaves of ideologies’ think differently and have different latent assumptions, so it can be difficult to find suitable compromises needed in order to achieve reasonable results. An even bigger mistake is to forget the possibly major impact that decisions made during the execution of a study can have on its outcomes. In addition, beliefs concerning the nature of secondary data are not the same for producers and users, and this generates unknown amounts of ‘noise’ for the results if such issues are not considered carefully. Sophisticated preprocessing – incorporating knowledge from the non-technical domain in order to scale things down to a size fit for more detailed
R. Sund / Utilisation of administrative registers using scientific knowledge discovery
517
statistical analyses – is the most important and time-consuming element in the register-based data analysis. All in all, it can be stated that ‘data are not collected, but produced; research results are not findings, but creations’ [17]. There is a great deal of literature concerning the utilisation of register-based data in research (see e.g. [6,10,16,23,28,35,37]). However, the perspective is usually very closely connected to the domain field or to some particular problem, which makes it difficult to extract more generally applicable ideas. Moreover, a purely problem-oriented approach can easily lead to a situation in which the contents of the data are taken too literally. For example, one pitfall is to think that medical diagnoses are recorded in administrative registers in just as detailed a manner as the diagnosis classification allows. There are also two very common erroneous beliefs concerning the utilisation of register data in research. It has been stated that the formation of research data is often technically easy, and that register data are ‘hard’ data representing the truth and providing evidence-based quantitative information. In spite of the fact that time-consuming and expensive production of new data is avoided, according to the principles presented above, the data preprocessing, which is full of ideologically dependent qualitative choices, is the most fundamental and the most difficult part of register-based research. Data analysis is never ‘easy record linking’. It is at least as important a part of the research as the domain knowledge. All data analysts should remember that they are not just assistants to ‘real researchers’ but full and equal members of the research group. Collaboration is the key to obtaining the results. Nobody can be an expert on everything. The principles of the research process that were presented above are the basis for the actual utilisation framework. Since the ideas were somewhat abstract in nature, some suggestions for concrete and practically useful interpretations were considered more carefully. The event-history framework was suggested as a well-developed option in outlining the characteristics of dynamic phenomena. A systems approach to the operationalisation of dynamic phenomenon was described as a helpful tool in generating a common language for experts from different fields. The structure of event-history data was shown to have the form of a generalised event sequence and to be a suitable data structure for the handling of second-hand register data. We drew attention to aspects of censoring which, in connection with eventhistory data, implicitly define possible model types for problem solving and provide a glimpse of the data-generating process, which has an intuitive interpretation in the event-history framework. Moreover, a wide variety of suitable data structures for traditional models can be produced from the generalised event sequence as special cases using the time-transformation property presented. In addition, common preprocessing types were reviewed, some examples of possible preprocessing tasks were given and a pattern remapping technique was formulated. Finally the ideas were illustrated by means of a practical example. It was seen that register-based data analysis becomes very complicated and challenging even in seemingly simple situations. All in all, this paper is simply a monologue presented by a statistician who is specialised in computational statistics and has a background in the social sciences, research interests in problems related to health services research, and experience in the production of official statistics, the maintenance of information systems, the development of statistical software, the teaching of statistics, and consultation with other researchers. In other words, the issues presented in this article are just an ‘insider’s’ collection of pieces of preliminary knowledge which are essential to the conduct of scientific research based on administrative registers. Acknowledgements This study is supported in part by research grant from the Academy of Finland.
518
R. Sund / Utilisation of administrative registers using scientific knowledge discovery
References [1] [2] [3] [4] [5] [6] [7] [8] [9] [10] [11] [12] [13] [14] [15] [16] [17] [18] [19] [20] [21] [22] [23] [24] [25] [26] [27]
[28] [29]
E. Arjas, Survival Models and Martingale Dynamics, Scandinavian Journal of Statistics 16 (1989), 177–225. R.J. Brachman and T. Anand, The Process of Knowledge Discovery in Databases, in: Advances in Knowledge Discovery and Data Mining, U.M. Fayyad, G. Piatetsky-Shapiro, P. Smyth and R. Uthurusamy, eds, AAAI Press, Menlo Park, 1996, pp. 37–58. J.M. Chambers, Greater or Lesser Statistics: A Choice for Future Research, Statistics and Computing 3 (1993), 182–184. P. Chapman, J. Clinton, R. Kerber, T. Khabaza, T. Reinartz, C. Shearer and R. Wirth, CRISP-DM 1.0 : Step-by-step data mining guide, The CRISP-DM consortium, 2000. D.G. Clayton, The Analysis of Event History Data: A Review of Progress and Outstanding Problems, Statistics in Medicine 7 (1988), 819–841. F.A. Connel, P. Diehr and L.G. Hart, The use of large data bases in health care studies, Annual Reviews of Public Health 8 (1987), 51–74. D.R. Cox and D. Oakes, Analysis of Survival Data, Chapman and Hall, London, 1984. U. Fayyad, G. Piatetsky-Shapiro and P. Smyth, The KDD Process for Extracting Useful Knowledge from Volumes of Data, Communications of the ACM 39 (1996), 27–34. J.H. Friedman, The Role of Statistics in the Data Revolution, Bulletin of the International Statistical Institute, 52nd Session, Proceedings, Book 1, 1995, pp. 121-124. M. Gissler, Routinely Collected Registers in Finnish Health Research, in: Statistics, Registries, and Research – Experiences from Finland, J. Alho, ed., Statistics Finland, Keuruu, 1999, pp. 241–254. H. Goldstein and D.J. Spiegelhalter, League Tables and Their Limitations: Statistical Issues in Comparisons of Institutional Performance (with discussion), Journal of the Royal Statistical Society, series A 159 (1996), 385–443. J. Han and M. Kamber, Data Mining: Concepts and Techniques, Morgan Kaufmann Publishers, San Francisco, 2001. D.J. Hand, Data Mining: New Challenges for Statisticians, Social Science Computer Review 18 (2000), 442–449. R.A. Howard, Dynamic Probabilistic Systems, Volume I: Markov Models, Volume II: Semi-Markov and Decision Processes, John Wiley & Sons, New York, 1971. P.J. Huber, Massive Datasets Workshop: Four Years After, Journal of Computational and Graphical Statistics 8 (1999), 635–652 P. Huston and D. Naylor, Health services research: reporting on studies using secondary data sources, Canadian Medical Association Journal 155 (1996), 1697–1702. J. Irvine, I. Miles and J. Evans, Introduction: Demystifying Social Statistics, in: Demystifying Social Statistics, J. Irvine, I. Miles and J. Evans, eds, Pluto Press, London, 1979, pp. 1–7. J.D. Kalbfleisch and R.L. Prentice, The Statistical Analysis of Failure Time Data, John Wiley & Sons, New York, 1980. T. Lancaster, The Econometric Analysis of Transition Data, Econometric Society Monographs 17, Cambridge University Press, Cambridge, 1990. N. Lavraˇc, E. Keravnou and B. Zupan, Intelligent data analysis in medicine, in: Encyclopedia of computer science and technology, (Vol. 42)(Supp. 27), Marcel Dekker, New York, 2000, pp. 113–157. H. Mannila and H. Toivonen, Levelwise Search and Border of Theories in Knowledge Discovery, Data Mining and Knowledge Discovery 1 (1997), 241–258. E.C. Marshall and D.J. Spiegelhalter, Institutional Performance, in: Multilevel Modelling of Health Statistics, A.H. Leyland and H. Goldstein, eds, Wiley Series in Probability and Statistics, John Wiley & Sons, Chichester, 2001, pp. 127–142. C.J. McDonald and S.L. Hui, The analysis of Humongous Databases: Problems and Promises, Statistics in Medicine 10 (1991), 511–520. I. Miles and J. Irvine, The Critique of Official Statistics, in: Demystifying Social Statistics, J. Irvine, I. Miles and J. Evans, eds, Pluto Press, London, 1979, pp. 113–129. E. Rahm and H.H. Do, Data Cleaning: Problems and Current Approaches, Bulletin of the IEEE Computer Society Technical Committee on Data Engineering 23 (2000), 3–13. Record Linkage Techniques – 1997, in: Proceedings of an International Workshop and Exposition (March 20–21, 1997, Arlington, VA), W. Alvey and B. Jamerson, eds, Federal Committee on Statistical Methodology, Office of Management and Budget, Washington DC, 1997. P. Rissanen, R. Sund, I. Nordback, T. Rousi and U. Id¨anp¨aa¨ n-Heikkil¨a, Lonkkamurtuman hoidon vaikuttavuuden rekisteriperusteinen mittaaminen ja vertailu (Register-based measurement of effectiveness of surgical treatment of hip fracture, in Finnish), Aiheita 21/2002, National Research and Development Centre for Welfare and Health (STAKES), Helsinki, 2002. L.L. Roos and J.P. Nicol, A Research Registry: Uses, Development, and Accuracy, Journal of Clinical Epidemiology 52 (1999), 39–47. Semi-Markov Models: Theory and Applications, J. Janssen, ed., Plenum Press, New York and London, 1986.
R. Sund / Utilisation of administrative registers using scientific knowledge discovery [30] [31] [32] [33] [34] [35] [36] [37]
519
Y. Shahar, A framework for knowledge-based temporal abstraction, Artificial Intelligence 90 (1997), 79–133. C.E. Shannon, A mathematical theory of communication, Bell System Technical Journal 28 (1948), 379–423. P. Starr, The Sociology of Official Statistics, in: The Politics of Numbers, W. Alonso and P. Starr, eds, Russel Sage Foundation, New York, 1987, pp. 7–56. R. Sund, Health Care Provider Profiling: Effectiveness of Surgical Treatment of Hip Fracture, Nordic Health Econometric Workshop, August 22, Helsinki, Finland, 2002. N.B. Tuma and M.T. Hannan, Social Dynamics: Models and Methods, Academic Press, Orlando, 1984. B.A. Virnig and M. McBean, Administrative Data for Public Health Surveillance and Planning, Annual Reviews of Public Health 22 (2001), 213–230. W.E. Winkler, The State of Record Linkage and Current Research Problems, US Bureau of the Census, Technical Report 4/1999, 1999. N.P. Wray, C.M. Ashton, D.H. Kuykendall and J.C. Hollingsworth, Using Administrative Databases to Evaluate the Quality of Medical Care: A Conceptual Framework, Social Science and Medicine 40 (1995), 1707–1715.