Utility-based Approach for Video Service Delivery Optimization Mamadou Tourad Diallo, Fr´ed´eric Fieau, Emad Abd-Elrahmane, Hossam Afifi
To cite this version: Mamadou Tourad Diallo, Fr´ed´eric Fieau, Emad Abd-Elrahmane, Hossam Afifi. Utility-based Approach for Video Service Delivery Optimization. ICSNC 2014: International Conference on Systems and Network Communication, 2014, pp.5-10.
HAL Id: hal-01077552 https://hal.archives-ouvertes.fr/hal-01077552 Submitted on 27 Oct 2014
HAL is a multi-disciplinary open access archive for the deposit and dissemination of scientific research documents, whether they are published or not. The documents may come from teaching and research institutions in France or abroad, or from public or private research centers.
L’archive ouverte pluridisciplinaire HAL, est destin´ee au d´epˆot et `a la diffusion de documents scientifiques de niveau recherche, publi´es ou non, ´emanant des ´etablissements d’enseignement et de recherche fran¸cais ou ´etrangers, des laboratoires publics ou priv´es.
ICSNC 2014 : The Ninth International Conference on Systems and Networks Communications
Utility-based Approach for Video Service Delivery Optimization Mamadou Tourad Diallo, Frédéric Fieau Orange Labs Audiovisual Network Delivery Issy les moulineaux, France
Emad Abd-Elrahman National Telecommunication Institute Computer & Systems Depatement Cairo, Egypt
{mamadoutourad.diallo,frederic.fieau}@orange.com
[email protected]
Abstract—This work aims to introduce an Utility-based approach for Video Service Delivery Optimization (U-VSDO). Through this optimization, a global utility function is calculated based on different constraints. Those constraints are considered based on separate utility function for each actor in the video service delivery chain (Content Provider (CP), Operator (OP) and Client (CL)). However, each actor has a global score for his vision, the overall optimization aims to satisfy the three actors. Our proposed methodology for this optimization is validated through different types of evaluation. First, a simulation based utility function is done for obtaining the optimal values of our optimization problem. Then, a complete GUI (Graphical User Interface) interface is built based on the main parameters for each actor. Finally, a testbed is conducted to differentiate between two types of flows using open source Software Defined Network (SDN) controller. This part considered the standard use case for ETSI (European Telecommunications Standards Interface) in CDN (Content Delivery Network) as a Service. Keywords- CDN optimization; video service delivery; utility function, quality QoS/QoE.
I.
INTRODUCTION
New video service delivery strategies face two challenges: pricing plan for the overall chain elements and the innovation for new added services. Many operators are struggling to maintain the Average Revenue per User (ARPU) and margins in revenues despite the high competition in market. They are searching for new optimizations that can achieve the balance between the main three actors in the chain (content providers, operators and consumers). But, the massive deployment of Over-The-Top (OTT) technology [1] is really representing a big threat for managed video services. Moreover, new opportunities brought by clients need to be studied in order to build a good utility between users needs and service requirements. Therefore, searching optimization algorithms and tools for managed video delivery networks is required. The traditional Content Delivery Networks (CDNs) are not defined mainly for data centers virtualization but for data caching and services acceleration. Akamai is one of the most famous CDN multi providers over Internet as it handles almost 30% of global Internet traffic all over the world [2]. Hereinafter, we will explain the main challenges in video data centers in general and conduct a subjective comparison between the main actors in video service delivery.
Copyright (c) IARIA, 2014.
ISBN: 978-1-61208-368-1
Hossam Afifi Institut Mines-Telecom Departement RST Saclay, France
[email protected]
A. Video Data Centers Issues Online video uses a very large amount of storage in data centers and bandwidth (BW) over the Internet. In USA only, almost 50% of Internet BW is consumed by online videos [3]. Globally, one of the main issues in data centers is the movement of contents. We tried in a previous work to study the issue of content movement and video file optimization in terms of access cost from user perspective [4]. While, in another work, we focused on the QoE aspects and their effects on data retrieval or caching costs [5], the overall control performance especially in video services is still insufficient due to the main bottlenecks in data centers interconnections. Moreover, the more famous data centers over Internet proposed by Amazon [6] or Google [7] are suffering from the same problem of bottlenecks as reported in [3]. So, until the cloud solutions bring an improvement, there are still some drawbacks in content movements either within single data centers or between data centers. So, there are high incentives to search an optimized solution for big data movements and its optimization. New trends consider the Software defined network (SDN) solutions as a movement tool and enabler. B. Comparison for the Three Actors It is important to analyze the main actors in video service delivery chain. Then, we can describe the objectives of each actor in order to introduce his utility and the overall work motivations. Here, two comparisons are mandatory in order to build our utilities and have clear problem statements as follows: 1) Agility Comparison The Agility is defined as the number of parameters and the ability of adaptation for the proposed system dynamically. So, the flexibility of service planning either for content adaptation or server placement is considered as an important factor in any video streaming chain. Thus, either for live streaming or VoD (Video on Demand), the easy adaptation and simple configuration of networks will enhance the overall system performance and users satisfactions at same time. Moreover, the correlation between the three actors in the video chain will lead to an optimal identification for both network capacities and users densities. Table I compares the Agility of the three actors effects in terms of some major attributes as follows:
5
ICSNC 2014 : The Ninth International Conference on Systems and Networks Communications
TABLE I.
AGILITY COMPARISON FOR THE THREE ACTORS
Attribute
Content Provider
Video Coding
The number of layers that can be available for each content like DASH layers or HLS for mobile users
Line Speeds
Cost consumptions for high speed deployment lines to contents hosting
Capacity
Maximizing the throughputs
Quality
QoS SLA/TCA between CP & OP for an efficient content delivery with min and max thresholds of quality
Quality of service measures for adaptive bit rates
Participating in QoS/QoE reports for enhancing the overall service delivery
Devices
Hardware or Software consumed for contents virtualizations or services on demand
Dynamic allocations for resources and network virtualization to cope with on demand servers caching or placements
Device capabilities to fit with different access networks and with virtual applications
Operator
Client
The carrier has to support different tunnels of traffic and with different rates of playing videos Fast adaptations and scalable networks for highly on demand services Minimizing the network load
The client application capacity for accommodating different coding layers and buffers required Line speed constrains either for fixed rates cost or on demand bandwidth Maximizing the number of clients
2) Cost Comparison Table II gives an overall cost comparison from each actor view as follows: TABLE II.
COST COMPARISON FOR THE THREE ACTORS
Attribute
Content Provider
Operator
Client
CAPEX cost
Min cost for content adaptations
Min transmission cost for each content
Min cost for required bandwidth line
OPEX cost
Hosting servers for different layers of same content
Running cost for QoS SLA/TCA between CP & OP
Running cost for additional Bandwidth
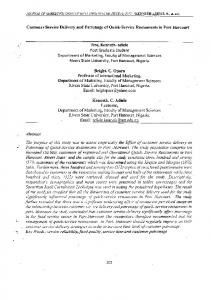
Based on the previous two proposed comparisons and main issues in service delivery, we can formulate our problem statements as follows: C. Problem Statement We propose a global optimization utility function for each one of the three actors in the video chain. As shown in Figure 1, the three actors in the chain are in collaboration for the best service delivery. Actor 1, the content provider asks
Copyright (c) IARIA, 2014.
Actor 2 (the operator) to deliver some video content requested by the third Actor 3 (client). We assume that the system is real time so requests can be handled through some controller unit that manages sessions and handover decisions between CDNs based on our optimization function.
ISBN: 978-1-61208-368-1
Figure 1. Main three actors in the video chain
The rest of this paper is organized as follows: Section II highlights the relevant work to this optimization and presents the different categories in video service delivery optimization. Then, Section III introduces our proposed methodology based on the new utilities constrains. The evaluation for our proposal is conducted in Section IV. Finally, this research is concluded with some future directions in Section V. II.
RELATED WORK
We can divide contributions for optimizing video delivery into three main methods: i) the network-centric approach, in which decisions are made at the network side (mainly by network operators), ii) the user-centric approach making the decision based on the user's benefit, and iii) the context-centric approach, where the switching decision is made by considering different context information. i) The network-centric: In this approach, decisions are made by the operators and they are principally based on their benefits. Sylvia et al. [8] propose a distributed strategy to get network topology information, and use Internet Control Message Protocol (ICMP) ping method to measure RoundTrip Time (RTT), in order to switch to a network which has the lowest RTT. Xueying et al. [9] work on the load balancing algorithm which automatically selects network candidate based on local resource conditions. The main advantage of this method is the network resources optimization. But these techniques do not consider content provider expectations and users Quality of Experience (QoE). ii) The user-centric: Network switching is made in order to satisfy user’s benefits, without considering network load and content provider expectations. Ksentini et al. [10] consider Quality of
6
ICSNC 2014 : The Ninth International Conference on Systems and Networks Communications
Experience measurements over different access types. After predicting a Mean Opinion Score (MOS) with Pseudo Subjective Quality Assessment (PSQA), a vertical handover (change in access network) is carried out towards the network offering the best MOS. It can be noticed that the user-centric approach has the main drawback from a load balancing perspective, since users generally consider only their own benefits while making decisions and letting the Operator and Content Provider benefits. iii) The context-centric approach: In this approach, the delivery decision optimization is made by considering different contexts (Content Provider, Operator, and Client). Bogdan et al. [11] propose an algorithm, called Smooth Adaptive Soft-Handover Algorithm (SASHA). Its goal is to improve the user perceived quality while roaming through heterogeneous wireless network environments. The score of each connection is evaluated based on a comprehensive Quality of Multimedia Streaming (QMS) including the following metrics: QoS (Quality of Service), QoE (Quality of Experience), Cost, Power efficiency and user preferences. The idea is to adapt delivery in the network that has the best (QMS) score. The disadvantage is the no consideration of content provider expectations in the adaptation process. Suciu et al. [12] propose Hierarchical and Distributed Handover (HDHO) method, a distributed handover decision framework which takes into account the objective of Content Provider by considering the content requirements in terms of resources, Operator in terms of network load and user preferences by considering cost sensibility. Even if, this proposal takes into account the aim of each actor on the delivery chain, some relevant parameters are omitted. In content provider side the cost of transmitting the content in a network is missed, in network side the cost and hardware status are absent, in client side the perceived quality of experience is not taken into account. In order to maximize a perceived quality of experience in users’ side, respect conditions of content providers and the operators’ benefits, we need to define a new video delivery optimization which takes into account the objective of each actor. Moreover, in such a dynamic environment composed by different devices with different characteristics, variables network conditions with different cost/load and content providers with different expectations, we propose the UVSDO algorithm that handles all those parameters as explained in the next section. III.
PROPOSED METHODOLOGY
The purpose of this section is to explain the steps of the optimization approach which takes into account the objective of Content Provider (CP), Operator (OP) and the User. Our approach is based on the definition of three entities, each with their goals as follows: The objective of Content Provider is to send the Content in the network with a minimum cost and still manage the Content expectations in terms of
Copyright (c) IARIA, 2014.
ISBN: 978-1-61208-368-1
requirements (for example the minimum required throughput for the content). The objective of the Operator is to transmit content on its network (CDN1 or CDN2 in our example) while keeping the load as lower as possible. The objective of the client is to improve the Quality of Experience besides the QoS.
The Utility-based Video Service Delivery Optimization (U-VSDO) will take into account the goals of each actor in addition to the main constrains. As shown in Figure 1, the optimization decision will be managed by the Main Controller after solving the optimization problem. This controller can be for example an SDN controller as will be explained in Section IV for SDN Network Function Virtualization NFV [13]. So, we can solve the problem by the following steps: A. Problem Formulation We used the utility functions to calculate the scores of each actor; this is very useful to characterize the satisfaction derived from a parameter. The function must have the following characteristics: The function increases with parameter x and has a maximum of 1, When x is “low”, the function tends to zero. The possibility to have normalized results between [0, 1]. Several functions meet these criteria. Moreover, we decided to use the utility function: (1), as the work in [12] [14], where x is a parameter of the function. In future work, we will further investigate the influence of others utility functions in our optimization problem. Hereinafter, we introduce the details of each actor utility function based on the previous propositions either for utility type or normalization way. Then, a global score utility will be calculated under the main constrains defined for each actor as follows. As the work in [12], we have two types of parameters: The positives parameters: High values are better, example (throughput, available hardware, etc.), then for an utility function we took the parameter directly. The negatives parameters: Low parameters are better, example (cost, network load, etc., then for these parameters we choose for example. For Content Provider: +1-
= (1 = (2 -
-
) )
. Ds
. Ds
(1) (1)
where:
7
ICSNC 2014 : The Ninth International Conference on Systems and Networks Communications
o o
o o o o o
, is the score related to Content Provider (CP) for flow j in network i. = UNIT cost per Mbyte, is the cost of transmitting the content in the network (CDN1 or CDN2) in our example). =( (j), ) = 0, when < , = 0. is the maximum cost that the content provider is ready to pay. , is the available throughput. Ds = ( , =0, when < is the required video throughput.
Note that: ( means that; when 1 otherwise. For Operator:
< B then ( ,B) =0 and
= (3
).NLs.Cops.Hs (2)
where: , is the score related to Operator in network i. ; is the cost from the operator
o o
o o
A, B and C: are the model parameters calculated by using subjective test data from different experiments. , is the maximum value of which correspond to the normalized factor
So, the general optimization problem can be formulated as follows by total score: =α * +β* + * (5) where are the weights of entities in the global optimization and =1 The weighting parameters define the importance of each actor in the optimization decision. In our work we decided that the Content Provider, the Operator and Users have the same weight, then: = B. Optimization Problem Constraints In this section, we summarize the main utility functions for the computed scores and their constraints that will be implemented in the next section and appeared in the GUI interface as follows: 2
side. o o o o o o o o
is the network load. NLs= , NL (i)) =0, when < NL is the maximum acceptable network load. Cops= ( ,Cop(i))=0, when < Cop is the maximum price that the operator is ready to invest. H is the required hardware threshold. Hs= (H(i), i)) = 0, when is the minimum required hardware for considered service. For Client : =
(3)
where: o ) corresponds to the satisfaction obtained by users in network i for flow j. It is a parametric model which computes the Quality of Experience function of contexts information (environment) [15], the model takes into account parameters such as the device type, the video content type and the quality of the network link in order to predict the Quality of Experience. The analytical function is called and is presented in the equation below: =
Copyright (c) IARIA, 2014.
ISBN: 978-1-61208-368-1
(4)
=3
Client : Objective: maximize ( Subject to :
IV.
) < < Dr < Dref NL<