INTERNATIONAL JOURNAL OF MOLECULAR MEDICINE 36: 1233-1243, 2015
Utility of different massive parallel sequencing platforms for mutation profiling in clinical samples and identification of pitfalls using FFPE tissue JANA FASSUNKE1, FLORIAN HALLER2, SIMONE HEBELE2, EVGENY A. MOSKALEV2, ROLAND PENZEL3, NICOLE PFARR3, SABINE MERKELBACH-BRUSE1 and VOLKER ENDRIS3 1
Institute of Pathology, University of Cologne, Medical Centre, D-50924 Cologne; 2Institute of Pathology, University of Erlangen, Medical Centre, D-91054 Erlangen; 3Institute of Pathology, University of Heidelberg, Medical Centre, D-69120 Heidelberg, Germany Received May 11, 2015; Accepted August 5, 2015 DOI: 10.3892/ijmm.2015.2339
Abstract. In the growing field of personalised medicine, the analysis of numerous potential targets is becoming a challenge in terms of work load, tissue availability, as well as costs. The molecular analysis of non-small cell lung cancer (NSCLC) has shifted from the analysis of the epidermal growth factor receptor (EGFR) mutation status to the analysis of different gene regions, including resistance mutations or translocations. Massive parallel sequencing (MPS) allows rapid comprehensive mutation testing in routine molecular pathological diagnostics even on small formalin-fixed, paraffin‑embedded (FFPE) biopsies. In this study, we compared and evaluated currently used MPS platforms for their application in routine pathological diagnostics. We initiated a first round‑robin testing of 30 cases diagnosed with NSCLC and a known EGFR gene mutation status. In this study, three pathology institutes from Germany received FFPE tumour sections that had been individually processed. Fragment libraries were prepared by targeted multiplex PCR using institution‑specific gene panels. Sequencing was carried out using three MPS systems: MiSeq™, GS Junior and PGM Ion Torrent™. In two institutes, data analysis was performed with the platform-specific software and the Integrative Genomics Viewer. In one institute, data analysis was carried out using an in-house software system. Of 30 samples, 26 were analysed by all institutes. Concerning the EGFR mutation status, concordance was found in 26 out of 26 samples. The analysis of a few samples failed due to poor DNA quality in alternating institutes. We found 100% concordance when
Correspondence to: Dr Jana Fassunke, Institute of Pathology, University of Cologne, Medical Center, Kerpener Strasse 62, D-50924 Cologne, Germany E-mail:
[email protected]
Key words: lung cancer, mutation testing, massive parallel sequencing, fixation artefacts
comparing the results of the EGFR mutation status. A total of 38 additional mutations were identified in the 26 samples. In two samples, minor variants were found which could not be confirmed by qPCR. Other characteristic variants were identified as fixation artefacts by reanalyzing the respective sample by Sanger sequencing. Overall, the results of this study demonstrated good concordance in the detection of mutations using different MPS platforms. The failure with samples can be traced back to different DNA extraction systems and DNA quality. Unknown or ambiguous variations (transitions) need verification with another method, such as qPCR or Sanger sequencing. Introduction In the growing field of personalised medicine, the increasing number of molecular targets for individualised therapies requires the analysis of numerous, potential genetic alterations, which is becoming a challenge in terms of workload, tissue availability, as well as costs (1). For non-small cell lung cancer (NSCLC), molecular analysis has shifted from the analysis of the epidermal growth factor receptor (EGFR) mutation status to the analysis of additional gene target regions, including resistance mutations and gene fusion events (2). Taking these developments into account, massive parallel sequencing (MPS) has come into focus, as it allows rapid, comprehensive and cost-effective mutation testing for routine molecular pathological diagnostics, even on small formalin‑fixed, paraffin-embedded (FFPE) biopsies (3-6). However, the implementation of MPS platforms into routine diagnostics raises questions about feasibility, sensitivity and specificity, as the results of mutation testing are the basis for therapeutic decision making (1,7). The ever-increasing pace of MPS adoption presents enormous challenges, in terms of data processing, storage, management and interpretation, as well as sequencing quality control, which impede the translation of research into clinical practice (8,9). Additionally, the preanalytical steps are important to consider: the manual macrodissection of selected tumour areas has become a standard procedure in molecular pathology and
1234
FASSUNKE et al: UTILITY OF DIFFERENT MASSIVELY PARALLEL SEQUENCING PLATFORMS
is a powerful tool to reduce false negative results resulting from wild-type contamination (10). Selecting the right tumour area influences not only the result of the analysis, but also the allele frequency, the value of which is pivotal when reporting diagnostic findings (11). Automated DNA extraction systems are helpful in a routine laboratory with respect to expenditure of time, sample tracking and reproducible sample quality. In addition, an accurate and reliable DNA quantification system is necessary for good and constant MPS performance (12). In the present study, we compared three different MPS platforms: PGM Ion Torrent™ from Life Technologies™, MiSeq™ from Illumina® and GS Junior from Roche. We used lung cancer samples, obtained from the clinical setting, with a known EGFR and KRAS mutation status. Samples included large tumour resections, as well as small fine needle biopsies. In our comparison, three different multiplex primer panels, tailored to the needs of the respective sequencing platforms were used in the participating institutes, mirroring the individual approaches that may be used for routine testing. Materials and methods Samples. A total of 30 tumour samples was collected from 2010 to 2013. All samples were lung adenocarcinomas and each institute contributed 10 samples. Tumours were diagnosed by experienced pathologists and the tumour content was determined by the visual inspection of hematoxylin and eosin (H&E)-stained corresponding sections. The mutation status of the samples was determined previously in routine molecular diagnostics in each institute using conventional methods. DNA isolation. All tissue specimens were fixed in neutral‑buffered formalin prior to paraffin embedding (FFPE samples). Tumour areas were marked by a pathologist on an H&E-stained slide and DNA was extracted from corresponding unstained 10‑µm‑thick slides by manual macrodissection. Following treatment with proteinase K, the DNA was isolated by either automated or manual extraction: BioRobot M48 (institute A), the QIAamp DNA FFPE Tissue kit (institute B), QIASymphony SP (institute C) (all from Qiagen, Hilden, Germany) or the Maxwell 16 Research system (institute C; Promega, Madison, WI, USA) following the manufacturer's instructions. DNA quality and quantity. The quality and quantity of the isolated DNA samples were assessed by agarose gel electrophoresis and measured fluorimetrically using the Qubit® HS DNA assay (Life Technologies, Darmstadt, Germany) in institute A. The quantity of the isolated DNA was measured spectrophotometrically using the NanoDrop 2000c spectrophotometer (Thermo Fisher Scientific, Waltham, MA, USA) in institute B. In institute C, the DNA content was measured fluorimetrically using the Qubit HS DNA assay (Life Technologies) and using a qPCR-based method (RNaseP Detection system; Life Technologies). Massive parallel sequencing Illumina® MiSeq™ platform. MiSeq (Illumina, San Diego, CA, USA) was used in institute A. The custom‑made lung cancer panel consisted of 102 amplicons for the detection of hotspot mutations in 14 lung cancer-related genes. A full list of the
covered amplicons is provided in Table I. Isolated DNA (20 ng) was amplified with 2 customised Ion AmpliSeq™ Primer Pools for 15 sec at 99˚C and 4 min at 60˚C for 29 cycles, with an initial denaturating step at 99˚C for 2 min. PCR products from the same patient were pooled following treatment with FuPa reagent. Following purification with Agencourt AMPure XP (Beckman Coulter, Brea, CA, USA), the PCR products were incubated with NEXTflex™ DNA Adenylation Mix (Bioo Scientific Corp., Austin, TX, USA). Adapters were supplied by NEXTflex™ DNA Barcodes (Bioo Scientific Corp.). After the bead-mediated size selection, NEXTflex™ PCR Master Mix (Bioo Scientific Corp.) was used for the final PCR amplification at 98˚C for 15 sec and 60˚C for 1 min for 10 cycles, with an initial denaturating step at 98˚C for 2 min. Library products were quantified using a Qubit ® 2.0 Fluorometer (Qubit ® dsDNA HS kit; Life Technologies), diluted and pooled in equal amounts. A total of 6-8 pM was spiked with 5% PhiX DNA and sequenced using the MiSeq™ reagent kit V2 (300 cycles) (both from Illumina). Data were exported as FASTQ files. GS Junior platform. GS Junior (Roche, Basel, Switzerland) was used in institute B. Genomic DNA (10-250 ng) was used for the amplification of EGFR exons 18-21 in a single multiplex reaction using the EGFR 18-21 MASTR assay and the 454 MID kit 1-8 (both from Multiplicom N.V., Niel, Belgium) according to the manufacturer's instructions. Libraries were purified, quantified, diluted to a final concentration of 1x10⁶ molecules, multiplexed, clonally amplified by emulsion PCR and sequenced on the GS Junior (Roche) following the manufacturer's instructions. Amplicon libraries were sequenced in two runs on 454 GS Junior with 15 samples each. PGM Ion Torrent platform. PGM Ion Torrent (Life Technologies) was used in institute C. For library preparation, the multiplex PCR-based Ion Torrent™ AmpliSeq™ technology (Life Technologies) with a custom-made lung cancer panel was used. The panel consisted of 139 primer pairs for the detection of hotspot mutations in 41 lung cancer‑related genes. A full list of the covered amplicons is provided in Table I. Amplicon library preparation was performed with the Ion AmpliSeq™ Library kit v2.0 using approximately 10 ng of DNA as advised by the manufacturer. The PCR cycling conditions were as follows: initial denaturation: 99˚C for 2 min, cycling: 21 cycles of 99˚C, 15 sec and 60˚C, 4 min. PCR products were partially digested using FuPa reagent as instructed, followed by the ligation of barcoded sequencing adapters (Ion Xpress Barcode Adapters 1-16 kit; Life Technologies). The final library was purified using Agencourt AMPure XP magnetic beads (Beckman Coulter) and quantified using qPCR (Ion Library Quantitation kit) on a StepOne qPCR machine (both from Life Technologies). The individual libraries were diluted to a final concentration of 100 pM and eight to ten libraries were pooled and processed to library amplification on Ion Spheres using an Ion PGM™ Template OT2 200 kit. Unenriched libraries were quality-controlled using Ion Sphere quality control measurement on a Qubit instrument. Following library enrichment (Ion OneTouch ES), the library was processed for sequencing using the Ion Torrent 200 bp sequencing v2 chemistry and the barcoded libraries were loaded onto a single 318 chip.
INTERNATIONAL JOURNAL OF MOLECULAR MEDICINE 36: 1233-1243, 2015
Table I. Continued.
Table I. Overview of the institute-specific gene panels. Chromosome
From (hg19)
Custom panel Heidelberg chr1 27056234 chr1 27057662 chr1 27057875 chr1 27092899 chr1 27094337 chr1 27099336 chr1 27100275 chr1 27105906 chr1 27106449 chr1 27106750 chr1 115256484 chr1 115258676 chr1 150549826 chr1 150551531 chr2 178098765 chr3 41266029 chr3 41266893 chr3 41275089 chr3 178916892 chr3 178921523 chr3 178928050 chr3 178936022 chr3 178938830 chr3 178952038 chr3 181430178 chr3 181430516 chr4 1803550 chr4 1808277 chr4 55131108 chr4 55139749 chr4 55140692 chr4 55141036 chr4 55152001 chr4 55156632 chr4 55592107 chr4 55593595 chr4 153245407 chr4 153247237 chr4 153249405 chr5 1264501 chr5 1293392 chr6 66115100 chr6 66204680 chr7 55241602 chr7 55242411 chr7 55248974 chr7 55259416 chr7 92300724 chr7 92403995 chr7 116411944 chr7 116417426 chr7 140453110 chr7 140481387 chr8 38275705 chr8 38282107 chr8 128751156 chr8 128752956 chr9 5069993 chr9 5073678 chr9 5126715 chr9 21970912
1235
To (hg19)
Gene name
Exon
27056365 27057775 27058001 27093023 27094460 27099464 27100411 27106030 27106570 27106883 115256587 115258805 150549952 150551670 178098890 41266147 41267010 41275211 178917000 178921633 178928160 178936106 178938960 178952157 181430283 181430649 1803636 1808409 55131222 55139881 55140818 55141156 55152128 55156764 55592203 55593684 153245522 153247369 153249530 1264634 1293528 66115214 66204810 55241732 55242544 55249100 55259546 92300853 92404124 116412066 116417508 140453232 140481511 38275835 38282241 128751293 128753086 5070100 5073788 5126797 21971032
ARID1A ARID1A ARID1A ARID1A ARID1A ARID1A ARID1A ARID1A ARID1A ARID1A NRAS NRAS MCL-1 MCL-1 NFE2L2 CTNNB1 CTNNB1 CTNNB1 PIK3CA PIK3CA PIK3CA PIK3CA PIK3CA PIK3CA SOX2 SOX2 FGFR3 FGFR3 PDGFRA PDGFRA PDGFRA PDGFRA PDGFRA PDGFRA KIT KIT FBXW7 FBXW7 FBXW7 TERT TERT EYS EYS EGFR EGFR EGFR EGFR CDK6 CDK6 MET MET BRAF BRAF FGFR1 FGFR1 MYC MYC JAK2 JAK2 JAK2 CDKNA2
2 3 3 10 11 14 17 20 20 20 3 2 3 1 2 3 5 9 2 5 8 10 14 21 1 1 7 16 5 10 11 12 18 22 9 11 11 10 9 11 2 7 5 18 19 20 21 5 3 14 16 15 11 10 7 2 3 12 14 25 2
Chromosome chr9 chr9 chr9 chr9 chr9 chr9 chr10 chr10 chr10 chr10 chr10 chr10 chr10 chr10 chr11 chr11 chr11 chr11 chr11 chr11 chr11 chr12 chr12 chr12 chr12 chr13 chr13 chr13 chr13 chr13 chr13 chr13 chr13 chr13 chr13 chr13 chr14 chr14 chr14 chr17 chr17 chr17 chr17 chr17 chr17 chr17 chr17 chr17 chr17 chr18 chr18 chr18 chr18 chr19 chr19 chr19 chr19 chr19 chr19 chr19 chr19 chr19
From (hg19)
To (hg19)
Gene name
Exon
21971086 21974672 139401722 139404170 139412260 139413034 89624207 89685258 89692864 89711806 89717622 89720778 123256020 123279495 533800 534220 69456096 69458624 119103162 119148912 119149215 25380249 25398183 69210596 69233038 48881433 48916793 48923124 48951050 48954320 48955427 49027105 49033834 49037844 49039144 49039304 36987081 36988227 105246470 7573886 7576836 7577028 7577492 7578180 7578425 7579278 7579454 37880169 37880958 48581196 48584702 48591813 48604680 1206977 1218379 1220390 1220594 1221205 1223020 10599879 10600372 10602263
21971218 21974792 139401834 139404306 139412400 139413159 89624322 89685374 89692987 89711936 89717747 89720902 123256129 123279622 533929 534349 69456216 69458747 119103275 119149006 119149290 25380348 25398310 69210679 69233165 48881526 48916902 48923208 48951160 48954437 48955539 49027191 49033935 49037955 49039221 49039410 36987213 36988351 105246589 7574019 7576950 7577157 7577629 7578289 7578555 7579397 7579566 37880287 37881089 48581323 48584826 48591934 48604811 1207113 1218488 1220504 1220684 1221340 1223155 10600011 10600496 10602390
CDKNA2 CDKNA2 NOTCH1 NOTCH1 NOTCH1 NOTCH1 PTEN PTEN PTEN PTEN PTEN PTEN FGFR2 FGFR2 HRAS HRAS CCND1 CCND1 CBL CBL CBL KRAS KRAS MDM2 MDM2 RB1 RB1 RB1 RB1 RB1 RB1 RB1 RB1 RB1 RB1 RB1 NKX-2.1 NKX-2.1 AKT1 TP53 TP53 TP53 TP53 TP53 TP53 TP53 TP53 ERBB2 ERBB2 SMAD4 SMAD4 SMAD4 SMAD4 STK11 STK11 STK11 STK11 STK11 STK11 KEAP1 KEAP1 KEAP1
2 1 22 18 8 6 1 3 5 6 7 8 13 7 3 2 1 3 2 8 9 3 2 4 11 2 3 6 13 16 17 18 20 21 22 23 2 1 3 10 9 8 7 6 5 4 4 19 20 5 7 9 12 1 2 4 5 6 8 5 4 3
FASSUNKE et al: UTILITY OF DIFFERENT MASSIVELY PARALLEL SEQUENCING PLATFORMS
1236 Table I. Continued. Chromosome
From (hg19)
Table I. Continued. To (hg19)
Gene name
chr19 10602579 10602708 KEAP1 chr19 10602796 10602912 KEAP1 chr19 10610088 10610218 KEAP1 chr19 10610289 10610416 KEAP1 chr19 10610465 10610599 KEAP1 chr19 11094812 11094945 SMARCA4 chr19 11136088 11136220 SMARCA4 chr19 11138426 11138556 SMARCA4 chr19 11141448 11141561 SMARCA4 chr19 11144042 11144179 SMARCA4 chr19 30308024 30308156 CCNE1 chr19 30313134 30313262 CCNE1 chrX 47028755 47028888 RBM10 chrX 47034396 47034523 RBM10 chrX 63411268 63411399 FAM123B/ AMER1 chrX 63412836 63412964 FAM123B/ AMER1 Custom panel Cologne chr1 115256352 chr1 115256453 chr1 115256550 chr1 115258676 chr1 162688829 chr1 162722872 chr1 162724359 chr1 162724466 chr1 162724586 chr1 162724850 chr1 162724967 chr1 162725447 chr1 162729566 chr1 162729681 chr1 162730973 chr1 162731107 chr1 162731197 chr1 162735765 chr1 162736904 chr1 162737029 chr1 162740090 chr1 162740201 chr1 162741756 chr1 162741887 chr1 162742002 chr1 162743204 chr1 162743301 chr1 162745384 chr1 162745513 chr1 162745915 chr1 162746038 chr1 162748317 chr1 162748432 chr1 162749866 chr1 162749977 chr2 29432650 chr2 29436843 chr2 29443565 chr2 29443688 chr2 29445200 chr2 29445369 chr3 41266072
115256453 115256550 115256672 115258798 162688951 162722995 162724466 162724586 162724687 162724967 162725094 162725572 162729694 162729782 162731107 162731197 162731276 162735879 162737029 162737154 162740201 162740327 162741887 162742002 162742088 162743301 162743421 162745513 162745634 162746038 162746162 162748432 162748519 162749977 162750066 29432776 29436974 29443688 29443772 29445332 29445489 41266193
NRAS NRAS NRAS NRAS DDR2 DDR2 DDR2 DDR2 DDR2 DDR2 DDR2 DDR2 DDR2 DDR2 DDR2 DDR2 DDR2 DDR2 DDR2 DDR2 DDR2 DDR2 DDR2 DDR2 DDR2 DDR2 DDR2 DDR2 DDR2 DDR2 DDR2 DDR2 DDR2 DDR2 DDR2 ALK ALK ALK ALK ALK ALK CTNNB1
Exon 3 3 2 2 2 2 22 23 25 26 5 10 3 5 1 1
3 3 3 2 3 4 5 5 5 6 6 7 8 8 9 9 9 10 11 11 12 12 13 13 13 14 14 15 15 16 16 17 17 18 18 25 24 23 23 22 21 3
Chromosome
From (hg19)
To (hg19)
Gene name
Exon
chr3 178935940 178936023 PIK3CA chr3 178936023 178936105 PIK3CA chr3 178936092 178936180 PIK3CA chr3 178951824 178951942 PIK3CA chr3 178951942 178952063 PIK3CA chr3 178952063 178952155 PIK3CA chr7 55241596 55241679 EGFR chr7 55241679 55241800 EGFR chr7 55242411 55242539 EGFR chr7 55248984 55249117 EGFR chr7 55249117 55249200 EGFR chr7 55259367 55259486 EGFR chr7 55259484 55259567 EGFR chr7 116411701 116411801 cMET chr7 116411801 116411909 cMET chr7 116411894 116411998 cMET chr7 116411998 116412072 cMET chr7 140453023 140453099 BRAF chr7 140453099 140453224 BRAF chr7 140481297 140481387 BRAF chr7 140481387 140481511 BRAF chr10 89624207 89624322 PTEN chr10 89653745 89653817 PTEN chr10 89653816 89653930 PTEN chr10 89685258 89685374 PTEN chr10 89690819 89690917 PTEN chr10 89692713 89692819 PTEN chr10 89692819 89692920 PTEN chr10 89692920 89693032 PTEN chr10 89711802 89711928 PTEN chr10 89711917 89712018 PTEN chr10 89717580 89717695 PTEN chr10 89717694 89717792 PTEN chr10 89720692 89720768 PTEN chr10 89720769 89720842 PTEN chr10 89724948 89725061 PTEN chr10 89725058 89725147 PTEN chr10 89725207 89725320 PTEN chr12 25380167 25380240 KRAS chr12 25380240 25380357 KRAS chr12 25398183 25398304 KRAS chr12 25398304 25398379 KRAS chr14 105246406 105246502 AKT1 chr14 105246500 105246583 AKT1 chr15 66727356 66727487 MAP2K1 chr15 66727487 66727602 MAP2K1 chr17 7577017 7577142 TP53 chr17 7577140 7577233 TP53 chr17 7577392 7577509 TP53 chr17 7577508 7577611 TP53 chr17 7578141 7578234 TP53 chr17 7578234 7578362 TP53 chr17 7578310 7578425 TP53 chr17 7578425 7578555 TP53 chr17 7579278 7579385 TP53 chr17 7579385 7579502 TP53 chr17 7579502 7579590 TP53 chr17 37880155 37880283 HER2 chr17 37880960 37881074 HER2 chr17 37881074 37881206 HER2
9 9 9 20 20 20 18 18 19 20 20 21 21 intron 13/14 14 intron 13/14 14 15 15 11 11 1 2 2 3 4 5 5 5 6 6 7 7 8 8 9 9 9 3 3 2 2 4 4 2 2 8 8 7 7 6 6 5 5 4 4 4 19 20 20
INTERNATIONAL JOURNAL OF MOLECULAR MEDICINE 36: 1233-1243, 2015
Data analysis Illumina MiSeq platform. The FASTQ files were aligned against reference NCBI build 37 (hg19) and annotated using a modified version of a previously described method (13). The resulting BAM files were visualized using the Integrative Genomics Viewer (IGV; http://www.broadinstitute.org/ igv/). Called variants were then imported into a FileMaker (FileMaker GmbH, Germany) database for further analysis, annotation and reporting. A 5% cut-off for variant calls was used and the results were only interpreted if the coverage was >100x. GS Junior platform. Alignment against reference NCBI build 37 (hg19) and variant calling was carried out using AVA software (Roche). Thresholds for variant calling were set to a minimum allele frequency of 5% with a coverage of at least 100x. All variants were visually inspected using the AVA software (Roche). Annotation of variants was done according to the HGVS nomenclature. PGM Ion Torrent platform. Raw data processing, sequence generation and alignment to the reference hg19 genome were conducted using the Torrent Suite software (version 4.0; Life Technologies). Variants were identified using the variant caller plug-in package. For hotspot mutations, a minimum allele frequency of 3% was set and for novel mutations, at least a 5% allele frequency was set as the cut-off level (with coverage >100x). Annotation of variants was performed with the CLC genomics workbench (version 6.5) followed by the visual inspection of putative mutations using the IGV browser. Results DNA concentration. DNA extraction from the 30 NSCLC samples was carried out with three different DNA extraction systems and the DNA concentration was measured using individual methods as described above. Table II summarises the resulting DNA concentrations. While the DNA concentration ranges measured with the Qubit 2.0 fluorometer in institutes A and C were comparable, the values measured using the NanoDrop 2000c spectrophotometer in institute B were generally higher due to the different principles of measurement. We observed a 1.4- to 856-fold and a 3.9- to 156-fold difference in the concentrations of institute B compared with the concentration values in institutes A and C, respectively with average differences of 133- and 30-fold. Particulary in samples with concentrations below 10 ng/µl, the measurements showed high deviations (Table II). Although only minimal amounts of DNA were measured in some samples from institutes A and C, the maximum volume possible was used for the massive parallel analysis for comparative purposes. Platform comparison summary. The median amplicon sizes for all platforms ranged from 125-345 bp, allowing the amplification of target sequences from degraded DNA obtained from FFPE material (Table III). The number of analysed amplicons ranged from 4 up to 137. Depending on the platform used, the number of samples analysed in one single run varied from 8 up to 48. The maximum number of median reads per sample was approximately 500.000 on the PGM followed by approximately 350.000 on the MiSeq and 5007 reads on the GS Junior. In general, the read coverage for each amplicon was
1237
Table II. DNA concentration. Institute A Sample no. (ng/µl) 1 2 3 4 5 6 7 8 9 10 11 12 13 14 15 16 17 18 19 20 21 22 23 24 25 26 27 28 29 30
31 2.9 3.32 0.1 12.8 7.5 16.6 2.44 26.6 0.1 10.3 5.7 8.06 4.56 2.06 2.7 1.29 3.78 0.1 8.8 0.1 18.4 0.83 0.97 0.16 0.3 0.24 0.1 0.1 0.1
Institute B (ng/µl)
Institute C (ng/µl)
362.9 7.84 109.16 4.03 186.49 14.92 374.76 24.24 504.4 3.61 26.1 266.83 11.58 21.62 28.72 15.64 25.68 17.32 19.24 204.08 1.3 470.92 204.61 52.5 103.01 103.01 60.02 85.57 47.74 56.77
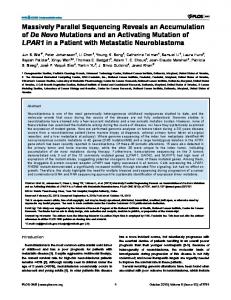
20.8 0.85 7.81 0.41 11.7 1.15 4.55 1.48 44.8 A or T>C substitutions. The results included besides other variants different hotspot mutations such as BRAF c.1406G>A, p.G469E [allele frequency (AF), 51%; coverage (cov), 6813], PIK3CA c.1633G>A, p.E545K (AF, 18%; cov, 6190) and NRAS c.178G>A, p.G60R (AF, 39%; cov, 2187) (Table V and Fig. 2). For verification, the respective regions were reanalysed with Sanger sequencing as previously described (14). The muta-
tions could not be confirmed and were categorized as fixation artefacts. Discussion In routine pathological diagnostics mostly FFPE material is available for molecular characterisation. With decreasing sample sizes and increasing numbers of molecular analyses, a targeted sequencing approach using MPS systems seems to be required. Since it is well known that DNA extracted from FFPE is degraded, with a maximum size of about 350 bp (15), approaches such as whole genome, transcriptome or exome
1240
FASSUNKE et al: UTILITY OF DIFFERENT MASSIVELY PARALLEL SEQUENCING PLATFORMS
Table V. Additional variations. Case Gene 1 2 3 4 5
Nucleotide change
AA change
- - - TP53 c.469G>T p.V157F TP53 c.637C>T p.R213* - - - NKX2.1 c.515A>C p.Q172P RB1 c.2267delA p.Y756fs TP53 c.733G>T p.G245C 6 TP53 c.641A>G p.H214R 7 TP53 c.830G>T p.C277F 8 - - - 9 KRAS c.35G>A p.G12D 10 11 TP53 c.1073C>T p.P295S JAK3 c.2164G>A p.V722I 12 TP53 c.610G>T p.E204* 13 - - - 14 ATM c.2572T>C p.F858L 15 TP53 c.913A>T p.K305 KIT c.1621A>C p.M541L 16 SMO c.979G>A p.A327T 17 - - - 18 TP53 c.530C>G p.P177R 19 TP53 c.725G>A p.C242Y TP53 c.555C>G p.S185R KIT c.1621A>C p.M541L PIK3CA c.1633G>A p.E545K 20 - - - 21 PIK3CA c.1624G>A p.E542K 22 CTNNB1 c.98C>G p.S33C 23 NOTCH1 c.3604C>T p.P1202S RBM10 c.79delG p.G27fs 24 - - - 25 SMARCA4 c.3634G>A p.E1212K KRAS c.35G>A p.G12D 26 KRAS c.35G>A p.G12D 27 KEAP1 c.1426G>T p.G476W MAP2K1 c.171G>T p.K57N 28 CDK6 c.584G>T p.S195I CDKN2A c.253C>T p.Q85 29 HRAS c.59C>T p.T20I BRAF c.1406G>A p.G469E NRAS c.178G>A p.G60R PIK3CA c.1633G>A p.E545K 30 - - -
AF A (%)
AF C (%)
- 80 79 - n.i. n.i. 87 33 23 - 2 n.a. 1 n.i. 7 - n.i. 26 n.i. n.i. n.a. 26 81 73 n.i. 44 - 18 33 n.i. n.i. - n.i./n.a. n.a. 26 n.i. 45 n.i. n.i. n.i. FA FA FA -
79 34 23 91 91 23 44 5 n.a. 5 37 25 66 20 57 45 8 34 n.i. 78 4 17 31 5 17 5 10 29 45 n.i. 13 6 5 -
Besides the epidermal growth factor receptor (EGFR) mutations, additional mutations could be identified with the extended primer sets used in institutes A and C. Concordance was found in 15 additional variations whereas 16 variants could not be confirmed by the other institute due to missing primer panel inclusion. Fixation artefacts were observed in sample 29. AA, amino acid; AF, allele frequency; FA, fixation artefact; n.a., not analysable; n.i., not included in primer panel; -, no variant found.
Figure 2. Fixation artefacts. In our cohort, sample 29 showed a high number of variants after the bioinformatic analysis in institute A. Hotspot mutations in BRAF, NRAS and PIK3CA were selected for validation by Sanger sequencing. The mutations could not be confirmed and were therefore assessed to be fixation artefacts. AF, allele frequency; cov, coverage.
sequencing are, besides being labour‑intensive and expensive, not suitable for routine diagnostics. Targeted sequencing with the focus on hotspot regions is suitable for analysing FFPE material, in a cost-effective and technically feasible way. Comparing the benchtop systems available for parallel sequencing, they show all method-specific advantages and disadvantages. The 454 GS Junior has a low throughput, but generates at the same time long runs (16,17). The Ion Torrent PGM™ is a cost-saving and fast system, but has a limited accuracy in homopolymeric regions, which also applies to the 454 GS Junior (1,16). The MiSeq has a very high throughput and low error rates, but the runtime is long (17) and it needs a higher number of samples per run to be cost efficient. In this study, in comparing 30 lung cancer samples with three different MPS platforms, we observed good concordance in the detection of mutations using different DNA extraction methods, quantification systems and individually designed primer panels. All institutes analysed 26 out of 26 samples accurately concerning the EGFR status. Independently of the downstream methods used, the crucial step in mutation analyses from tumour material is macrodissection and therewith the selection of the right areas. A tumour burden of 40% is recommended for Sanger sequencing (18). As MPS is more sensitive than Sanger sequencing, the amount of tumour cells required may be lower (19,20). Samples with low tumour cell content are at risk of being reported as false-negative. In contrast to our results (21) found no correlation between H&E-based morphologic assessment of tumour burden and
INTERNATIONAL JOURNAL OF MOLECULAR MEDICINE 36: 1233-1243, 2015
Figure 3. Minor variants. Minor variants could be detected in two out of 30 samples in institute A (nos. 12 and 23). The resistance mutation p.T790M in EGFR was found with 1.03 and 1.42% AF with a coverage of 34779 and 10246. AF, allele frequency; cov, coverage.
the actual mutant allele frequency. In our cohort, the absolute allele frequencies for certain variants showed differences between the three laboratories, depending mainly on the selection of the macrodissected area. Restricted marking of tumour cells increases the detection thresholds, which may be critical for variants with low allele frequencies. Unfortunately at the same time there is an enhanced risk of ‘mispicking’ during the manual dissecting process. The important role of manual macrodissection is also emphasized by Ausch et al because the combination of the content of tumour cells and the allele frequency leads to the diagnostic study (22). We recommend a careful pathologic review of each individual case because the minimum percentage of tumour cells for doubtless results has not yet been defined (23). From our results, we suggest a tumour cell burden of at least 10%, which can also be reached in small biopsies. Through the development of minimally invasive techniques biopsy sizes are decreasing. This is in contrast to the ever increasing demands of immunohistochemistry stainings and molecular analyses. Minimally invasive biopsies often deliver insufficient amounts of tissue material for subsequent analyses. We included one extra small tissue sample (no. 10) on purpose, which was originally difficult to analyse by conventional methods, to explore how the different MPS systems would cope with such a sample. None of the institutes were able to extract sufficient DNA for a reliable molecular analysis using next-generation sequencing (NGS) technologies.
1241
In institute A, two further samples could not be analysed due to the high salt concentrations in BioRobot M48 extracts (12). The multiplex PCR for the library generation was inhibited and samples failed completely. Institute B could not analyse two samples as well due to strong DNA degradation. This can be attributed to the manual extraction method chosen byin institute B as it has been reported that automated nucleic acid extraction ensures a standardisation of sample processing and decreases time and variability in the clinical laboratory (24,25). Additionally, it is well known that manual extraction delivers less DNA than automated extraction (26). In this study, a comparison of the total DNA amounts is not possible due to the different systems used for measuring of DNA concentration. In institute C, using the automated QIASymphony SP system, only one sample failed. This extraction system was previously shown to generate DNA extracts with higher quality and concentration [Heydt et al (12)]. In FFPE material, non-reproducible sequence artefacts caused by DNA deamination induced by the sample fixation are frequently detected by all sequence analysis methods. The characteristic nucleotide transitions G>A and T>C had been found by several groups (27-29). Sequence artefacts arising from FFPE DNA are especially problematic when only limited amounts of template DNA are used for PCR amplification [Wong et al (29)]. In one of our samples, we detected mutations in hotspot regions with the typical C>T and G>A exchange which could not be validated by Sanger sequencing although they had sufficient allele frequency and coverage in MPS (Fig. 2). Since the fixation artefacts are amplified during all PCR-based methods and appear as false-positive variants, it is advisable to reduce the DNA amplification steps during mutational analyses. Hybrid selection methods like Nanostring® or SureSelect (Agilent Technologies) work without a preamplification step. Also, an approach from Udar et al where the two DNA strands were processed individually minimises fixation artefacts (30). Two independent libraries were combined and sequenced on the MiSeq (Illumina) instrument. Variant frequencies were calculated using information from both strands and are narrowed down. Notably, the KRAS mutation (c.35G>A, p.G12D) in sample nine, which could also be attributed to a fixation artefact, was identified by two institutes with allele frequencies of 2.36 and 5% confirming the true nature of this mutation (Table V). Most of the artefacts appear once but not in duplicates so one solution to detect C>T (and G>A) sequence artefacts when using FFPE-DNA is to prepare analysis in duplicates. Verification of such low allele frequencies with an alternative method is a challenge, because most methods (Sanger sequencing, high resolution melting) have a higher detection limit than MPS. The majority of patients with lung cancer receiving EGFR‑tyrosine kinase inhibitor (TKI) therapy acquire resistance after a median of 10-16 months (31). Intense study in these NSCLCs has identified two major mechanisms of developing resistance to first generation TKIs: secondary resistance mutations within the same gene and ‘oncogene kinase switch’ systems with an overlap into another pathway (32). Also, new sensitive detection methods like MPS have identified a proportion of TKI-naive tumours that carry the secondary resistance mutation p.T790M in the EGFR gene; these resistant clones
1242
FASSUNKE et al: UTILITY OF DIFFERENT MASSIVELY PARALLEL SEQUENCING PLATFORMS
may be selected after exposure to TKI inhibitors (32-35). In institute A, two samples (nos. 12 and 23) with minor clones for the EGFR resistance mutation p.T790M were found (Table IV). Due to the low allele frequency, validation with Sanger sequencing seemed to be impossible. We therefore used a qPCR approach with a detection limit of 1%. Neither the DNA extracts from institutes B and C, nor the newly prepared or the primary DNA extracts from institute A, showed the resistance mutation (data not shown). Therefore, for the analysis of DNA from FFPE tissues, a general detection limit of 5% seems to balance sensitivity vs. reproducibility. Acknowledgements We thank Professor Wolfgang Hartmann (Institute of Pathology, University Hospital Muenster) for performing the pathological review of clinical material. References 1. Endris V, Penzel R, Warth A, Muckenhuber A, Schirmacher P, Stenzinger A and Weichert W: Molecular diagnostic profiling of lung cancer specimens with a semiconductor-based massive parallel sequencing approach: feasibility, costs, and performance compared with conventional sequencing. J Mol Diagn 15: 765-775, 2013. 2. Clinical Lung Cancer Genome Project (CLCGP); Network Genomic Medicine (NGM): A genomics-based classification of human lung tumors. Sci Transl Med 5: 209ra153, 2013. 3. Ulahannan D, Kovac MB, Mulholland PJ, Cazier JB and Tomlinson I: Technical and implementation issues in using next-generation sequencing of cancers in clinical practice. Br J Cancer 109: 827-835, 2013. 4. Hagemann IS, Devarakonda S, Lockwood CM, Spencer DH, Guebert K, Bredemeyer AJ, Al-Kateb H, Nguyen TT, Duncavage EJ, Cottrell CE, et al: Clinical next-generation sequencing in patients with non-small cell lung cancer. Cancer 121: 631-639, 2015. 5. Tops BB, Normanno N, Kurth H, Amato E, Mafficini A, Rieber N, Le Corre D, Rachiglio AM, Reiman A, Sheils O, et al: Development of a semi-conductor sequencing-based panel for genotyping of colon and lung cancer by the Onconetwork consortium. BMC Cancer 15: 26, 2015. 6. Han JY, Kim SH, Lee YS, Lee SY, Hwang JA, Kim JY, Yoon SJ and Lee GK: Comparison of targeted next-generation sequencing with conventional sequencing for predicting the responsiveness to epidermal growth factor receptor-tyrosine kinase inhibitor (EGFR-TKI) therapy in never-smokers with lung adenocarcinoma. Lung Cancer 85: 161-167, 2014. 7. de Koning TJ, Jongbloed JD, Sikkema-Raddatz B and Sinke RJ: Targeted next-generation sequencing panels for monogenetic disorders in clinical diagnostics: the opportunities and challenges. Expert Rev Mol Diagn 15: 61-70, 2014. 8. Meldrum C, Doyle MA and Tothill RW: Next-generation sequencing for cancer diagnostics: A practical perspective. Clin Biochem Rev 32: 177-195, 2011. 9. Sikkema-Raddatz B, Johansson LF, de Boer EN, Almomani R, Boven LG, van den Berg MP, van Spaendonck-Zwarts KY, van Tintelen JP, Sijmons RH, Jongbloed JD and Sinke RJ: Targeted next-generation sequencing can replace Sanger sequencing in clinical diagnostics. Hum Mutat 34: 1035-1042, 2013. 10. Snow AN, Stence AA, Pruessner JA, Bossler AD and Ma D: A simple and cost-effective method of DNA extraction from small formalin-fixed paraffin-embedded tissue for molecular oncologic testing. BMC Clin Pathol 14: 30, 2014. 11. Marchetti I, Iervasi G, Mazzanti CM, Lessi F, Tomei S, Naccarato AG, Aretini P, Alberti B, Di Coscio G and Bevilacqua G: Detection of the BRAF(V600E) mutation in fine needle aspiration cytology of thyroid papillary microcarcinoma cells selected by manual macrodissection: an easy tool to improve the preoperative diagnosis. Thyroid 22: 292-298, 2012.
12. Heydt C, Fassunke J, Künstlinger H, Ihle MA, König K, Heukamp LC, Schildhaus HU, Odenthal M, Büttner R and Merkelbach-Bruse S: Comparison of pre-analytical FFPE sample preparation methods and their impact on massively parallel sequencing in routine diagnostics. PLoS One 9: e104566, 2014. 13. Peifer M, Fernández-Cuesta L, Sos ML, George J, Seidel D, Kasper LH, Plenker D, Leenders F, Sun R, Zander T, et al: Integrative genome analyses identify key somatic driver mutations of small-cell lung cancer. Nat Genet 44: 1104-1110, 2012. 14. Ihle MA, Fassunke J, König K, Grünewald I, Schlaak M, Kreuzberg N, Tietze L, Schildhaus HU, Büttner R and Merkelbach-Bruse S: Comparison of high resolution melting analysis, pyrosequencing, next generation sequencing and immunohistochemistry to conventional Sanger sequencing for the detection of p.V600E and non-p.V600E BRAF mutations. BMC Cancer 14: 13, 2014. 15. Wang JH, Gouda-Vossos A, Dzamko N, Halliday G and Huang Y: DNA extraction from fresh-frozen and formalin-fixed, paraffin‑embedded human brain tissue. Neurosci Bull 29: 649-654, 2013. 16. Frey KG, Herrera-Galeano JE, Redden CL, Luu TV, Servetas SL, Mateczun AJ, Mokashi VP and Bishop-Lilly KA: Comparison of three next-generation sequencing platforms for metagenomic sequencing and identification of pathogens in blood. BMC Genomics 15: 96, 2014. 17. Loman NJ, Misra RV, Dallman TJ, Constantinidou C, Gharbia SE, Wain J and Pallen MJ: Performance comparison of benchtop high-throughput sequencing platforms. Nat Biotechnol 30: 434-439, 2012. 18. Warth A, Penzel R, Brandt R, Sers C, Fischer JR, Thomas M, Herth FJ, Dietel M, Schirmacher P and Bläker H: Optimized algorithm for Sanger sequencing-based EGFR mutation analyses in NSCLC biopsies. Virchows Arch 460: 407-414, 2012. 19. Moskalev EA, Stöhr R, Rieker R, Hebele S, Fuchs F, Sirbu H, Mastitsky SE, Boltze C, König H, Agaimy A, et al: Increased detection rates of EGFR and KRAS mutations in NSCLC specimens with low tumour cell content by 454 deep sequencing. Virchows Arch 462: 409-419, 2013. 20. Hlinkova K, Babal P, Berzinec P, Majer I, Mikle-Barathova Z, Piackova B and Ilencikova D: Evaluation of 2-year experience with EGFR mutation analysis of small diagnostic samples. Diagn Mol Pathol 22: 70-75, 2013. 21. Portier BP, Kanagal-Shamanna R, Luthra R, Singh R, Routbort MJ, Handal B, Reddy N, Barkoh BA, Zuo Z, Medeiros LJ, et al: Quantitative assessment of mutant allele burden in solid tumors by semiconductor-based next-generation sequencing. Am J Clin Pathol 141: 559-572, 2014. 22. Ausch C, Buxhofer-Ausch V, Oberkanins C, Holzer B, Minai-Pour M, Jahn S, Dandachi N, Zeillinger R and Kriegshäuser G: Sensitive detection of KRAS mutations in archived formalin-fixed paraffin-embedded tissue using mutant‑enriched PCR and reverse-hybridization. J Mol Diagn 11: 508-513, 2009. 23. Pirker R, Herth FJ, Kerr KM, Filipits M, Taron M, Gandara D, Hirsch FR, Grunenwald D, Popper H, Smit E, et al: Consensus for EGFR mutation testing in non-small cell lung cancer: results from a European workshop. J Thorac Oncol 5: 1706-1713, 2010. 24. Dundas N, Leos NK, Mitui M, Revell P and Rogers BB: Comparison of automated nucleic acid extraction methods with manual extraction. J Mol Diagn 10: 311-316, 2008. 25. Esona MD, McDonald S, Kamili S, Kerin T, Gautam R and Bowen MD: Comparative evaluation of commercially available manual and automated nucleic acid extraction methods for rotavirus RNA detection in stools. J Virol Methods 194: 242-249, 2013. 26. van Eijk R, Stevens L, Morreau H and van Wezel T: Assessment of a fully automated high-throughput DNA extraction method from formalin-fixed, paraffin-embedded tissue for KRAS, and BRAF somatic mutation analysis. Exp Mol Pathol 94: 121-125, 2013. 27. Do H and Dobrovic A: Sequence artifacts in DNA from formalin-fixed tissues: Causes and strategies for minimization. Clin Chem 61: 64-71, 2015. 28. Marchetti A, Felicioni L and Buttitta F: Assessing EGFR mutations. N Engl J Med 354: 526-528, 2006. 29. Wong SQ, Li J, Tan AY, Vedururu R, Pang JM, Do H, Ellul J, Doig K, Bell A, MacArthur GA, et al; CANCER 2015 Cohort: Sequence artefacts in a prospective series of formalin-fixed tumours tested for mutations in hotspot regions by massively parallel sequencing. BMC Med Genomics 7: 23, 2014.
INTERNATIONAL JOURNAL OF MOLECULAR MEDICINE 36: 1233-1243, 2015
30. Udar N, Haigis R, Gros T, Kerry N, Barnes B, Pokholok D, Ross M, Lucio-Eterovic AK, Zhang Q, Zenali M and Jaeger E: A novel technique that distinguishes low-level somatic DNA variants from FFPE-induced artifacts in solid tumors by next‑generation sequencing (NGS). International Association for the Study of Lung Cancer, 2013. 31. Oxnard GR, Arcila ME, Sima CS, Riely GJ, Chmielecki J, Kris MG, Pao W, Ladanyi M and Miller VA: Acquired resistance to EGFR tyrosine kinase inhibitors in EGFR-mutant lung cancer: distinct natural history of patients with tumors harboring the T790M mutation. Clin Cancer Res 17: 1616-1622, 2011. 32. Nguyen KS, Kobayashi S and Costa DB: Acquired resistance to epidermal growth factor receptor tyrosine kinase inhibitors in non-small-cell lung cancers dependent on the epidermal growth factor receptor pathway. Clin Lung Cancer 10: 281-289, 2009.
1243
33. Mok TS, Wu YL, Thongprasert S, Yang CH, Chu DT, Saijo N, Sunpaweravong P, Han B, Margono B, Ichinose Y, et al: Gefitinib or carboplatin-paclitaxel in pulmonary adenocarcinoma. N Engl J Med 361: 947-957, 2009. 34. Rosell R, Molina MA, Costa C, Simonetti S, Gimenez‑Capitan A, Bertran-Alamillo J, Mayo C, Moran T, Mendez P, Cardenal F, et al: Pretreatment EGFR T790M mutation and BRCA1 mRNA expression in erlotinib-treated advanced non‑small-cell lung cancer patients with EGFR mutations. Clin Cancer Res 17: 1160‑1168, 2011. 35. Su KY, Chen HY, Li KC, Kuo ML, Yang JC, Chan WK, Ho BC, Chang GC, Shih JY, Yu SL and Yang PC: Pretreatment epidermal growth factor receptor (EGFR) T790M mutation predicts shorter EGFR tyrosine kinase inhibitor response duration in patients with non‑small-cell lung cancer. J Clin Oncol 30: 433-440, 2012.