Abstract. Shadows are illuminated as a result of Rayleigh scattering phenomenon, which happens to be more effective for small wavelengths of light.
Utilization of False Color Images in Shadow Detection Yagiz Aksoy and A. Aydin Alatan Electrical and Electronics Engineering Department Middle East Technical University 06800, Ankara, Turkey {yaksoy,alatan}@eee.metu.edu.tr
Abstract. Shadows are illuminated as a result of Rayleigh scattering phenomenon, which happens to be more effective for small wavelengths of light. We propose utilization of false color images for shadow detection, since the transformation eliminates high frequency blue component and introduces low frequency near-infrared channel. Effectiveness of the approach is tested by using several shadow-variant texture and colorrelated cues proposed in the literature. Performances of these cues in regular and false color images are compared and analyzed within a supervised system by using a support vector machine classifier.
1
Introduction
In natural outdoor and satellite images, shadows are illuminated as a result of atmospheric scattering of sunlight. There are several scattering phenomenons modeled in the literature [1] and in this work, Rayleigh scattering is assumed to be the most dominant one. In the atmosphere, the amount a light beam is scattered depend on the fourth negative power of the wavelength(λ−4 )[2]. Consecutively, light with shorter wavelengths, such as blue and violet colors, are the most scattered and light with longer wavelengths, such as red color and near-infrared (NIR) illumination, are the least scattered components of the sunlight. Actually, NIR, with a wavelength of around 1000 nm, is scattered 40 times less than blue, with a wavelength of around 400 nm [2]. The main conclusion about shadows one can make from this phenomenon is the saturation of shadows with blue channel. This phenomenon forms the basic assumption of color-related cues for shadow detection proposed in the literature. HSV color space gives important information on shadows. Since blue is the dominant channel in shadow regions, hue channel appears with higher values; whereas saturation channel yields larger intensities due to the saturation of shadows with blue; and value channel results with smaller terms as shadows appear darker. Several shadow maps have been proposed on these assumptions [1,3,4]. As NIR light is scattered the least, color-to-NIR ratios also give important cues on shadows [5]. False color transformation is defined as the use of near-infrared, red and green channels to form a 3-channel image instead of red, green and blue channels. A. Fusiello et al. (Eds.): ECCV 2012 Ws/Demos, Part II, LNCS 7584, pp. 472–481, 2012. c Springer-Verlag Berlin Heidelberg 2012 �
Utilization of False Color Images in Shadow Detection
473
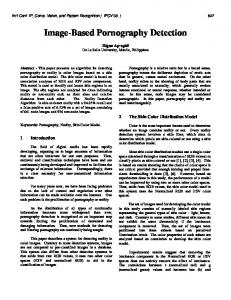
Hence, frequency spectrum of each channel of a 3-channel color image is shifted towards lower frequencies. An image with its false color version can be examined in Figure 1. Since Rayleigh scattering is more effective for high frequencies of light, illumination on shadows is smaller in false color images and shadows are expected to appear more characteristic. As the main contribution of this paper, we propose the use of false color images, instead of regular red - green - blue images, to improve the shadow segmentation performance.
(a) Original Image
(b) False Color Image
Fig. 1. A satellite image and corresponding false color image
Apart from selection of an appropriate color space, another issue is to determine correct features for shadow detection. The main cue for shadows is that shadows appear darker. When illumination is computed as the mean value of three channels for each pixel in a color image, one should expect to have “more darker” shadows in false color images compared to regular images. As another important property, shadows also have important textural characteristics [6]. Since illumination is suppressed in shadows, they are expected to appear smoother than their surroundings. Moreover, they differ from dark-colored objects, as dark objects appear textureless. We also expect to have more characteristic textural properties for shadows, when false color images are utilized. In this effort, we test the effectiveness of proposed approach by utilizing several features proposed in the literature for false color images. A system is constructed to achieve the segmentation in a supervised manner by using a conventional support vector machine classifier. The document is organized as follows. A literature survey is presented in Section 2. Utilized shadow-related cues are detailed in Section 3. Results are shared and discussed in Section 4 and the work is concluded in Section 5.
474
2
Y. Aksoy and A.A. Alatan
Related Work
Polidorio et al. [1] create the shadow map by using the difference between saturation and value channels of HSV color-space image by exploiting the fact that shadows have higher saturation with blue and violet wavelength due to atmospheric scattering. When image channels are in the range [0-1], they threshold the difference between saturation and value channels at zero for airborne sensors and at 0.2 for orbital sensors to get the final shadow map. The values of these thresholds are set globally, and unfortunately, performance of their algorithm highly depends on these values. Vegetation and dark objects are often falsely segmented as shadows in this approach. Tsai [3] uses a hue based approach to identify shadows. By using the same fact about high saturation of shadows with blue and violet colors, Tsai uses HSV color space and assumes hue of shadow pixels will appear high to propose the ratio map (R) seen in (1). Hue + 1 where Hue, V alue ∈ [0 − 1] (1) V alue + 1 This map is thresholded by Otsu’s method to compute the final shadow map. However, Tsai’s method suffers from being unable to differentiate dark objects, such as roads, from shadows, since hue is not very sensitive in darker areas. Chung, Lin and Huang [4] modifies Tsai’s shadow map by using hue and value components scaled to be in the range [0-255] and applying an exponential function shown in (2) to the resultant ratio map to get the modified ratio map R� : ⎧ � � � �2 ⎨ Hue(x,y) Hue < TS exp − V alue(x,y)+1 − TS /4σ2 ∗ 255 if V alue+1 (2) R� (x, y) = ⎩ 255 otherwise TS where, TS is determined by checking at which value of TS the condition i=0 P (i) = PS holds, in which P (i) represents the probability of the value i in the ratio image
TS −1 2 histogram. PS is set to 0.95 empirically and σ is calculated as i=0 P (i)i − TS . They also apply Otsu thresholding to the image and continue with a successive thresholding scheme. They dilate the resultant candidate shadow results by a 3x3 square structuring element and analyze each candidate region iteratively by using a separability factor SB, and if SB is greater than a threshold, which is again set empirically, the resultant region is marked as shadow. Fredembach and S¨ usstrunk [5] propose the use of color-to-NIR ratios together with a darkness map to identify shadows automatically. They define their temporary darkness maps as in (3) and (4) by red, green, blue and NIR channels that are scaled to be in the interval [0-1]. Then, relation in (5) is applied to the temporary maps and final darkness map (D) is computed as in Equation 6. � (3) DV IS = 1 − R2 + G2 + B 2 R=
DN IR = 1 − N IR
(4)
Utilization of False Color Images in Shadow Detection
f (x) =
1
475
e−0.5(x−0.25)
(5)
D = f (DV IS )f (DN IR )
(6)
1+
The authors [5] integrate color information to the system by defining a Color-toNIR ratio image (F), shown in (7), and multiplying darkness and ratio maps to get the final shadow metric (M, seen in (8)). This metric map is then binarized by setting the threshold to the first valley in the histogram of the final shadow map. � � � � Red Green Blue , , F = min max ,1 N IR N IR N IR
(7)
M = DF
(8)
Although Color-to-NIR ratios give important information on shadows, the method [5] might typically result in many falsely labeled shadow pixels, especially in aerial and satellite images. Finlayson, Hordley and Drew [7] remove shadows by a scalar function of a three-channel image, which depends only on the reflectance of a surface. By exploiting the fact that the shadow edges will appear on the regular image, but not in the reflectance-only image, they use the edge map differences of two images to locate shadows. One shortcoming of their approach is the necessity for calibration of cameras. In order to derive the reflectance-only map, their method needs camera calibration and this process needs multiple shots of the static scene in different daylight conditions. In a different approach, Zhu et al. [6] takes the challenge of segmenting shadows from monochromatic images. They propose several textural features, some of which are detailed here, to differentiate shadows from darker objects. The authors [6] claim that smoothness is a shadow-variant feature, since shadows tend to suppress local illumination changes due to low illumination, and hence, appear as smoothed versions of their neighbors. Moreover, local maximum, computed in 3x3 neighborhood, is also an indicator of shadow regions. To differentiate dark objects from shadows, they realize that most of the darker objects appear textureless and propose discrete entropy (E) as a near-black feature, computed by the formula: Ei =
−pi log2 (pi )
(9)
i∈w
where w is 3x3 neighborhood of pixel i and pi is the probability of the histogram counts at pixel i. They train their system using binary conditional random fields and boosted decision trees and reach up to a high recognition rate. However, since their approach does not utilize color information, the performance is limited.
476
3
Y. Aksoy and A.A. Alatan
Shadow Cues
As the main shadow cue, one might use illumination that is computed as the mean value of the three channels that form the image. Illumination of a regular and a false color image can be seen in Figure 2. It can be easily observed that shadows appear darker in the false color image.
(a) Original Image
(b) Regular Illumination
(c) False Color Illum.
Fig. 2. Illumination component in regular and false color images
As texture-based cues, entropy, smoothness and local maximum are utilized as proposed in [6]. Entropy is calculated by (9). Smoothness is calculated by taking the absolute difference between the original illumination scaled to be in the range [0-1] and a Gaussian-smoothed version and subtracting the result from 1. Finally, local maximum is computed as the maximum illumination in a 3x3 neighborhood of each pixel. The resultant maps can be examined in Figure 3.
(a) Entropy
(b) Smoothness
(c) Local Maximum
Fig. 3. Texture-based shadow cue maps of the image in Figure 2a
As color-based cues, difference between saturation and value [1], as well as the ratio between hue and value ratio are utilized. As a final, the relation in (1) is also exploited [3]. The resultant maps are presented in Figure 4. We also use the cue extracted from color-to-NIR ratios that are proposed in [5]. F metric, containing information about only color-to-NIR ratios (see (7)),
Utilization of False Color Images in Shadow Detection
(a) Sat - Value Difference
(b) Hue - Value Ratio
477
(c) Tsai’s Cue
Fig. 4. Color-based shadow cue maps of the image in Figure 2a
(a) F metric (Equation 7)
(b) M metric (Equation 8)
Fig. 5. Color-to-NIR ratio-based cue maps of the image seen in Figure 2a (The results are stretched to [0-255] scale for visualization)
and M metric, the main shadow map proposed (see (8)), were used in the tests. Corresponding maps can be seen in Figure 5.
4
Results
The tests are conducted by training the support vector machine classifier using a total of 400 marked shadow and non-shadow samples and quantitative results are result of a 500x500 test image. These images are obtained from the satellite IKONOS at 1-meter resolution. In order to measure performance, we use precision and recall metrics. Precision, defined in (10), measures the percentage of the successfully classified shadows in the true shadow pixels, where recall, defined in (11), yields the percentage of the successfully classified shadow pixels among all that are classified as shadow. The performance is high when both metrics are as close to one hundred as possible.
478
Y. Aksoy and A.A. Alatan
Table 1. Feature Performances Features RGB False-Color (w/ Illumination) Precision Recall Precision Recall Entropy 97.3 93.9 98.8 96.1 Smoothness 89.4 96.9 97.0 97.9 Local Max 92.2 97.0 97.8 97.8 Sat - Val Difference 88.8 95.9 93.6 98.6 Hue - Val Ratio 81.0 94.6 95.7 97.7 Tsai’s Ratio 94.9 96.3 95.7 97.1 F 96.5 98.4 97.3 98.3 M 96.7 98.4 97.3 98.3 Entropy and M 98.4 97.5 98.7 97.2
P recision (%) =
T rue P ositive ∗ 100 T rue P ositive + F alse N egative
(10)
T rue P ositive ∗ 100 (11) T rue P ositive + F alse P ositive In these relations, T rue P ositive denotes the true shadows that are classified successfully, F alse N egative denotes the true shadows that were erroneously classified as non-shadow and F alse P ositive denotes the true non-shadow pixels that are erroneously classified as shadows. We trained and tested our system by using illumination together with each one of the selected features for both RGB and false color images. Performance of each feature can be seen in Table 1. Notice that for each metric, performance increases with the use of false color image. Textural features and use of color-to-NIR ratios appear to be superior to HSV color space based features. Next, we combine the most successful texture-based feature, entropy, and the most successful color-based feature, M, to achieve a better performance. The maximum performance we could obtain is 98.7 precision and 97.2 recall by the use of illumination, entropy and M in false color. Our test system can easily be utilized as a shadow recognition system initialized with minimal user interaction. Especially in false color, as shadows and non-shadows are easily and linearly separable in the constructed system, with minimal user interaction in one of the images in a database, an effective classifier can be constructed. Figure 7 shows shadow segmentation results in several other images in the same database as the image where the classifier was trained. The results of the algorithms by Polidorio et al. [1], Tsai [3], Chung et al. [4] and Fredembach and S¨ usstrunk [5] together with the results of the proposed algorithm can be observed in Figure 6. The performance of the cited algorithms are presented in Table 2. As large regions, such as roads, are segmented falsely as shadows in Tsai’s and Fredembach’s algorithms, they come up with lower Recall (%) =
Utilization of False Color Images in Shadow Detection
(a) Ground Truth
(b) Our Result
(d) Tsai [3]
(e) Chung et al. [4]
479
(c) Polidorio et al. [1]
(f) Fredembach S¨ usstrunk [5]
and
Fig. 6. Shadow segmentation results of various algorithms
Table 2. Performances of various algorithms Algorithm Precision Recall Polidorio et al. [1] 82.4 97.8 Tsai [3] 53.7 99.5 Chung et al. [4] 78.4 99.1 Fredembach and S¨ usstrunk [5] 53.3 97.9 Proposed 98.7 97.2
precision values. Polidorio’s and Chung’s algorithms perform better; however, as some regions, such as vegetation, are falsely segmented as shadows in these approaches, the precision values are not high. The proposed approach results in quite high precision compared to aforementioned approaches, since challenging regions, such as roads and vegetation, could be eliminated in three dimensional space by a linear classifier. Achieving such a high precision might result in slight decrease in recall.
480
Y. Aksoy and A.A. Alatan
Original Images
Results by Polidorio et al. [1]
Results by Chung et al. [4]
Our Results, using Entropy, M and Illumination in False Color (System is trained from the same 400 samples taken from the image in Figure 2a) Fig. 7. Shadow segmentation results of various algorithms in several images
Utilization of False Color Images in Shadow Detection
5
481
Conclusion
This paper proposes the use of false color images for efficient segmentation of shadows. This claim is tested by using a supervised approach with several shadow-related features and it is shown that for any of the utilized features, use of false color images increases performance remarkably. Moreover, a supervised approach to segment shadows is also proposed and shown to be effective and superior to other state-of-the-art approaches. Acknowledgments. This work is partially supported by HAVELSAN Inc.
References 1. Polidorio, A., Flores, F., Imai, N., Tommaselli, A., Franco, C.: Automatic shadow segmentation in aerial color images. In: XVI Brazilian Symposium on Computer Graphics and Image Processing (SIBGRAPI), pp. 270–277 (2003) 2. Fredembach, C., S¨ usstrunk, S.: Colouring the near infrared. In: Proceedings of the IS&T/SID 16th Color Imaging Conference, pp. 176–182 (2008) 3. Tsai, V.: A comparative study on shadow compensation of color aerial images in invariant color models. IEEE Transactions on Geoscience and Remote Sensing 44, 1661–1671 (2006) 4. Chung, K.L., Lin, Y.R., Huang, Y.H.: Efficient shadow detection of color aerial images based on successive thresholding scheme. IEEE Transactions on Geoscience and Remote Sensing 47, 671–682 (2009) 5. Fredembach, C., S¨ usstrunk, S.: Automatic and accurate shadow detection from (potentially) a single image using near-infrared information. Technical report, EPFL (2010) 6. Zhu, J., Samuel, K., Masood, S., Tappen, M.: Learning to recognize shadows in monochromatic natural images. In: IEEE Conference on Computer Vision and Pattern Recognition (CVPR), pp. 223–230 (2010) 7. Finlayson, G.D., Hordley, S.D., Drew, M.S.: Removing Shadows from Images. In: Heyden, A., Sparr, G., Nielsen, M., Johansen, P. (eds.) ECCV 2002, Part IV. LNCS, vol. 2353, pp. 823–836. Springer, Heidelberg (2002)