Utilization of Numerical Techniques to Predict The Thermal Behavior of Wood Column Subjected to Fire Part C: Sensitivity Analysis Mohamed ElShayeb1, a, Faisal A.Fairag2, Zolman Hari3, Norhaida Ab Razak1, Jacqueline Eng Ling Siang1,b , Zulfika Anuar1 1
Mechanical Eng. Department, College of Eng. 3Science & Maths Department, UNIVERSITI TENAGA NASIONAL, M’sia
2
Mathematic Department, KING FAHD UNIVERSITY OF PETROLEUM AND MINERALS. a
[email protected],
[email protected]
Keywords: Sensitivity Analysis; Wood column; Finite Element Method; Fire Resistance
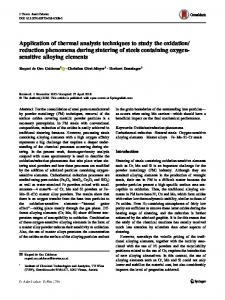
Abstract. Theoretical studies have been carried out to predict the fire resistance of different configuration of wood columns as done in Part A and Part B of this set of research papers. This theoretical study is a continuation of previous studies which were carried out at National Research Council Canada. Mathematical models to calculate the temperatures, deformations and fire resistance of the columns have been developed for Part A and Part B. Calculated results are compared with those measured in several tests. The results indicated that the model is capable of predicting the fire resistance of wood columns with an excellent accuracy. By using the model, the fire resistance of wood columns can be evaluated for any value of the significant parameters such as load, physical dimensions, mechanical properties and even the chemical properties without the necessity of experiment. This research paper carried out sensitivity analysis of a square column at elevated temperature in order to know the effect of some parameters towards the mechanical strength of the column. The parameters that have been studied are initial moisture content, Young’s modules, initial compression stress, specific gravity, thermal conductivity and the physical dimension of the column cross section. Both of the temperature history versus time for the selected elements and the fire resistance has been analyzed using existing results. All the analyses have been carried out for the square cross-section under axial load 1380 kN. Parametric Analysis of wood column Effect of Moisture Content. From the simulation on element 25 (at the corner of the column) the lowest temperature history occurs for 30% moisture content compared to 20% and 12 %. This is because the water will take more time to be evaporated and consume some of the fire energy to convert to vapor or steam. Wood is an excellent thermal insulator. The conduction of heat in wood is directly related to its density. Woods with low density have the highest thermal insulating value because woods contain a high proportion of cell cavities. In dry wood, these cavities are filled with air which is one of the best known thermal insulators. However, if the cavities are filled with water, which is a poor thermal insulator, heat transfer is slower. For practical purposes, we may say that all strength properties decrease as moisture content increases. [1] Because of the surrounding fire, humidity is lower than the column interior humidity, and then the moisture will be transferred from the interior of the column to the surface. So both heat and mass transfer will occur. The result of this phenomenon will raise the temperature and humidity inside the column. When the moisture content is increased, the temperature of the interior elements around the center will increase the thermal conductivity as shown in Eq. 1.[2] The fire resistances of three different moisture content columns are shown in figure 1. The failure time is tabulated in table 1. Under the applied load about 1381 KN. The difference of the failure time related
to the same reason that when the column surface heated up, the vapor would transfer heat inside the column and causing increase of the interior element temperature. The element temperature plays an important factor to reduce the strength of the column.
2500 12% 20% 30%
Moisture content 12% 20% 30%
Load KN.
2000
1500
1000
Failure time(minutes ) 32 31.5 30
Table 1: Comparison of failure time for different moisture content
500
0 0
5
10
15
20
25
Failure Time (min.)
30
31.5
32
Fig.1: Fire resistance for squares column with different moisture content (Malaysian Keruing timber)
K = S (0.201 + 0.004M) + 0.0238 Where, K = thermal conductivity, W/(m ok) S = specific gravity based on volume at M, dimensionless M = moisture content, in percent, dimensionless
(Eq.1)
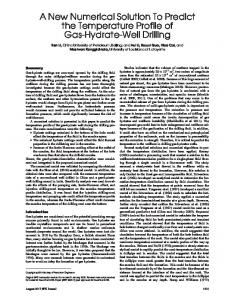
Effect of Initial Young’s Modulus. Figure 2 shows the fire resistance at different values of Young’s modules. The time failure values are presented in Table 2 under the applied load of 1380.974 kN. When the Young’s Modulus increases, the strength of the column will also increase [3], thus the fire resistance will be promoted. Therefore the fire resistance is dependent on the Young’s Modulus, fig.3. 2500
25.6 kN/mm2 30
13.79kN/mm2
1000
4.827 KN/mm2
500 0
y
Young's modulus KN/mm2
KN.
1500
Load
2000
25 20 15 10 5 0
0
5
10
15 20 25 28.5 30 31.5 32 Failure Time (min.)
Fig. 2: Fire resistance for squares column with different Young’s modules
28
28.5
29
29.5
30
30.5
31
31.5
32
Failure time (minutes)
Fig. 3: Fire resistance for squares column with different Young’s modules
32.5
Failure time (minutes ) 32 31.5 28.5
Table 2: Comparison of failure time For different Young’s Modulus Specific Gravity 0.85 0.45 0.15
Failure time minutes 32 35 38.5
Table 3:Comparison of failure time for different Specific Gravity
2500 Applied load KN.
Young’s modulus KN/mm2 25.6 13.79 4.827
2000 76 N/mm^2
1500
55 N/mm^2
1000
30 N/mm^2
500 0 0
5
10
15
20
25
30 32.5
Failure tim e(m in.)
Figure 4: Fire resistance for square column with different initial ultimate strength and the applied load half of the ultimate compression stresses
Effect of Initial Ultimate Compression Stress. The fire resistance of the column will be affected with the initial ultimate compression strength. As shown in Fig. 4, two columns one of them have the initial ultimate strength 76 N / mm 2 and the other has the initial ultimate compression strength 55 N / mm2. Both of them under the same applied load equal to 1500 K.N The first column will fail at 28 minutes, and the other one will fail at about 11 minutes. This indicates that the fire resistance increases with higher initial ultimate strength. However Fig. 4 also shows three columns with the same size 19 x 19 cm, this time the applied load for each column will change and will be half of the initial ultimate strength .The initial ultimate compression strength for the three columns are 76 N / mm2, 55 N / mm2, 30 N / mm2, and the applied load for each column 1381.097 N., 998.117 N., and 544.420 N respectively. The simulation shows that the entire three columns will fail at the same time. Therefore, the failure time of the column will be the same for the same percentage of the compression strength. Effect of Specific Gravity. The interior elements of the column of high specific gravity have higher temperature than the temperature of the low specific gravity. Low specific gravity means low density and low thermal conductivity and vice versa. The failure time of columns have different specific gravity are presented in Table 3. Fig. 5 shows the fire resistance for square Keruing column with different specific gravity. The high specific gravity column is capable to conduct heat more than the low specific gravity as shown in Eq. 1, the increasing of the element temperature affect on the strength of the column and reduces the load carrying capacity. Hence both of the above reason will affect the fire resistance. Effect of Thermal Conductivity (K). The computer simulations were performed on different values of thermal conductivity (Double, Equal, and Half of Keruing thermal conductivity). For the column of high thermal conductivity, the energy will be conducted faster from the surface to the interior elements and the boundary element temperature will be low. On the other hand the surface elements of the lower thermal conductivity column could absorb more energy because it has not the same ability to conduct heat. Thus, its temperatures become higher. However, the rate of increasing temperature in high (K) at the column interior elements is much higher than the low thermal conductivity one. This behavior will affect directly to the fire resistance of the
column as shown in Fig. 6. Table 4 shows the failure time for different thermal conductivity. Lower thermal conductivity results in better fire resistance. Fig. 6 shows the fire resistance for square Keruing column with different thermal conductivity Effect of Specific Heat. The specific heat (J/kg.°k) is the amount of heat required to raise the temperature of one kilogram from any material one degree Kelvin. When the specific heat increases, the body requires more amount of heat to raise its temperature then, the ability of the body to increase its temperature with respect to time will be low. Different values of the specific heat have been taken in this simulation (Double, Equal and Half of the Keruing specify heat). Increasing the specific heat of wood will reduce the rate of increasing temperature. Thus, the element takes more time to convert to char. The influence of the specific heat parameter on the fire resistance is as shown in Fig. 8. Table 5 represents the failure time at different values of specific heat. S.G 0.45
S.G 0.15
2500 2000 1500
Thermal conductivity,k W / M.°K
1000 500
Initial Keruing 7.780514 x10⁻⁴ Double of initial Keruing 2 x 7.780514 x10-4 Half of initial Keruing 0.5 x 7.780514 x10-4
35
30
20
10
0
0
Applied load
KN.
S.G 0.85
Failure tim e (m in.)
Fig. 5: Fire resistance for square Keruing column with different specific gravity 0.5 K load kN
1K load kN
2 K load kN
KN
2000
Load
1000
1500
27.5 35.5
Table 4: comparison of failure time for different Thermal conductivity Specific Heat, Keruing Keruing Specific Heat Double of Keruing Half of Keruing
2500
Failure time (minutes) 32
Fail time (min) 32 53.5 20.5
Table 5. Comparison of different specific Heat
500 0 0
5
10
15
20
25 27.5 30
32 35.5
Time(min.)
Fig. 6: Fire resistance for squares column with different thermal conductivity
1 S.H Load kN
0.0016
2 S.H. Load kN
0.5 S.H. Load kN
2500
0.0014
2000
0.0012
Load KN
Thermal Conductivity (W/m0.K)
0.0018
0.001 0.0008 0.0006 0.0004
1500 1000 500
0.0002
0
0 25
27
29
31
33
35
0 5 10 15 20 20 25 30 32 35 40 45 50 53
37
Tim e (m in.)
Failure time (minute)
Fig.7: Fire resistance for square Keruing column with different thermal conductivity
Fig.8: Fire resistance for squares column with different specific heat
Effect of Changing the Physical Dimensions. The computer simulations were performed on different column area, and different applied load as shown in Table 6. The ratio between the applied loaded the area (stress) is constant. The fire resistances of the three different cases are presented in Fig. 9. As presented in the Table 6 the best fire resistance is at the largest area. Despite the applied load increases by the same ratio of increasing area, the fire resistance improves 2.53 times for the largest area. The main reason for this is that the thermal conductivity of wood is too low if it is compared with the other materials. The performance of column could be improved to sustain fire resistance without loosing extra material to resist fire. To get better results the designer can redistribute the total building applied load on a minimum column number. Then the column area will be increased accordingly. Therefore, the fire resistance will be improved. Ratio increased
32
32/32 =1
2 Area loadKN
4 Area loadKN 12000
4000 2000 81
0 75
81/32 =2.53
65
81
55
5524
45
1444
6000
35
50
8000
30
2762
10000
20
722
50/32 =1.5625
Table 6: Comparison of failure time at different area
1 Area loadKN
10
1381
Failure Time (min)
0
361
Applied Load kN
Load KN
Area cm2
Tim e (m in.)
Fig. 9: Fire resistance for square column with different area and the applied load half of the initial ultimate stress
Conclusion The development of the mathematical models of Part A[6] and Part[7] have been used for sensitivity analysis in this research paper, Part C. The comprehensive sensitivity analysis is results in following conclusions: 1) All strength properties decrease as moisture content increases. 2) When the Young’s Modulus increases, the strength of the column will also increase. 3) The fire resistance increases with higher initial ultimate strength. The failure time of the column will be proportional to the same percentage of the compression strength. 4) Woods with low density have the highest thermal insulating value. Low-density column will transfer to char faster than the high-density column. 5) Fire resistance is improved by increasing the specific heat. 6) Lower thermal conductivity results in better fire resistance. 7) When the column size increase, the fire resistance increased sharply. References [1] Judith J. Stalnaker, Structural Deisgn in Wood, 2nd Edition, 1999. Kluwer Academic Publishers Boston/Dordrecht/London. [2] Hamdy Abd El Rahman Gouda, Masters Dissertation Universiti Teknologi Malaysia [3] R.C. Hibbeler, Mechanics of Material, 4th Edition, 2000, Prentice Hall International, Inc. [4] http://www.wrcla.org/cedarspecs/overview.asp,Western Association, Designer’s Handbook, Physical Properties,
Red
Cedar
Lumber
[5] Keith F. Faherty, Wood Engineering and Construction Handbook, 3rd Edition, 1999, McGraw-Hill HANDBOOKS. [6] Mohamed El Shayeb et al. Utilization of Numerical Techniques to Predict the Thermal Behaviours of Wood Column Subjected to Fire Part A: Using Finite Element Method to Develop Mathematical Model for Wood Column, Proceeding of FEOFS 2005,Bali, Indonesia. [7] Mohamed El Shayeb et al.,Utilization of Numerical Techniques to Predict the Thermal Behaviours of Wood Column Subjected to Fire Part B: Using Analysis of Column Temperature and Fire Resistance of Wood Column, Proceeding of FEOFS 2005,Bali, Indonesia.