UTILIZATION OF POLARIZATION SAR DATA FOR MAPPING COASTAL ZONE VEGETATION
Maged Marghany, Noradilawaty Zabidi, Wan Hazli Wan Kadir and Mazlan Hashim Department Of Remote Sensing Faculty of Geoinformation Science & Engineering University Technology Malaysia, 81310 UTM, Skudai, Johor Darul Ta’zim E-mail:
[email protected],
[email protected] KEYWORDS: POLSAR, Coastal vegetation, Polarization signature, Fuzzy-k-mean and ISODATA. ABSTRACT Coastal vegetation is one of the important natural ecosystems that act as protection from sea wave erosion phenomena and supply oxygen to the surrounding organisms. POLSAR data with multi-band and multi-polarization is selected for these studies which are acquired on September 19, 2000 for coastal vegetation mapping. Two methods are performed to CVV, LHH and LHV bands: polarization signature analysis and comparison of classification between two clustering techniques (Fuzzy-k-mean and ISODATA). The result shows that L band with HV polarization can distinguish coastal vegetation better than CVV. Furthermore, classification results of LHH and LHV shows that the Fuzzy-k-mean clustering is provided accuracy of 76% and also with kappa statistic of 70%. 1. INTRODUCTION Particularly, coastal zone is considered as most productive ecosystems with reserve biodiversity system. In addition, coastal zone vegetation covers play tremendous role in RS11-1
REMOTE SENSING
INTERNATIONAL CONFERENCE ON SPACE TECHNOLOGY AND GEO-INFORMATICS 2006
evaluation of natural management. For instance, they might be acted as natural defense to protect coastline from erosion impact. However, there are few studies have been conducted along Malaysian coastal waters to utilize remote sensing data for mapping coastal zone vegetation covers. Furthermore, Mazlan et al., (1999) have used multitemporal JERS-1 SAR data for forest mapping and biomass indicators along the coastal water of Malacca Straits. They reported that the majority of coastal zone spatial forest distributions are consisted of mangrove with producer accuracy of 71%. In addition, Mohd. et al., (1998) studied the coastal vegetation coverage by using ERS-1 data based on spatial variation of radar backscatter. They concluded that the different species existed along coastal zone are consistent with backscatter values acquired from ERS-1 SAR data. Recently, Lili (2002) used segmentation technique for mapping oil palm biomass variation from polarized AIRSAR data. He stated that different polarization bands of AIRSAR data is appropriate to determine certain age of oil palm trees. Band L-hh is able to determine the younger oil balm trees ages ranged between 6-20 years old. In contrast, oil palm trees ages have ranged between 21 and 25 can be mapped by using P-hh band. Finally, he concluded that Gamma algorithm with kernel size of 11 x 11 is most appropriate to map oil palm tree age variations. The main objective of this study is utilizing AIRSAR/POLSAR data for mapping coastal vegetation covers. This objective is divided into three objectives :(i) to identify coastal vegetation kinds using AIRSAR/POLSAR, (ii) to determine appropriate polarization band that can distinguish between coastal vegetation types, and (iii) to compare between Fuzzyk-mean and ISODATA clustering techniques by using error matrix and kappa statistic. Thus it might be to identify accurate method for coastal vegetation coverers mapping. 2. STUDY AREA Study area is located along the east coast of Malaysia which is bordered by the South China Sea. Marang river is considered is second hydraulic water communication with the South China Sea after Terengganu river. This area is covered 10 x 10 km 2 and located between 50 12’ 00’ N and 1030 13’ 00’ E (Figure 1). The dominant vegetation species is forest, bush, various crops, mangrove and paddy.
RS11-2
REMOTE SENSING
INTERNATIONAL CONFERENCE ON SPACE TECHNOLOGY AND GEO-INFORMATICS 2006
Figure 1 Location of Study Area 3. METHODOLOGY The procedures have used to extract vegetation species from AIRSAR/POLSAR image are shown in Figure 2. Standard procedures are required to map vegetation covers from polarized AIRSA data. The preprocessing AIRSAR/POLSAR data is acquired within six procedures to enhance polarized AIRSAR/POLSAR data. Image processing tools involved to identify vegetation species are Fuzzy-k-mean and ISODATA clustering techniques. 3.1 Data Acquisition In referring to NASA (2006), the POLSAR is an operating mode of the AIRSAR instrument which collects twelve channels of data, four in each of the three frequencies of AIRSAR: P-, L-, and C-band. POLSAR data have three bands of C (5.7cm), L (25cm) and P (68cm) with full polarization, HH, VV and HV. In addition. POLSAR data have spatial resolution of 10 m and its flight altitude during acquisition is 8.352km. Furthermore, its incidence angles is 26o for near range and 62o for far range. These data are acquired on September 19 2000 as part of PACRIM II. Finally, ancillary data are used which have involved topography and land use maps of 1996 and 2000 respectively. These data are used for accuracy assessment validation.
REMOTE SENSING
RS11-3
INTERNATIONAL CONFERENCE ON SPACE TECHNOLOGY AND GEO-INFORMATICS 2006
Figure 2 Flow Chart of Procedures Used to Map Vegetation Species from AIRSAR/POLSAR Data 3.2 Pre-image Processing 3.2.1 Synthesize POLSAR data POLSAR images are in compressed format. Images of the POLSAR data must be mathematically synthesized or decompress from the compressed scattering matrix data accordingly, before using in the next processing. The input POLSAR must be in JPL stokes matrix format. Geometric Correction The process of geometric correction must be carried out to match the image according to RSO (Rectified Skew Orthomorphic) projection. The geometric correction is done from map to image. There are 25 ground control points that be identified and digital number is transformed using second degree polynomial order and lastly image is resampled using Nearest Neighbour technique.
RS11-4
REMOTE SENSING
INTERNATIONAL CONFERENCE ON SPACE TECHNOLOGY AND GEO-INFORMATICS 2006
3.2.3 Antenna Signature Correction An inherent problem with airborne radar data owing to the side-looking nature of the system is an increased brightness or gain in energy of the signal in the near-range than far-range. Therefore it must be corrected using first order polynomial without removing the local variation in backscatter signals (NASA 2006). 3.2.4 Slant-to-Ground Range According to Mougin et al., (1999) polarized AIRSAR data are required to be converted from ground range to slant range. In fact, slant range radar data has geometric distortion in the range direction. The true or ground range pixel sizes vary across the range direction because of the changing incidence angles. This geometric distortion is corrected by resampling the slant range data to create ground range pixels that are in fixed size. After resampling, the compacted part of the images must be stretched to the correct ground range. 3.2 Post -processing Image 3.2.1 Filtering Spatial filtering is a necessary and effective method to suppress the “salt and pepper” effects of speckle in the radar brightness data. There are three types of adaptive filter algorithms are tested (i) Lee, (ii) Gamma, and (iii) Frost,. These algorithms are implemented to AIRSAR/POLSAR image with kernel window sizes of 3x3, 5x5 and 7x7. The SSI (Speckle Suppression Index) and differentiation statistic values used to identify an appropriate algorithm. In this context, the suitable adaptive algorithm should reduce SSI value to be near to 1. In addition, the lower standard deviation value might be a good indicator for suitable adaptive algorithm. 3.2.2 Classification Using Clustering Technique Referring to Mouing et al. (1999) clustering technique operates using two spectral bands to provide band correlation. Before clustering process, the band configuration should be known. From spread out scattering matrix Muller (equation 1.0), the co and cross- polarize have difference backscatter. So from that, correlation between both polarized band is REMOTE SENSING
RS11-5
INTERNATIONAL CONFERENCE ON SPACE TECHNOLOGY AND GEO-INFORMATICS 2006
obtained. Therefore, the POLSAR image has 4 configurations for instance, C-hh and C-vv, C-hv, L-hh and L-vv, and L-hv ( Lili 2002)
U U
r v r h
= S S S S vv
hv
vh hh
U U
t
(1.0)
v t h
Clustering is the processes to examine the unknown pixels in an image and aggregate them into a number of classes based on the natural groupings or clusters present in the image value. Two clustering technique are tested on POLSAR image and was implemented in modeler PCI Geomatica v9.1 software. Table 1 shows the parameter that will be used in processing for both techniques (Fuzzy-k-mean (FUZLUS) and ISODATA (ISOCLUS). Table 1 Parameter in FUZCLUS and ISOCLUS PARAMETER Number of cluster desired Maximum number of clusters Minimum number of cluster Standard deviation Lumping Parameter Maksimum number of lumping pairs Movement threshold Maximum number of iteration
TECHNIQUE FUZCLUS ISOCLUS 30 30 35 20 10 1 5 0.5 0.5 20 20
Furthermore, polarization indices (PI) analysis is performed to determine spatial distribution of polarization indices for coastal vegetation in co-polarize (HH and VV) and cross-polarize (HV). According to Proisy et al., (2001) PI is ratio between the sums and subtracts of the minimum and maximum polarization intensity value which has been described by Touzi et.al (1992) by following formula: PI = (Pmax – Pmin ) / (Pmax + Pmin )
(2.0)
Where Pmax and Pmin are the maximum and minimum values of polarization intensity. RS11-6
REMOTE SENSING
INTERNATIONAL CONFERENCE ON SPACE TECHNOLOGY AND GEO-INFORMATICS 2006
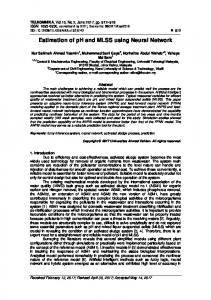
3.2.3 Accuracy Assessment To identify the accuracy of the techniques are implemented to AIRSAR data, error matrix and Kappa statistic are used. In this context, the appropriate technique might has highest accuracy which would be useful to determine coastal vegetation species. 4. Results and Discussion Figure 3 shows the output results of Gamma algorithm with kernel size of 7 x7. It is clear that speckle variations are reduced after performing Gamma algorithm (Figure 3b). This result is agreed with Figure 4 in fact that Gamma algorithm is produced image with lower SSI value of 0.84 within C-hh band compared to L-hh band. According to Maged and Shattri (1996) and Maged (2001) Gamma algorithm mapped homogenous regions and provides a classified land covers (Figure 3a). thus Gamma algorithm provides very high speckle reduction, while preserving the spatial resolution (Maged 2001).
Figure 3 (a) POLSAR image without Filter (b) POLSAR Image with Gamma 7x7.
L-HH
C-HH
0.9 0.85 0.8 0.75 FROST
GAMM A 3X 3
LEE 5X 5
LOCAL SIGM A 7X 7
0.8
INDEX
SPECKLE SUPPRESSION
1
0.95
INDEX
SPECKLE SUPPRESSION
1
0.6 0.4 0.2 0 FROST
GAM MA 3X 3
LEE 5X 5
LOCAL SIGM A 7X 7
Figure 4 SSI values for each Adaptive Algorithm tested in C-hh and L-hh Bands
REMOTE SENSING
RS11-7
INTERNATIONAL CONFERENCE ON SPACE TECHNOLOGY AND GEO-INFORMATICS 2006
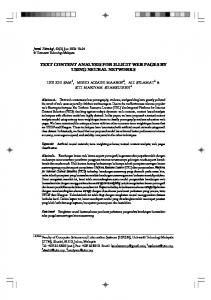
Figure 5 shows that band L-cross polarization has higher PI values for various vegetation species than band C (cross-polarization and co-polarization). In fact, PI discriminates between coastal vegetation classes. In addition, the polarization signature method shows that L band with hv polarization is able to discriminate species of coastal vegetation. According to Proisy et al., (2001) L-hv band can penetrate from canopy level to land surface compared to C band (Mougin,et al., 1999). In addition, hv polarization signal is transmitted in horizontal (h) and received in vertical (v) which allowed to capture complete characteristics of vegetation covers (Rao and Gurusamy, 1990 and Guihong and Peter, 2003). POLARIZATION INDICES FOR C AND L BAND 1
POLARIZATIONINDICES
0.9 0.8 0.7 0.6 0.5 0.4 0.3 0.2 0.1 0 FOREST
PADDY
BUSH
MANGROVE
VARIOUS CROP
CLASS BAND C, CO-POLARISASI BAND L,CO-POLARSASI
BAND C, CROSS-POLARISASI BAND L, CROSS-POLARISASI
Figure 5 Polarization Indices for C and L bands in both Polarizations Figure 6 shows the variation of vegetation species produced by using Fuzzy-k-mean and ISODATA clustering techniques. Fuzzy-k-mean clustering has higher accuracy value of 76 % than ISODATA clustering accuracy value of 67 % ( Table 2). This could be contributed to that Fuzzy-k mean clustering provides continuous classes and better representations of outliers or atypical individuals than discontinuous classes (Liew et al., 2000). Figure 7 shows the percentage variation of vegetation species along the coastal water of Terengganu , Malaysia. It is obvious that dominant vegetation species is bush with 35% which covers 810.11 ha compared to paddy, forest, mangrove, various crops and nonvegetation with 2% (50.90 ha), 23% (539.2 ha), 3% (52.90 ha), 16% (375.14 ha) and 7% (169.84 ha) respectively ( Figure 7).
RS11-8
REMOTE SENSING
INTERNATIONAL CONFERENCE ON SPACE TECHNOLOGY AND GEO-INFORMATICS 2006
Figure 6 Classification map of L-hh and L-hv Configuration using Fuzzy-k-mean Table 2 Accuracy Assessments of Fuzzy-k-mean and ISODATA Classification Technique Fuzzy-k-mean
ISODATA
REMOTE SENSING
Configuration C-HH and C-VV C-HH and C-HV L-HH and L-VV L-HH and L-HV C-HH and C-VV C-HH and C-HV L-HH and L-VV L-HH and L-HV
Overall Accuracy
Kappa Statistic
58% 63% 52% 76% 48% 53% 56% 67%
51% 55% 48% 70% 40% 45% 53% 59%
RS11-9
INTERNATIONAL CONFERENCE ON SPACE TECHNOLOGY AND GEO-INFORMATICS 2006
Figure 7 Percentage of Coastal Vegetation Species
5. CONCLOUSION This study has demonstrated method to map vegetation species types are located along the east coast of Peninsular Malaysia. Two techniques have performed: signature polarization and clustering methods. Gamma algorithm with kernel size 7 x 7 is more appropriative for speckle noise reductions which provides lower SSI value of 0.84 compared to other adaptive algorithm. In addition, Fuzzy-k-mean algorithm shows excellent performance for vegetation covers mapping compared to ISODATA algorithm. Overall accuracy of Fuzzy-kmean is 76% which is higher than ISODATA algorithm accuracy. It can be said that L-hv polarization is suitable band for mapping various vegetation species by using AIRSAR/POLSAR data
RS11-10
REMOTE SENSING
INTERNATIONAL CONFERENCE ON SPACE TECHNOLOGY AND GEO-INFORMATICS 2006
REFERENCES Guihong, C and B., Peter, 2003. Fuzzy K-means clustering in information retrieval. IEEE Transaction On Geoscience and Remote Sensing. Vol 22: 198-200 NASA (2006), Pacrim Mission. http://www.airsar.jpl.nasa.gov. Liali, N. 2002. Application of AIRSAR Data to Oil Palm tree Characterization. www.gisdevelopment.net/aars/acrs/2002/sar/038.pdf Liew, A.W., Leung, S.H., dan Lau, W.H. (2000). “ Fuzzy Image Clustering Incorporating Spatial Continuity.” IEEE Transaction On Geoscience and Remote Sensing. Vol 147. No.2 Maged, M. 2001 Radar Automatic Detection Algorithms for Coastal Oil Spills Pollution. International Journal of Applied Earth Observation and Geo-information .Vol (3)(2).pp191-196. Maged M.M. and M. Shattri (1996) On the application of Radarsoft to Extract Infrastructure Details from RADARSAT. Proceedings of Seminar Malaysian Remote Sensing Society Conference on Remote Sensing and GIS 25-27 November 1996. Crown Prince Hotel, Kuala Lumpur. C1-C6. Mazlan H., W, Hazli, W Kadir, L.K,Yoong, 1999. Global Rain Forest Mapping Activities in Malaysia: Radar Remote Sensing for Forest Survey and Biomass indicators. JERS-1 Science Program ’99 PI Reports: Global Forest Monitoring and SAR Interferogram March 1999, earth Observation Reserch Centre. National space development Agency of Japan. pp:63-70. Mohd, I, S , A., Samsudin and A., Adeli. 1998. Investigation of ERS-1 SAR and LANDSAT TM for land and marione applications in Malaysia. Proceedings of the Euro-Asia space, Week on Cooperation in Space-‘Where east&west Finally Meet’, 23-27 November 1998, Singapore (ESA SP-430, February 1999). pp:67-74.
REMOTE SENSING
RS11-11
INTERNATIONAL CONFERENCE ON SPACE TECHNOLOGY AND GEO-INFORMATICS 2006
Mougin, E., Proisy, C., Marty, G., Fromard, F., Puig, H., Betoulle, J.L. and Rudant, J.P. 1999. Multifrequency and multipolarization radar backscattering from mangrove forests. IEEE Transactions on Geoscience and Remote Sensing., 37 (1): 94-102. Proisy, C., Mougin, E., Fromard, F. and Karam, M.A. 2000. Interpretation of polarimetric radar signatures of mangrove forests. Remote Sens. Environ., 71: 56-66. Proisy, C., Mougin, E. and Fromard, F. 2001. Radar remote sensing of mangroves: results and perspectives. Proceedings of IGARSS Conference (9-13 July), Sydney, Australia Rao K.S and R., Gurusamy, 1990. Frequency dependence of polarization phase difference and Polarization indices for vegetation covered fields using polarimetric AIRSAR Data”. IEEE Transaction on Geoscience and Remote Sensing. Vol 1: 37-39 Touzi, R., S. Gozs, and T.L., Toan, 1992. “ Polarimetric Discriminators for SAR Images.” IEEE Transaction On Geoscience and Remote Sensing. Vol 30, No.5.
RS11-12
REMOTE SENSING


![UTMjurnalTEK 49F DIS[02].pmd - Eprint UTM](https://m.moam.info/img/260x300/utmjurnaltek-49f-dis02pmd-eprint-utm_5c125201097c47b55e8b463a.jpg)
