ELECTRONICS AND ELECTRICAL ENGINEERING ISSN 1392 – 1215
2009. No. 5(93) ELEKTRONIKA IR ELEKTROTECHNIKA ELECTRONICS
T170 ELEKTRONIKA
Utilization of Received Signal Strength Indication by Embedded Nodes R. Pahtma, J. Preden, R. Agar, P. Pikk Laboratory for Proactive Technologies, Department of Computer Control, Tallinn University of Technology Ehitajate tee 5, Tallinn 19086, Estonia, phone+3726202100; e-mail:
[email protected] antenna type (directional or omnidirectional), transmission power, antenna gains, receiver sensitivity, receiver threshold and the Signal-Noise Ratio (SNR) and 2) the nonisotropic properties of propagation - media properties include the media type, background noise and various other environmental factors [1]. In the current paper we set out to evaluate the RSSI property of the motes. It is clear that in a (near) perfect environment (anechoic chamber) the properties of a device can be determined quite well, a model of the antenna can be created and the function between the RSSI value and the distance can be determined. However such models have a limited use in real applications since the physical world ads a level of uncertainty to the RSSI value. We performed several case studies in realistic deployment environments where the RSSI value perceived by motes was recorded in a fixed environment in order to determine how the signal strength is actually perceived by the nodes themselves and if the RSSI values are consistent.
Introduction Emergence of wireless sensor networks has presented several challenges to the researchers active in the field. Wireless sensor network technology can be applied in a wide range of monitoring applications where they are superior to competing technologies. The basic component of a wireless sensor network is a mote (also called a smart dust mote), which is a small computer equipped with a wireless communication interface, some sensors and an autonomous power supply. Such devices form (mobile) multi-hop ad-hoc networks where each node also performs the task of a router forwarding messages received from other nodes. While the small form factor, low price and simple installation are some of the benefits of wireless senor networks, the new technology also presents some new challenges. Examples of these issues include the open nature and indeterminism of the networks, the ad-hoc manner in which they are deployed and heterogeneity of the systems. When addressing these issues we are faced with two questions – what tools do we use and how do we use it. Received (radio) signal strength indication (RSSI) is one tool that many researchers in the field deem to be important. Some even claim that the RSSI value can be used to determine the distance between two communicating nodes [2], [3]. It seems natural that since radio signal strength attenuates as a function of distance – the greater the distance the smaller the perceived RSSI value – the RSSI value could be also used to estimate the distance between two communicating nodes. However things are more complex in practice – RSSI is affected by the distance between the nodes but there are quite a few other factors that affect the radio signal propagation and hence the RSSI value that is perceived by a node. These factors include (but are not limited to) interference from other signal sources, reflection, diffraction and presence and nature of objects in the path of the radio wave. In an ideal case the RSSI value perceived by receivers at an equal distance from a transmitter is equal, which in practice, as we show below is not always the case. Radio irregularity of a device can be divided into two main factors: 1) the heterogeneous properties of devices -
Related work A fair amount of work exists in the area, however we found no promising results from the literature we surveyed. In [2] the authors attempt to make use of the RSSI value for ranging by applying an adaptive filter to the acquired RSSI values. The proposed method improves the distance estimation based on RSSI values when compared to distance estimations based on unfiltered RSSI values but even when the proposed method is applied the error exceeds the estimated value in some cases. In [3] another filtering method for acquired RSSI values is proposed. However the obtained results are similar to the work presented in [2] as the error is in the order of the evaluated value (distance) itself, which makes the distance estimation attempt a little futile. The study presented in [4] points out that the radiation pattern of a typical 802.15.4 antenna is not perfectly omnidirectional, which explains some of the inconsistencies of the RSSI values.
39
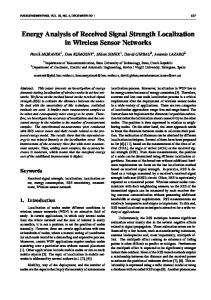
wooden frames 56cm above the floor. At each step (location) the transmitter transmitted 10 packets with all possible transmission strengths and the receivers reported the perceived RSSI values to a PC with a 100ms interval between the packets. The average of the received RSSI values is used on the graphs. In the interpretation of the RSSI values the -45 dBm offset of the CC2420 RSSI value is taken into account. Fig. 1 shows the received signal strength indication on a distance of 3m – 6m from the transmitter as perceived by the MicaZ motes equipped with TP-LINK antennas. The horizontal axis represents the distance between the transmitter and receiver in centimeters and the vertical axis represents the received signal strength as perceived by the receiver in dBm. The transmitter used maximum transmission power for transmitting the messages. Each line depicts the received signal strength as perceived by an individual mote – four motes were used as receivers, hence there are four lines on the graph.
Description of hardware used in the studies We used MicaZ wireless sensor network nodes from Crossbow Inc in the studies. The MicaZ motes were used as transmitters and receivers and the RSSI values recorded and evaluated during the study were obtained from the devices. MicaZ motes are equipped with a CC2420 radio from Texas Instruments which is IEEE 802.15.4/ZigBee compliant and it operates on the 2.4GHz unlicensed ISM (industrial, scientific and medical ) frequency band (24002483.5 MHz). In the IEEE 802.15.4 standard [5] the utilized frequency band is divided into 16 channels each occupying 2 MHz with 5 MHz separation between channels. The channels are labeled 11 to 26. As the same ISM band is also used by a variety of commercial equipment – Bluetooth, WiFi, some cordless phones and car alarms, the probability of radio interference is quite high. The MicaZ motes are equipped with an external 1/4 wavelength monopole antenna. In some studies we replaced the standard antenna with an external TP-LINK antenna with better characteristics. The software used on the motes in all the studies ran on the TinyOS 2.1 operating system and the operating system drivers and networking layer were used for achieving radio connectivity between nodes. Obtaining RSSI values
Fig. 1. Received signal strength measured by MicaZ motes equipped with TP-LINK antennas
The CC2420 radio used on the MicaZ motes features a built-in RSSI indicator. The RSSI value is always averaged over 8 symbol periods (128 μs) and has an offset of -45dBm. The latest RSSI value is obtained from the radio with the rest of the packet data and stored in the TinyOS message_t struct. The RSSI value has an accuracy of +-6 dBm [6]. The CC2420 offers the possibility to adjust the power level used during transmission (output power) in 31 steps (in a logarithmic scale) with 31 corresponding to 0dBm and 1 to approximately -35dBm. The experiments were conducted in TUT building with a steel reinforced concrete floor (which is a realistic operating environment for wireless sensor networks). In the studies the specific motes were assigned with roles of transmitter and receiver and appropriate application software was loaded to the motes. The receiving motes obtained the RSSI value from the radio and transmitted the results to a PC where the data was stored for later analysis.
As it can be observed from Fig. 1 the RSSI values perceived by individual motes are not identical although the distance between the transmitter and the four receivers was the same. It is possible that the variance in RSSI values is caused by the allowed error level of the RSSI indication (the specification promises accuracy in the range of +6dBm) however since the RSSI values are averaged over several readings and since the individual readings were quite consistent this is not likely the case. The RSSI values fluctuate very little when measured by one mote for different messages from one transmitter, but differ greatly between different receivers in the same location. The specification of the chip [6] claims that the RSSI value of the chip is very linear which would indicate that the RSSI value can be used with confidence.
Study 1 All experiments in this study used the configuration of one transmitting mote and four receiver motes arranged in a linear configuration in parallel to the transmitter. The transmitter was always stationary and the receivers were moved from 10cm to 800cm from the transmitter in 25cm steps (15cm for the first step). Tests were carried out with two sets of motes – one set equipped with MicaZ standard antennas and another set equipped with TP-LINK 5dBi antennas (TL-ANT2405C) soldered permanently to the PCB. Two sets of experiments were performed – with motes placed on the floor and with motes placed on
Fig. 2. Received signal strength measured by MicaZ motes. Bottom dotted line – MicaZ with standard antenna on the floor; dashed line in the middle – MicaZ with standard antenna 56 cm from the floor; solid line in the middle – MicaZ with TP-Link antenna on the floor; top dashed line – MicaZ with TP-Link antenna 56 cm from the floor
The variance in the RSSI values between motes cannot be explained by only physical differences in the 40
devices either as values obtained from different devices can’t be correlated well. We did not record any correlation between measured RSSI values and battery voltage either, assuming that the supply voltage is sufficient for normal mote operation. Fig. 2 depicts tests with various antennas on the floor and 56 cm from the floor on a wooden frame. It is clear that the proximity of the floor and the antenna type affect the RSSI reading but again it is difficult to find a correlation between the RSSI graphs. The RSSI values are similarly effected by environmental conditions with all output power levels. It can be observed that as output power increases, so does the RSSI value, but very little new information can be obtained about the distance between the transmitter and the receiver. It is clear that higher power levels increase the range of the transmission, but for indoor environments with a clear lineof-sight, the messages reach the received when the transmit power level is above 5. The occasional drops in RSSI levels are most likely caused by the metal in the reinforced concrete floor. The fluctuations are much less evident with larger antennas and when the motes are higher above ground. Over 130 000 packets were processed by the PC during this study.
Fig. 4. Percieved RSSI values at four distances with motes on the floor
Study 3 The third study was concerned with RSSI values at different frequencies with the configuration of the rest of the test setup being constant. Since the 2.4 GHz ISM band has many potential sources of interference, finding a good channel is essential for establishing a good communication link. Monitoring the RSSI value may provide a good means for selecting the optimal channel for communication. The tests were carried out in a typical office environment with two MicaZ motes equipped with standard antennas. The motes were placed on two separate office desks (80 cm from the ground) 2 meters apart with line of sight visibility between the motes and antennas in a vertical position. Three different test scenarios were studied, each with two different measuring strategies: 1) the transmission channel is changed after 100 packets 2) the transmission channel is changed after each packet. In both cases the originating node transmitted 100 packets on each channel (altogether 1600 packets). At first, RSSI readings were taken in an environment with no physical movement in the room. In this case both measuring strategies indicated similar results with minor signal strength fluctuations on the channels, with the average RSSI value for each channel changing not more than 1dBm in subsequent tests. It must be kept in mind that the CC2420 radio chip specification [6] states that the RSSI value has an accuracy of ±6 dBm. The observed RSSI values were between -55 and -69 dBm, which means that the perceived signal strength on different channels is not equal. The reason for it could be the local wireless medium, which was full of WiFi access points with various signal strengths covering most of the channels.
Study 2 The study [4] indicates that the radiation pattern of the standard MICAz antenna is not perfectly circular, the graph obtained during the study in an anechoic chamber is depicted on Fig. 3.
Fig. 3. Radiation pattern of MPR2400-MICAz with standard antenna
We decided to repeat the measurements in realistic operating conditions of motes. The messages for RSSI measurement in this study were transmitted with a 500msec period and with maximum radio transmission strength. The distance between transmitter and receiver varied from 25 100cm. During the tests the transmitter was static while the receiver was placed at 16 different angles around the mote. The base vector for the angle measurements was the vector from the processor of the device towards the antenna of the device. Fig. 5 contains the results with tests conducted on the floor of the laboratory. It can be observed that RSSI on the floor is weaker under angles 90 and 270 and stronger at 180 degrees. Tests conducted on a wooden stand 56cm from the floor resulted in a similar RSSI pattern, reinforcing the results of the previous test series. Measurement results of RSSI value under different angles show that there the radiation pattern of radio signal is predictable. The radio signal is weaker in angles 90o and 270o and stronger in other angles.
Fig. 5. RSSI on various channels with person walking by
In the second scenario, the line of sight of the motes was temporarily broken by a person walking between them. This time the two measuring strategies gave different 41
results. First of all, it must be stated that any physical nearby movement affects the RSSI sample quite a lot. The first strategy shows considerable drop in RSSI on only one channel, whereas the second strategy shows abrupt tumble on all channels during interrupted line of sight. This shows that the second method renders a more accurate picture of the wireless medium in time. The last test case repeated RSSI measurements with WiFi activity on channel 13. Both results indicated a slight overall RSSI drop on channels 23 and 24 that are located in the middle of the WiFi channel. Also a small increase in packet loss could be observed.
environment the RSSI value has very little practical value in realistic deployments. Acknowledgements The work presented in this paper was partially supported by Estonian MoD research grant, the Eliko competence centre and the Estonian Information Technology Foundation. References 1. Zhou G., He T., Krishnamurthy S., Stankovic J. A. Impact of Radio Irregularity on Wireless Sensor Networks // International Conference on Mobile Systems, Applications, and Services MobiSys. – 2004. 2. Sharly Joana Halder, Tae Young Choi, Jin Hyung Park, Sung Hun Kang, Sin Woo Park, Joon Goo Park. Enhanced ranging using adaptive filter of ZIGBEE RSSI and LQI measurement // International Conference on Mobile Systems, Applications, and Services MobiSys. – 2004. – P. 367–373. 3. Shin S., Son B., Kim W., Kim J. ERFS: Enhanced RSSI value Filtering Schema for Localization in Wireless Sensor Networks // IFIP International Federation for Information Processing. – 2008. – Vol. 264/2008. – P. 245–256. 4. Sungwon Yang and Hojung Cha. An Empirical Study of Antenna Characteristics Toward RF-Based Localization for IEEE 802.15.4 Sensor Nodes. – Lecture Notes in Computer Science. – P. 309–324. 5. IEEE Computer Society. IEEE Std 802.15.4™-2006. – New York. – 2006. 6. Texas Instruments. 2.4 GHz IEEE 802.15.4 / ZigBee-ready RF Transceiver. – 2007. Received 2009 02 20
Fig. 6. RSSI with WiFi
Concluding remarks The studies show that the RSSI values are related to the actual received signal strength, which is effected by very many factors, among which are the transmission power, distance between the transmitter and receiver, angle of the devices, the channel in use and very many other factors. Because of the high level of indeterminism in the
R. Pahtma, J. Preden, R. Agar, P. Pikk. Utilization of Received Signal Strength Indication by Embedded Nodes // Electronics and Electrical Engineering. – Kaunas: Technologija, 2009. – No. 5(93). – P. 39–42. Wireless sensor networks have presented multiple opportunities, but also several challenges to researchers. Tools are needed to overcome these challenges. Received signal strength indication (RSSI) is one possible tool since it could theoretically be used to determine the distance between two communicating nodes. However in reality, in addition to distance, RSSI is affected by quite a few other factors, making distance estimates extremely unreliable. We carried out three different studies with MicaZ smart dust motes to examine in realistic operating conditions the effects of distance, transmission strength, antenna characteristics, environmental and radio interferences on the RSSI value. The studies show that while many of the effects are easily observable, it is difficult to recognize the causes solely based on the RSSI value. The high level of indeterminism in the environment causes RSSI to have little practical value in realistic deployments. Ill. 6, bibl. 6 (in English; summaries in English, Russian and Lithuanian). Р. Пахтма, Ю. Преден, Р. Агар, П. Пик. Использование индикации величины принятого сигнала во встроенных узлах коммуникаций // Электроника и электротехника. – Каунас: Технология, 2009. – № 5(93). – С. 39–42. Сети беспроводных датчиков, не взирая на их полезность, исследователям бросают несколько вызовов. Для их преодоления нужны средства (инструменты), одним из которых является RSSI – индикация величины принятого сигнала. Теоретически ее можно использовать для определения расстояния между двумя узлами коммуникаций. На практике на RSSI влияют посторонние факторы из-за которых устройство является особенно ненадежным. Выполнены три различные исследования с использованием «MicaZ». Исследовалось влияние расстояния, величины сигнала, характеристик антены, среды и радиопомех на результат работы RSSI. Несмотря на то, что многие параметры нетрудно определить, для выявления причин воздействия недостаточно только RSSI значения. Поэтому применять RSSI для этих целей практически трудно. Ил 6, библ 6 на английском языке; рефераты на английском, русском и литовском яз.). R. Pahtma, J. Preden, R. Agar, P. Pikk. Priimto signalo stiprio indikacijos naudojimas įterptiniuose komunikacijų mazguose // Elektronika ir elektrotechnika. – Kaunas: Technologija, 2009. – Nr. 5(93). – P. 39–42. Bevielių jutiklių tinklai, nors yra naudingi, tyrinėtojams kelia keletą iššūkių. Jiems įveikti reikalingi įrankiai, kurių vienas yra RSSI – priimto signalo stiprio indikacija. Teoriškai jis gali būti naudojamas atstumui tarp dviejų ryšio mazgų nustatyti. Realiai RSSI turi įtakos pašaliniai veiksniai, todėl įrenginys tampa ypač nepatikimas. Atlikti trys skirtingi tyrimai naudojant „MicaZ“, kuriais buvo tiriama atstumo, signalo stiprio, antenų charakteristikų, aplinkos ir radijo trukdžių įtaka RSSI rezultatui. Nors daugumą parametrų lengva stebėti, poveikio priežasčiai nustatyti vien tik RSSI reikšmės nepakanka, todėl realiose srityse RSSI naudoti nepraktiška. Il. 6, bibl. 6 (anglų kalba; santraukos anglų, rusų ir lietuvių k.).
42
43