2011 50th IEEE Conference on Decision and Control and European Control Conference (CDC-ECC) Orlando, FL, USA, December 12-15, 2011
Utilizing Automated Demand Response in Commercial Buildings as Non-Spinning Reserve Product for Ancillary Services Markets Sila Kiliccote, Member, IEEE, Mary Ann Piette, Edward Koch, Member, IEEE, and Dan Hennage
Abstract— In 2009, a pilot program was conducted to investigate the technical feasibility of bidding nonresidential demand response (DR) resources into the California Independent System Operator’s (CAISO) day-ahead ancillary services market as non-spinning reserves product. Three facilities, a retail store, a local government office building, and a bakery, were recruited into the pilot program and moved from automated price responsive programs to CAISO’s participating load program. For each facility, hourly demand, and load curtailment potential were forecasted two days ahead and submitted to the CAISO the day before the trading day as an available resource. These DR resources were optimized against all other generation resources in the CAISO ancillary services market. Each facility was equipped with four-second real time telemetry equipment to ensure resource accountability and visibility to CAISO operators. When CAISO requests DR resources, OpenADR (Open Automated DR) communications infrastructure was utilized to deliver DR signals to the facilities’ energy management and control systems. The pre-programmed DR strategies were triggered without a human in the loop. This paper describes the automated system architecture with detailed description of meter feedback in the DR signaling to maintain demand reduction at the government office building. The results showed that OpenADR infrastructure could be used for some products for the ancillary services market and DR strategies for heating ventilation and air conditioning and lighting provide fast enough response to participate in non-spinning reserve product in the ancillary services market.
ALIFORNIA Independent System Operator (CAISO) maintains a demand responsive program called the
Participating Load (PL) Program that allows the loads to participate as price-responsive demand as non-spinning reserves in the ancillary services market. The PL pilots were authorized by the California Public Utilities Commission (CPUC) as a first step towards allowing retail customers to participate in the CAISO markets as PLs. The objective of these pilots was to assess the technical and financial feasibility of using retail loads for PL. Various retail load classes and technologies participated in the pilots. The key requirement under the PL pilot is that the PL resources have to meet the non-spinning reserve requirements, which means the resources have to (1) deliver energy within 10 minutes, (2) be available for two hours, and (3) provide real-time telemetry to the CAISO. All three investor-owned utilities in California conducted PL pilots with varying customer segments. Southern California Edison utilized small aggregated loads, leveraging real-time telemetry at the feeder with two-way communicating switches and air conditioning loads. This was an extension of the prior work done on spinning reserve demonstration [1] [2]. San Diego Gas and Electric Company worked with aggregators with small commercial and industrial customers. The CPUC allowed a portion of the PL to be dispatched manually, granted it still met the dispatch criteria. Pacific Gas and Electric Company’s (PG&E) pilot investigated the technical feasibility of bidding large commercial and industrial DR resources into the CAISO's day-ahead market for ancillary services non-spinning reserve in a fully automated manner. This paper summarizes the process, methodology and results from of one of the sites that participated in PG&E’s PL pilot. The key research goals were (1) to evaluate the communication and telemetry infrastructure needs, (2) to understand the capabilities in commercial and industrial facilities to automatically deliver load within the limitations of the non-spinning reserves product, and (3) to experiment with feedback controls to maintain a pseudo generation commitment of loads.
S. Kiliccote is with the Demand Response Research Center at Energy and Environmental Technologies Division, Lawrence Berkeley National Laboratory, 1 Cyclotron Rd MS 90-3111, Berkeley CA 94720, USA ; email:
[email protected] M. A. Piette is with the Demand Response Research Center at Energy and Environmental Technologies Division, Lawrence Berkeley National Laboratory, 1 Cyclotron Rd MS 90-3111, Berkeley CA 94720, USA; email:
[email protected] E. Koch is with Akuacom, 781 Lincoln Ave Suite 210 San Rafael, CA, 94901, USA; e-mail:
[email protected] D. Hennage is with Akuacom, 781 Lincoln Ave Suite 210 San Rafael, CA, 94901, USA; e-mail:
[email protected]
Ancillary services are support services in the power system essential in maintaining power quality, reliability and security. Non-spinning reserve is the extra generating capacity that is not connected to the power system but can be brought online after a short delay. Participating Load resources provide demand that can be curtailed via a realtime dispatch of the grid. PL pilot relies on a simple pricesensitive demand curve submitted in the day-ahead market, and an accompanying pseudo-generator supply curve for use in the Real-Time Market that represents the demand response resource’s real-time energy dispatch capability [3].
I. INTRODUCTION
C
978-1-61284-799-3/11/$26.00 ©2011 IEEE
4354
Demand Response Event
Ramp Period PENDING
Three facilities, a large retail store, a local government office building and a bakery were recruited into the PL pilot. Each of these facilities had participated in automated critical peak pricing (AutoCPP) program in previous years. Between
Start Time
Issue Time
II. PARTICIPATING LOAD PILOT (PLP) ARCHITECTURE In the Day-Ahead Market, utility submitted two bids for each PL through the CAISO’s Scheduling Infrastructure Business Rules (SIBR) web-based user interface: a load bid (an offer to buy or self-schedule demand) and a generation (pseudo generating resource) bid (an offer to sell demand reductions). Load bid consisted of hourly loads of the resource. Pseudo generating bid was the hourly demand reduction portion of the non-spinning reserve provided by the PL. Both Load and Pseudo Generating bids were hourly bids generated by averaging 5-minute forecasts. Any operational changes within the facilities were communicated to the utility before 5 am one day before the trading day. Between 5 am and 9 am, there was a second window of opportunity for the facilities to announce changes to their bids. Bids and prices were submitted to CAISO by 9 am one day before the trading day. The day-ahead market closed at 10 am. The CAISO published schedules and award results no earlier than 1 pm on the same day. The real-time market closed 75 minutes before the trade hour and the PL resources were settled based on 5 minute dispatches that were based on the PL’s day-ahead schedule. A typical settlement time for PL resources took 38 to 56 days after the resource request date. Settlement issues were not covered as a part of this project and are not reported in this paper.
IDLE
ACTIVE
High Mod. Nor.
End Time
1) Smooth intra-hour variability, 2) Minimize effects of forecast error, 3) Absorb excess renewable energy during overgenerations periods, and 4) Address morning and evening ramping periods. This paper is organized as follows. The next section describes the PL pilot system architecture. This is followed by the Methodology section, in which we describe the site selection criteria, development of forecasts and data collection methods for three facilities (a local government office building, a large retail store and a bakery). Special attention is given to the DR strategy at the local government office building, which used a feedback loop with the foursecond telemetry. Details on the performance of all the sites were published in 2009 [5]. This feedback loop was designed and used to maintain the DR signal level. In the Results section we present the data from one day where the site actually participated in a four hour event. Finally in the Discussion and Conclusion section, we point out issues that had come up during the pilot, resolution of these issues and identify next steps.
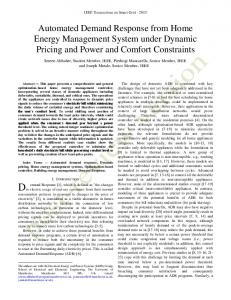
May 1st and October 31st, customers in the AutoCPP program receive credits for their energy consumption during weekdays on peak and part –peak periods in return to being exposed to three times their peak rate between noon and 3 pm, and five times their peak rate between 3 pm and 6 pm for up to 12 days. The utility uses Open Automated Demand Response (OpenADR) information exchange model to notify customers of the day-ahead DR events and publish price modes [6]. Under AutoCPP, the utility notified the participants day-ahead by publishing DR event information. OpenADR clients communicating with energy management and control systems at each site polled the DR automation server (DRAS) and initiate pre-programmed control strategies at each facility without a human in the loop. A representation of the AutoCPP events using OpenADR is displayed in Figure 1. Issue Time was either day ahead or two hours before the DR event time on the day of the AutoCPP event. The implicated Ramp Time was either before or at the Start Time and was determined by the facility operator. During the Active Period, DR event contains simple price levels (NORMAL, MODERATE or HIGH).
Price
Adoption and acceleration of Renewable Portfolio Standards require changes in how the wholesale grid is managed. To address the integration of variable generation, there is growing attention to the utilization of demand response (DR) resources with ancillary services products to replace a portion of grid-scale storage requirements and to [4]:
Figure 1. AutoCPP program mapping of OpenADR signals
The PL pilot used the same AutoDR messaging infrastructure between the utility and the customers. For the PL pilot, CAISO’s Automated Dispatch System (ADS) dispatched DR resources through the DRAS (Figure 2). When CAISO dispatched awards for the participants, OpenADR messaging infrastructure was utilized to deliver DR signals to the facilities’ energy management and control systems [7]. On the metering side, dual meter socket installations allowed the facilities to keep their revenue meter and facilitated the installation of another meter with a Code Division Multiple Access (CDMA) chip to transfer four-second electric load data. CDMA technology transmitted radio signals over a cellular-based wireless network. This four-second telemetry infrastructure was installed at each of the participating facilities and data were communicated to CAISO, DRAS and the utility. CAISO used the four-second electric load data to provide visibility to the operating reserves on the grid and to ensure that resource was meeting its minimum operating reliability criteria at all times. The utility stored the telemetry and
4355
interval meter data in a secure shared folder accessible by the team. The data were used for load and shed forecasting.
Low electric load forecasting accuracy
variability
–
enhances
load
Ability to deliver resource in 10 minutes – preferably a site with both fast (lighting) and slow HVAC (Heating Ventilation Air Conditioning) response Low shed variability – enhances shed forecasting accuracy Minimum of 10 kW of load shed
All sites met the minimum demand shed requirement. Only three of the sites in AutoDR consistently shed lighting loads. However, these sites were recently equipped with solar panels. Therefore their load shape and load variability prohibited their participation. For the remaining sites, load statistical summaries (LSS) and load variability (VAR) calculations [8] were completed. VAR is a measure of coefficient of variance; it is the ratio of standard deviation to average demand, for each hour during the time period of interest. Larger the load variability, the more difficult it is to accurately forecast load. LSS in Figure 3 shows the average, minimum, maximum and standard error of 15-min demand across each day in the period of interest. LSS and VAR both reflect DR potential as they indicate when and where peak loads occur, or the extent to which loads vary or can be reliably predicted. 2530 Arnold, Jun/2008 2008
600
500
III. METHODOLOGY
A. Site Selection Sites that participated in the utility’s AutoCPP program in previous years were considered for this pilot. Selection criteria were as follows:
400
300
200
100
11:00:00 PM
9:00:00 PM
10:00:00 PM
8:00:00 PM
7:00:00 PM
6:00:00 PM
5:00:00 PM
4:00:00 PM
3:00:00 PM
2:00:00 PM
1:00:00 PM
12:00:00 PM
11:00:00 AM
9:00:00 AM
10:00:00 AM
8:00:00 AM
7:00:00 AM
6:00:00 AM
5:00:00 AM
4:00:00 AM
3:00:00 AM
2:00:00 AM
0
12:00:00 AM
LBNL developed pre- and post data analysis and electrical data sharing methods for this pilot. Pre-analysis methods include development of site selection criteria, analysis of loads for sites in the AutoDR programs as compared to the criteria, DR shed strategies as well as forecasting loads for recruited facilities [7]. Forecasting of individual building loads was done by a commercially available product. Postanalysis methods include the development of ramp time and shed calculations methods as well as evaluation of accuracy of forecasts. Finally, timely and secure communication and data sharing by all the team members was a major undertaking.
2530 Arnold
Jun
1:00:00 AM
DRAS used the four-second data for real-time feedback to dispatch various pre-programmed control strategies at the local government office building to sustain the shed amount dispatched by the CAISO. Interoperability among all the entities was a major challenge for this project. At the center, DRAS had to establish communication with all the entities. This was done in the form of using XML (eXtensible Mark-up Language) documents. All the communication between the DRAS and other components of the system were secured using Secure Sockets Layer (SSL) technology. SSL provided both authentication and encryption. The communication between ADS and telemetry data feed were mutually authenticated using SSL. In the case of ADS where the DRAS was a client, the CAISO supplied a client certificate as well as a root certificate for the server. For telemetry data and for the DRAS clients, the DRAS was the server and the Akuacom server certificate was available via a well-known certificate authority. The DRAS provided telemetry data communication with a client certificate also issued by a well-known certificate authority. The DRAS clients used HTTP basic authentication.
Whole Building Power (kW)
Figure 2. PL Architecture
Historical electrical 15-minute interval data were available for all the AutoCPP sites. Due to the low resolution of the meter data, it was difficult to determine the response time of the sites. However we grouped the sites that yielded the initial shed within the first 15 minutes and those that yielded additional shed within the second 15 minute period. If a site continued to shed after the first 15 minutes, we considered these sites as having ―slower‖ response.
Time of Day
Average of kW
Max of kW
Min of kW
Figure 3. Load statistical summary (LSS) of the local government office building
As a result of the pre-analysis, four sites were recommended to participate in the pilot. Two of these sites agreed to participate in the study. A third site, which did not fit the initial load variability criteria, was requested to participate in the study to so as to evaluate a variety of sites. The final three facilities that participated in the study were a retail store, a local government office building, and a bakery. The rest of the paper concentrates on the local government
4356
office and describes the feedback controls utilized to maintain pseudo generation. B. DR Strategies Each facility had participated in the utility’s AutoCPP for at least two years. Therefore, two-level DR strategies were pre-programmed in their energy management and control systems (EMCS). Each site was asked to re-evaluate their strategies and decide how long they would be willing to participate and with which DR strategy.
communicate four-second real-time telemetry data wirelessly. The real-time data were used by CAISO to ensure resource availability and by Akuacom as a feedback to sustain the reduction bid level at Contra Costa County building. A swap drive with strict security guidelines was established for archiving and sharing both four-second telemetry and forecast data. The electrical data for each site collected (or calculated) and shared for this project is as follows: 15 minute interval data from the revenue meter 5 minute data from the pulse output of the revenue meter 4 second telemetry data from the meter with CDMA chip 5 minute load forecasts 5 minute load reduction forecasts Hourly load forecasts (using 5 minute load forecasts) also known as Load Schedule Hourly load reduction forecasts (5 minute load reduction forecasts) also know as Pseudo Generator Schedule E. Demand Shed Calculations
The local government office building allowed the team to experiment with adjusting DR strategies depending on the load feedback received from the four-second telemetry. A DR strategy utilizing 4 ºF temperature setpoint adjustments with one degree increments was pre-programmed into the EMCS. During the resource request period, forecasted bid level (target shed level) and the actual load shed (current load level) were compared and adjustments to temperature setpoints were requested automatically in order to sustain the forecasted bid levels. DRAS
Site EMCS
Target Shed Level (Instruction Level)
CLIR
Is Target = Current? Price Level
Forecasted loads were considered as baseline for all calculations. Demand shed calculations were completed by subtracting actual 5-minute loads from forecasted fiveminute loads and compared to the forecasted hourly demand reduction.
Simple EMCS Control Network
Current Shed Level
L
L
L
RM
Calculate Current Shed Level
T
Measured Data
F. Dispatch Signal Propagation
Figure 4. Feedback loop to meet and maintain forecasted bids (target shed level)
C. Ramp Rate Calculations Non-spinning reserve resources must ramp to full capacity within 10 minutes. Ramp rate is the bid component that indicates the load drop rate and load pick-up rate for participating loads, for which the scheduling coordinator is submitting energy bids or ancillary services bids 1. It is the measured rate, expressed in megawatts per minute, of a participating load’s ability to adjust its demand. For each participating load resource, a ramp rate is entered into the CAISO’s master file. The average, best and worst ramp rates for the participants were 0.1, 0.25 and 0.05 MW/min. For each event and resource, ramp rate is calculated as the load drop over the first 10 minutes of the PL event. D. Data Collection Data collection and secure sharing among the seven entities that participated in the operation and analysis of the PLP events was a major effort in this project. An additional meter with a CDMA chip was installed at each facility to 1
http://www.caiso.com/240d/240dbdee2c0c0.pdf
The DRAS was directly interfaced to the ADS. It polled the ADS Server to receive dispatch instructions. Instructions from the ADS arrived in the form of XML documents. When a valid instruction was received, an OpenADR event was created that had the same start time and end time as that in the instruction. Note that for 5 minute dispatchable instructions, an end time was not explicitly given and it was assumed to be 5 minutes after the start time. The notification time for DR event was the same as the start time and the event was immediately published to all the DRAS Clients so they could achieve their instructed levels within the required 10 minute ramp period. Figure 5 displays the PL Event mapping for the local government office building on OpenADR messaging model. In this application, Issue Time field and PENDING signal in Figure 1 were not being utilized. The implicated Ramp Time was within the PL Event Active period. The DR event contained simple price levels (normal, moderate, high) for the retail store and the bakery. For the local government office building, the DR event also contained an enumerated price level (0.0, 1.0, 3.0, and 7.0) that is used for the closedloop controls. Each price level was mapped on to a 1°F zone temperature set point adjustment. If the facility were not achieving its instructed level, then a higher price level was sent forcing the temperature set points to be reset at a higher level. Likewise if the facility were shedding more than the instructed level, a lower price level was sent resetting the temperature set points lower.
4357
600 PLP EVENT 500
Ramp Period
IDLE
400 Demand (kW)
ACTIVE
300
3.0
1.0
End Time
7.0
100
20:05
20:45
21:25
22:05
22:45
23:25
21:25
22:05
22:45
23:25
19:25
20:45
18:45
20:05
18:05
17:25
16:45
16:05
15:25
14:45
14:05
13:25
12:45
12:05
11:25
9:25
10:45
8:45
10:05
8:05
7:25
6:45
6:05
5:25
4:45
4:05
3:25
2:45
2:05
1:25
0:05
0
0.0
0:45
Level PriceLevel Load
Start Time
200
Time of Day Actual 5 min. Data
Figure 5. Participting Load Event mapping on OpenADR specification
Hourly Forecast with reduction
Forecasted Data
Figure 6. The actual load (green) follows the hourly bids (red) 150
A total of nine PLP events were dispatched in PG&E’s service territory for the three sites that participated in 2009. All the buildings were ―live‖ in the wholesale market on the CAISO’s production systems on July 29, 2009. The PLP events were actual dispatches called by the CAISO’s ADS. Table 1 shows the dates of each event and the duration of participation for the local government office. Some of the dispatched events did not meet the initial PLP rules such as one event per day per site and minimum event duration of one hour.
100
Demand (kW)
50
19:25
18:45
18:05
17:25
16:45
16:05
15:25
14:45
14:05
13:25
12:45
12:05
11:25
10:45
9:25
10:05
8:45
8:05
7:25
6:45
6:05
5:25
4:45
4:05
3:25
2:45
2:05
1:25
0:05
0 0:45
IV. RESULTS
-50
TABLE I -100
PLP EVENTS AND DURATION OF PARTICIPATION FOR EACH FACILITY. Date August 6, 2009 August 31, 2009 September 11, 2009 September 18, 2009 September 21, 2009
Time of Day Forecasted - Actual
Hourly Forecasted Bids
Figure 7. Hourly bids (red) and pseudo generation (blue) on September 21, 2009.
CCC 17:00 - 18:00 14:00 - 15:00 14:40 - 14:43 16:00 - 16:25, 16:35 - 16:51 14:00 - 16:30, 16:40 - 17:55
When the loads are less variable, in this case early morning and late evening periods, the forecasted load matches the actual load. However, during occupied hours, even this low load variable building’s load is harder to predict.
For the local government office building, a representative event on September 21, 2009, which was long enough to test the feedback controls, is selected and presented in this paper. For this event, the load shape is presented in two ways: 1) Actual 5 minute electrical load data is displayed with the hourly load forecast for the event day, and 2) The difference between the actual 5 minute electrical load data and the forecasted 5 minute load data with the hourly forecasted bids. The first graphic (Figure 6) representation shows how the actual load profile follows the hourly bids averaged and submitted by PG&E. The second representation (Figure 7) shows a comparison of actual versus forecasted 5 minute load data and how the sheds compare to the difference between forecasted and actual data (pseudo generation).
Table 2 summarizes the ramp rate and average load shed by displaying measured and forecasted values. Measured ramp rates and load reduction for each hour are consistently higher than forecasted values. The higher values are especially pronounced for the first hour. TABLE II SUMMARY OF MEASURED VERSUS FORECASTED RAMP RATES AND AVERAGE LOAD REDUCTION.
Date 6-Aug 31-Aug 18-Sep 21-Sep
Ramp Rate* (MW/min) 0.004/0.001 0.012/0.002 0.014/0.009 0.006/0.002
Average Load Reduction* (kW) HE 15:00 HE 16:00 86/10 72/20
86/80
HE 17:00 HE 18:00 76/20 51/40
116/10 49/30
* Measured/Forecasted
The DR strategy for this facility was programmed such that four price levels were mapped onto four 1ºF incremental temperature adjustment strategies. Initially, for the first hour of the PLP event, instead of starting with 1ºF increments, a 4358
2ºF adjustment was dispatched. The 4-second data is used to monitor the performance of the strategy and evaluate so that it met the bid requirements. If the initial strategy did not meet the bid requirements, then the strategy was adjusted by the DRAS by sending a different price level that in turn adjusted the temperature setpoints up or down within the initial parameters set and programmed by the participant. On September 21, the initial adjustment for the first hour exceeded the bid. This is partly because there was a problem with the algorithm and instead of calling for the strategy with 2 ºF during the initial hour, the system called for 4 ºF strategy that was carried out for 1 hour before it was realized and adjusted. The amount of shed depends on the nature of response by the heating, ventilation and air conditioning (HVAC) systems. When initial adjustments were made, the fans went to their minimum setting and the chillers unloaded, resulting in transient savings which cause high ramp rates. Therefore, the bids for the first hour for this facility have to be increased to match the response. V. CONCLUSION AND DISCUSSIONS The PL events were successful in proving that buildings in price-based automated DR programs can participate in wholesale ancillary services with fully automated communication infrastructure using OpenADR and existing DR control strategies. Traditionally, Auto-DR has been applied to price-responsive, day-ahead or day-of (slow) DR programs with notifications varying from 24 hours to 2 hours before the DR event [9]. The load shed calculations for slow DR have been using 15-minute electric load data gathered from the revenue meter 24 hours after the DR events. Overall significance of the results of the PL pilot is summarized as follows: 1.
2.
3.
HVAC as an end use and global temperature adjustment as a DR strategy meet the 10-minute response time and two-hour duration requirements for wholesale ancillary services. OpenADR specification can be used to communicate wholesale DR events in an open and interoperable manner. From a customer’s perspective the transition from AutoDR programs to PLP was seamless; they used the same infrastructure with no additional costs. Internet can be used for fast DR to dispatch nonspinning ancillary services and still meet the 10 minute load response time.
From the utility’s perspective, each site’s load had to be forecasted and bid into the CAISO’s system; 4-second telemetry had to be installed at each facility; automated communication between the ADS and DRAS had to be established; a secure file sharing system had to be set up; and settlements had to be incorporated into customer billing. A summary of the lessons learned from the pilot are: Forecasting loads is a complex process and highly variable loads are extremely difficult to forecast. There is a need to develop better forecasting methods where load
characteristics and changes in operations are better incorporated in the forecasting algorithms. Dispatch rule, such as no more than two hours of participation or no more than one event per day, were assumed to be sorted at the CAISO system and little intelligence was programmed into the DRAS in terms of program rules. DRAS can be used as a second check point for dispatch rules. Maximum duration of dispatch and number of events for the PLP sites is not sufficient to test sustainability of sheds. Interoperability requirements of price-responsive retail DR programs such as CPP and DBP are different from wholesale non-spinning reserve ancillary services. However the nature of the DRAS as an integration point between the Utility/ISO and the facilities for disseminating DR signals provides a convenient and flexible means to translate dispatch signals from the CAISO into standard OpenADR signals in a manner that is consistent with how they participate in other DR programs. VI. ACKNOWLEDGEMENTS Authors would like to thank all the participants, especially Andy Green and David Nyberg from Contra Costa County, This work was sponsored in part by the Demand Response Research Center which is funded by the California Energy Commission (Energy Commission), Public Interest Energy Research (PIER) Program, under Work for Others Contract No.150-99-003, Am #1 and by the U.S. Department of Energy under Contract No. DE-AC03-76SF00098. VII. REFERENCES [1] Eto, J., J. Nelson-Hoffman, C. Torres, S. Hirth, B. Yinger, J. Kueck, B. Kirby, C. Bernier, R. Wright, A. Barat, D. Watson. 2006 Demand Response Spinning Reserve Demonstration. LBNL-62761. [2] Eto, J., J. Nelson-Hoffman, E. Parker, C. Bernier, P. Young, D. Sheehan, J. Kueck, and B. Kirby 2008. Demand Response Spinning Reserve Demonstration—Phase 2 Findings from the Summer of 2008. LBNL-2490E. [3] CAISO. MRTU Release 1 Participating Load Users Guide (Participating Load Technical Standards) [4] Kiliccote, S., P. Sporborg, I. Sheikh, E. Huffaker, M. A. Piette. Integrating Renewable Resources in California and the Role of Automated Demand Response. California Energy Commission, PIER Program. 2010. LBNL-4189E. [5] Kiliccote, Sila, M. A. Piette, G. Ghatikar, E. Koch, D. Hennage, J. Hernandez, A. Chiu, O. Sezgen and J. Goodin. Open Automated Demand Response Communications in Demand Response for Wholesale Ancillary Services. Grid Interop. November 2009. [6] Piette, M. A., G. Ghatikar, S. Kiliccote, E. Koch, D. Hennage, P. Palensky, and C. McParland. CEC OpenADR-Version 1.0 Report 2009. Open Automated Demand Response Communications Specification (Version 1.0). California Energy Commission, PIER Program. CEC500-2009-063 and LBNL-1779E. [7] Piette, M.A., D. Watson, N. Motegi, S. Kiliccote. Automated Critical Peak Pricing Field Tests: 2006 Pilot Program Description and Results. LBNL-62218. August 2007.
4359
[8] Coughlin, K., M.A. Piette, C. Goldman, and S. Kiliccote Statistical Analysis of Baseline Load Models for Non-Residential Buildings. Energy and Buildings 41 (2009) 374–381. [9] Piette, M.A., S. Kiliccote, and G. Ghatikar Linking Continuous Energy Management and Open Automated Demand Response. Presented at the Grid Interop Forum, Atlanta, GA, November 11-13, 2008. LBNL1361E. November 2008.
4360