Texas Medical Center Library
DigitalCommons@The Texas Medical Center UT GSBS Dissertations and Theses (Open Access)
Graduate School of Biomedical Sciences
8-2016
Utilizing Computed Tomography Image Features to Advance Prediction of Radiation Pneumonitis Shane P. Krafft
Follow this and additional works at: http://digitalcommons.library.tmc.edu/utgsbs_dissertations Part of the Applied Statistics Commons, and the Other Physics Commons Recommended Citation Krafft, Shane P., "Utilizing Computed Tomography Image Features to Advance Prediction of Radiation Pneumonitis" (2016). UT GSBS Dissertations and Theses (Open Access). Paper 697.
This Dissertation (PhD) is brought to you for free and open access by the Graduate School of Biomedical Sciences at DigitalCommons@The Texas Medical Center. It has been accepted for inclusion in UT GSBS Dissertations and Theses (Open Access) by an authorized administrator of DigitalCommons@The Texas Medical Center. For more information, please contact
[email protected].
UTILIZING COMPUTED TOMOGRAPHY IMAGE FEATURES TO ADVANCE PREDICTION OF RADIATION PNEUMONITIS by Shane Paul Krafft, B.S., P.S.M. APPROVED: ______________________________ Mary K. Martel, Ph.D. Advisory Professor ______________________________ Tina Marie Briere, Ph.D. ______________________________ Laurence E. Court, Ph.D. ______________________________ Arvind Rao, Ph.D. ______________________________ Francesco Stingo, Ph.D. APPROVED: ____________________________ Dean, The University of Texas Graduate School of Biomedical Sciences at Houston
UTILIZING COMPUTED TOMOGRAPHY IMAGE FEATURES TO ADVANCE PREDICTION OF RADIATION PNEUMONITIS A DISSERTATION Presented to the Faculty of The University of Texas Health Science Center at Houston and The University of Texas MD Anderson Cancer Center Graduate School of Biomedical Sciences in Partial Fulfillment of the Requirements for the Degree of DOCTOR OF PHILOSOPHY by Shane Paul Krafft, B.S., P.S.M. Houston, Texas August, 2016
iii
To my wife, Erin. To say that I couldn't have done this without you is an understatement. Thank you for still loving me when I have failed you. Thank you for always encouraging me to be a better man. Thank you for your patience in this season. I can't wait to see what the Lord has in store for us next! And to my baby girl, Nora. I'm so happy you are here:)
iv
ACKNOWLEDGEMENTS First and foremost, I would like to start by thanking my advisor, Dr. Mary Martel, for taking me on as a student. The patience and direction she has granted me is what made this possible. I am indebted to her for the opportunities and advice she has extended to me over the past several years. I would like to thank Drs. Tina Briere and Laurence Court for their input and direction with my research. Whether they realize it or not, their advice at various points along the way has also been instrumental to my growth professionally. I would like to thank Drs. Francesco Stingo and Arvind Rao for their insight and unique perspective. Their encouragement and guidance in aspects of my research that fall outside the norms of medical physics have been invaluable. I would also like to thank the financial support provided to me by the Cancer Prevention Research Institute of Texas Graduate Scholar Award and the Rosalie B. Hite Fellowship in Cancer Research. I simply would not have been able to continue without this support. Most of all, I would like to thank my family ‐‐‐ my parents and brother who have been unwavering in their support. And to my wife who trusted and supported me when I said I wanted to move us to Houston. In this journey, there have been many forks in the road along the way, but my family has always nudged me in the right direction.
v UTILIZING COMPUTED TOMOGRAPHY IMAGE FEATURES TO ADVANCE PREDICTION OF RADIATION PNEUMONITIS Shane Paul Krafft, B.S., P.S.M. Advisory Professor: Mary K. Martel, Ph.D. Improving outcomes for non‐small‐cell lung cancer patients treated with radiation therapy (RT) requires optimizing the balance between local tumor control and risk of normal tissue toxicity. In approximately 20% of patients, severe acute symptomatic lung toxicity, termed radiation pneumonitis (RP), still occurs. Identifying the individuals at risk of RP prior to or early during treatment offers tremendous potential to improve RT by providing the physician with information to assist in making clinical decisions that enhance therapy. Our central goal for this work was to demonstrate the potential gain in predictive accuracy of normal tissue complication probability models for RP by considering CT‐ based image features extracted from the normal lung volume. To accomplish this, a software framework was first built to facilitate CT image feature extraction using multiple image analysis methods. Subsequently, we applied the implemented methods towards understanding the temporal change in the normal lung volume during treatment. After identifying a subset of highly reproducible and non‐redundant image features, we investigated change in lung features on weekly CT image sets acquired during treatment. While multiple features exhibited significant association with dose, no temporal response was identified and we were unable to produce a predictive model that could outperform simple treatment‐related factors. CT‐based image features calculated in regional subvolumes and on a voxel‐wise basis in the normal lung were explored in the context of RP incidence. There was no clear spatial variation in the considered regionally extracted features or voxel‐based feature maps. However, a limited subset of features were
vi significantly associated with RP which may be a useful finding to consider in development of predictive models to assess toxicity risk. We also considered the utility of pre‐treatment total normal lung CT features for predicting RP using LASSO logistic regression and were able to successfully demonstrate improved discrimination of RP using such features relative to models constructed with clinical and dosimetric variables only. This is a significant step towards building robust models of RP with image based features that can subsequently be used to achieve personalized RT.
vii
TABLE OF CONTENTS ACKNOWLEDGEMENTS ............................................................................................................................. iv TABLE OF CONTENTS ................................................................................................................................ vii LIST OF FIGURES ........................................................................................................................................ xi LIST OF TABLES ........................................................................................................................................ xiv CHAPTER 1: INTRODUCTION ..................................................................................................................... 1 Purpose and Central Hypothesis ........................................................................................................... 6 Specific Aims .......................................................................................................................................... 7 CHAPTER 2: DEVELOPING A FRAMEWORK FOR EXTRACTION OF CT IMAGE FEATURES IN A RADIATION ONCOLOGY ENVIRONMENT ...................................................................................................................... 9 INTRODUCTION ..................................................................................................................................... 9 DESCRIPTION OF SOFTWARE .............................................................................................................. 11 Project Creation and Data Import ................................................................................................... 13 CT‐based Image Feature Extraction ................................................................................................ 14 Dosimetric Data Extraction ............................................................................................................. 18 Initial Validation ............................................................................................................................... 20 SUMMARY ........................................................................................................................................... 21 CHAPTER 3: CHARACTERIZING RADIOMICS FEATURES FOR ANALYSIS OF 4‐DIMENSIONAL CT IMAGES IN THE NORMAL LUNG................................................................................................................................. 22 INTRODUCTION ................................................................................................................................... 22 METHODS ............................................................................................................................................ 23 Patient Selection and CT Image Acquisition ................................................................................... 23 Volume Segmentation ..................................................................................................................... 25 CT Image Feature Extraction ........................................................................................................... 25 4D‐CT Phase Reproducibility and Test‐Retest Repeatability .......................................................... 26 Assessment of Feature Set Collinearity .......................................................................................... 27 RESULTS ............................................................................................................................................... 28 4D‐CT Phase Reproducibility ........................................................................................................... 28 Test‐Retest Repeatability ................................................................................................................ 32 Machine‐Related Repeatability ....................................................................................................... 34 Feature Set Collinearity ................................................................................................................... 35 DISCUSSION ......................................................................................................................................... 40 CONCLUSIONS ..................................................................................................................................... 45 CHAPTER 4: TIME AND DOSE RELATED RESPONSE OF NORMAL LUNG CT IMAGE FEATURES DURING RADIATION THERAPY FOR NON‐SMALL‐CELL LUNG CANCER ................................................................. 46 INTRODUCTION ................................................................................................................................... 46 METHODS ............................................................................................................................................ 48
viii Patient Selection and Treatment Data ............................................................................................ 48 CT Image Acquisition and Volume Segmentation .......................................................................... 49 CT Image Feature Extraction ........................................................................................................... 50 Univariable Analysis: Total Lung Features ...................................................................................... 54 Linear Mixed Modeling and Random Forest RP Classifier .............................................................. 54 RESULTS ............................................................................................................................................... 56 DISCUSSION ......................................................................................................................................... 61 CONCLUSIONS ..................................................................................................................................... 66 CHAPTER 5: QUANTIFYING CT RADIOMICS FEATURES IN REGIONALLY‐DEFINED SUBVOLUMES OF THE NORMAL LUNG ........................................................................................................................................ 67 INTRODUCTION ................................................................................................................................... 67 METHODS ............................................................................................................................................ 68 Patient Selection, CT Image Acquisition, and Lung Volume Segmentation ................................... 68 CT Image Feature Extraction: Geometrically‐Defined Subvolumes ............................................... 69 CT Image Feature Extraction: Voxel‐wise Feature Calculation ....................................................... 71 Test‐Retest Repeatability and Redundancy in Geometrically‐Defined Subvolumes ..................... 73 Test‐Retest Repeatability in Voxel‐wise Feature Maps .................................................................. 74 RESULTS ............................................................................................................................................... 74 Characterization of Features Extracted from Geometrically‐Defined Subvolumes ....................... 74 Characterization of Voxel‐wise Feature Maps ................................................................................ 78 DISCUSSION ......................................................................................................................................... 80 CONCLUSIONS ..................................................................................................................................... 84 CHAPTER 6: INVESTIGATION OF THE RELATIONSHIP BETWEEN RADIATION PNEUMONITIS AND THE SPATIAL DIFFERENCES IN CT‐BASED LUNG RADIOMICS FEATURES ....................................................... 85 INTRODUCTION ................................................................................................................................... 85 METHODS ............................................................................................................................................ 86 Patient Database and Endpoint Definition ..................................................................................... 86 CT Image Acquisition and Segmentation ........................................................................................ 87 CT Image Feature in Geometrically‐Defined Regional Subvolumes ............................................... 88 Voxel‐based CT Image Feature Maps ............................................................................................. 91 RESULTS ............................................................................................................................................... 92 DISCUSSION ......................................................................................................................................... 99 CONCLUSIONS ................................................................................................................................... 104 CHAPTER 7: INCORPORATION OF CT LUNG RADIOMICS FEATURE DISTRIBUTIONS INTO PREDICTIVE MODELS FOR RADIATION PNEUMONITIS ............................................................................................. 105 INTRODUCTION ................................................................................................................................. 105 METHODS .......................................................................................................................................... 106
ix Patient Specific Clinical and Treatment Data ................................................................................ 106 CT Image Acquisition and Dosimetric Analysis ............................................................................. 107 Voxel‐based CT Image Feature Maps ........................................................................................... 108 NTCP Model Building ..................................................................................................................... 109 RESULTS ............................................................................................................................................. 111 DISCUSSION ....................................................................................................................................... 116 CONCLUSIONS ................................................................................................................................... 120 CHAPTER 8: THE UTILITY OF QUANTITATIVE CT RADIOMICS FEATURES FOR IMPROVED PREDICTION OF RADIATION PNEUMONITIS .................................................................................................................... 121 INTRODUCTION ................................................................................................................................. 121 METHODS .......................................................................................................................................... 123 Patient Specific Clinical and Treatment Data ................................................................................ 123 Dosimetric Analysis ....................................................................................................................... 125 CT Image Feature Extraction ......................................................................................................... 125 LASSO Logistic Regression ............................................................................................................. 126 RESULTS ............................................................................................................................................. 128 DISCUSSION ....................................................................................................................................... 132 CONCLUSIONS ................................................................................................................................... 136 CHAPTER 9: DISCUSSION ....................................................................................................................... 137 Future Directions ............................................................................................................................... 139 APPENDIX 1: CT IMAGE FEATURE EXTRACTION .................................................................................... 141 First Order Histogram Features ........................................................................................................ 141 HIST Feature List: ........................................................................................................................... 141 Preprocessing and Filter List: ........................................................................................................ 144 Gray Level Co‐occurrence Features .................................................................................................. 145 GLCM Feature List: ........................................................................................................................ 146 Gray Level Run Length Features ....................................................................................................... 150 GLRLM Feature List: ...................................................................................................................... 150 Neighborhood Gray‐Tone Difference Features ................................................................................ 152 NGTDM Feature List: ..................................................................................................................... 153 Laws' Filtered Features ...................................................................................................................... 154 LAWS2D Feature List: .................................................................................................................... 154 Lung‐Specific CT Features ................................................................................................................. 156 LUNG Feature List: ........................................................................................................................ 156 APPENDIX 2: DOSIMETRIC FEATURE EXTRACTION ............................................................................... 160 VITA ........................................................................................................................................................ 163
x REFERENCES .......................................................................................................................................... 164
xi
LIST OF FIGURES Figure 1. TREX project setup GUI. The user navigates through the TPS file system by selecting the server, institution, patient, plan, and structure (i.e. ROI). Optionally, a dose distribution associated with the selected plan can be added. Multiple entries are added to the project workspace to build the TREX project for subsequent image and dosimetric feature analysis. ............................................................ 12 Figure 2. An example of the current visualization module. Image, structure, dose, and feature maps can be displayed and browsed for easy review. ............................................................................................ 13 Figure 3. Global image feature extraction parameter window. Six different radiomics feature classes can be used, each with their own set of control parameters................................................................. 17 Figure 4. Local image feature (i.e. map) extraction parameter window. Similar to Figure 3, but additional options to select the locally‐defined ROI are included. .......................................................................... 18 Figure 5. Dosimetric feature extraction parameter window. Five different classes are implemented. 20 Figure 6. Absolute change in lung density as a function of phase. ......................................................... 29 Figure 7. Percent change in feature value (relative to T50) as a function of phase for four different features. ................................................................................................................................................... 29 Figure 8. Cumulative distribution of the range of variation in % difference (relative to T50) by feature class. ........................................................................................................................................................ 30 Figure 9. Maximum and minimum variation in % difference (relative to T50) image sets for HIST and LUNG features. Variation across all phases and 40‐60% phases is shown. A randomly selected subset of 100 HIST features is included in this plot. ............................................................................................... 31 Figure 10. Cumulative distribution of CCC values across all features between T50 and the other image phases. ..................................................................................................................................................... 31 Figure 11. Cumulative distribution of CCC on test‐retest image sets. .................................................... 32 Figure 12. Absolute difference in total lung volume between test and retest scans. Mean difference 1 SD is 25 180, ‐33 190, 43 355, NaN NA, NaN NA cc for the AVG, EXP, INSP, T0, and T50 image sets, respectively. ......................................................................................................................... 33 Figure 13. Cumulative distribution of CCC on T50 test‐retest image sets by feature class. .................. 34 Figure 14. Machine dependent CCC determined from T50 test‐retest image sets. .............................. 35 Figure 15. Correlation matrix of the top 50 features with the highest CCC. .......................................... 36 Figure 16. Correlation matrix of the filtered subset of features. 53 features have a maximum pairwise correlation of 0.85. .................................................................................................................................. 37 Figure 17. Hierarchical clustering of the filtered subset of features. The rows are clustered according to patient scan using a Euclidean distance metric and the columns are clustered according to the Pearson's correlation distance between the remaining features. .......................................................................... 40 Figure 18. Population averaged change in three different features extracted from the total lung volume during RT grouped by RP outcome. Shaded areas represent 95% confidence intervals. ...................... 57 Figure 19. Population dose‐response curve for change in lung density during RT. Shaded areas represent 95% confidence intervals. ....................................................................................................................... 58 Figure 20. Lattice plot of lung density for multiple dose‐defined regions during RT. Each panel represents a unique patient. Displayed lines are within‐patient and within‐region linear regression fits. Panels with shaded background indicate patients with RP grade 2. Patient F is the lone patient that developed severe (grade 3) RP. .......................................................................................................... 59
xii Figure 21. Population dose‐response curve for Laws' filtered (L5,S5) skewness. Shaded areas represent 95% confidence intervals. ....................................................................................................................... 60 Figure 22. ROC plot for random forest models constructed with 1) only treatment‐related metrics and 2) the addition of patient‐specific mixed model coefficients for intercept, dose, and time. Shaded areas represent 95% confidence intervals on sensitivity. ................................................................................ 61 Figure 23. Population dose‐response curve for lung density during RT. Adjustment applied such that difference in region receiving > observations) or to probe complex, nonlinear interactions between predictive variables and outcome [29]. As a result, statistical (or machine) learning [30] approaches have been considered for normal tissue toxicity prediction [31] and provide potential to identify meaningful patterns in data to improve prediction accuracy. Particularly in the era of precision medicine, accurate prediction of outcomes is a necessary tool to support clinical decisions [32,33]. Not only are new approaches for modeling necessary, but diverse categories of high‐quality data are also needed. In particular, imaging has and will continue to play an important role for assessment of radiation‐induced normal tissue toxicities [34], particularly in the lung. The spatial and temporal heterogeneity of the lung volume makes both anatomical and functional imaging well‐suited for understanding and quantifying RILD progression and risks. In particular, post‐RT imaging of the lung volume provides the potential to identify RP before the onset of symptoms. Additionally, assessment via imaging methods can serve as quantitative measures of severity that overcome limitations with ordinal grading scales. Accordingly, imaging in the context of RILD assessment has been widely investigated. Multiple imaging modalities have been used to identify lung changes indicative of RILD after conventionally‐fractionated RT. Chest X‐ray [35,36], SPECT [37,38], MRI [39], FDG‐PET [40,41], and 4‐dimensional computed tomography (4D‐CT) based ventilation [42] have been employed to measure changes in the lung after therapy. Diagnostic quality CT is the most widely considered method for RP assessment [43–53]. Despite the abundance of resources devoted to identifying an imaging assay useful for RILD quantification, there is no accepted standard. Furthermore, successful association of imaging assessment to clinically relevant symptoms is sparse. Beyond post‐RT assessment, there is substantial advantage to identifying image characteristics that may correlate with symptomatic RILD during or before treatment. SPECT perfusion studies have been used to identify functional areas of the lung which may be more vulnerable to damage for NSCLC
5 patients treated with RT [54–57]. Pre‐RT FDG‐PET studies have also been used to localize areas of lung more susceptible to injury [58,59]. De Ruysscher et al. [60] found an increase in FDG‐PET
uptake during RT correlates to symptomatic lung toxicity. The use of 4D‐CT based ventilation has also been investigated during RT [61], though no consistent change in ventilation has been discovered. Vinogradskiy et al. [62] considered the interaction of dose with 4D‐CT ventilation but failed to identify a significant correlation to RP. Bertelsen et al. [63] demonstrated early, dose‐dependent changes in lung density on serial cone‐beam CT scans that subsequently have been related to post‐RT lung CT density [64]; however, no link to clinical lung toxicity has been noted. The impact of pre‐existing interstitial lung disease (ILD) [65,66] and chronic obstructive pulmonary disease (COPD) [67,68] on RP risk have been assessed via CT imaging. Makimoto et al. [65] suggested that pre‐existing lung changes assessed on CT or plain chest films may predict for symptomatic RP in patients treated with thoracic RT. Sanuki et al. [66] similarly demonstrated that pre‐existing pulmonary changes on CT judged by a panel of radiologists was significantly associated with RP grade 3 in patients treated with conventionally fractionated thoracic RT. Visual classification of severe pulmonary emphysema by radiologists using low attenuation areas (LAAs) on CT was significantly associated with higher incidence of RP by Kimura et al. [67]. However, assessing the severity of lung disease using observer studies is still subjective and does not sufficiently capture the variation across the lung volume or between patients. Given that there is evidence that application of CT lung imaging may relate to RP, improved methods for lung analysis should be considered in this context. Fortunately, outside of the radiation oncology community, quantitative analysis of lung parenchymal changes using CT has been widely investigated as means to describe the morphology and understand the mechanisms of lung disease [69–78]. Particularly in the context of interstitial and obstructive lung diseases, lung densitometry and texture analysis methods have been applied for differentiation of lung phenotypes that might assist in early diagnosis and understanding of pathogenesis. Furthermore, new,
6 high‐throughput methods of image analysis are being employed to extract more information from medical images. Recently, Cunliffe et al. considered some of these methods for correlation with visually scored severity of lung changes [79] and development of symptomatic radiation pneumonitis after RT [80]. This field of research, referred to as radiomics, has significant potential to provide high‐quality descriptors that may be useful with advanced modeling methods to significantly improve our ability to predict RP.
Purpose and Central Hypothesis In the design and optimization of radiation therapy (RT) treatment plans, it is vital to balance the risk of normal tissue toxicity against peak tumor control. This, however, is challenging as individual patients differ in their response to radiation ‐‐‐ some may be more radioresistant, requiring an escalated dose to achieve acceptable tumor control while others may be more radiosensitive, necessitating a lower dose to limit toxicity. Currently, approximately 10‐20% of patients treated with standard of care RT for non‐small‐cell lung cancer experience severe acute radiation‐induced lung damage. Symptomatically this injury is manifested as radiation pneumonitis and is considered a significant issue for lung cancer patients. RP may necessitate the administration of oxygen or steroids and can be lethal if progression occurs without intervention. Normal tissue complication probability models of lung toxicity can provide an estimate of RP risk and can be used before treatment to guide selection of the prescribed radiation dose and limit severe lung damage. While numerous patient and treatment‐related characteristics have been used in these models, they have limited clinical applicability due to poor predictive performance. In the presented research, I have leveraged a different class of data ‐ computed tomography‐based image features ‐ as means of improving our understanding of and ability to predict RP. Over the past decade the role of CT imaging in the treatment of cancer has migrated from being primarily used as a diagnostic tool and is now seen as a means to provide information that complements clinical,
7 pathologic, and genomic data. Extraction of image features from CT datasets provides potential to better understand progression and risk of lung damage on a patient‐specific basis. At present, lung cancer poses a major problem to public health. The presented research methodologies have the potential to significantly improve patient outcomes by identifying personalized risk of treatment related toxicity. The long‐term goal is to advance personalized radiation therapy for NSCLC patients by improving the accuracy of NTCP models for predicting radiation pneumonitis risk. The objective of this project was to identify quantitative image features which will discern the spatial and temporal differences in the lung that influence the baseline risk of radiation‐induced lung damage. Our central hypothesis is that CT‐based quantitative image features can be incorporated into NTCP models to significantly improve prediction of radiation pneumonitis.
Specific Aims The specific aims of my research and the related studies are stated below: Specific Aim 1: To detect and quantify the time and dose related response of normal lung tissue during radiation therapy using CT image features. Working Hypothesis: The time and dose related progression of radiation‐induced lung damage can be detected by using CT image features extracted from 4‐dimensional CT (4D‐CT) studies acquired during radiation therapy. •
Study 1.1: Characterizing radiomics features for analysis of 4‐dimensional CT images in the normal lung
•
Study 1.2: Time and dose related response of normal lung CT image features during radiation therapy for non‐small‐cell lung cancer
8 Specific Aim 2: To determine the relationship between the incidence of radiation pneumonitis and the spatial distribution of both dose and CT image features. Working Hypothesis: Investigation of the spatial dose distribution and CT image analysis can be used to understand and localize regions of the lung that are more susceptible to injury. •
Study 2.1: Quantifying CT radiomics features in regionally‐defined subvolumes of the normal lung
•
Study 2.2: Investigation of the relationship between radiation pneumonitis and the spatial differences in CT‐based lung radiomics features
Specific Aim 3: To incorporate CT image features into dose response modeling of radiation pneumonitis. Working Hypothesis: The accuracy of radiation pneumonitis risk models can be significantly improved by incorporating image features extracted from CT studies. •
Study 3.1: Incorporation of CT lung radiomics feature distributions in predictive modeling of radiation pneumonitis
•
Study 3.2: The utility of quantitative CT radiomics features for improved prediction of radiation pneumonitis
9
CHAPTER 2: DEVELOPING A FRAMEWORK FOR EXTRACTION OF CT IMAGE FEATURES IN A RADIATION ONCOLOGY ENVIRONMENT INTRODUCTION Imaging is a routine and increasingly important aspect of medical care in the era of precision medicine. Having evolved from being primarily used for diagnostic purposes, medical imaging plays a central role in defining prognosis, monitoring disease progression, screening, treatment planning and guidance, and assessment of therapeutic interventions. An already abundant and growing number of imaging technologies can provide anatomical, functional, and molecular information to non‐invasively probe the spatial and temporal heterogeneities that are present in the underlying disease of an individual [81]. With the wealth of imaging studies now being conducted, medical image analysis has grown rapidly as means to improve clinical decision making [32,33,82,83]. In particular, the field of radiomics involves the extraction and analysis of large numbers of advanced quantitative features from medical image data [83–85]. Inspired by the "omics" revolution (i.e. genomics, proteomics, metabolomics), data gathered from a variety of imaging modalities are being routinely mined and analyzed to aid clinicians [83]. Though much of the methodology is similar, radiomics is distinct from more narrowly defined computer‐aided diagnosis (CAD) systems typically designed to solve one specific diagnostic task [83]. As a result, radiomics is being applied to study a multitude of disease sites and interventions [83]. At its core, the radiomics hypothesis is that the quantifiable structure of an imaged volume of interest reflects its underlying physiology and pathology [81,84]. In turn, this can provide information that may be useful for diagnosis, prognosis, or prediction. The term "radiomics" has been popularized in the oncology community in recent years where mineable databases of quantifiable image measures have
10 been created to characterize solid tumors. The image analysis techniques utilized, however, are not unique to oncologic imaging, nor are they unique to the discipline of medical imaging. Haralick et al. [86], for instance, originally proposed a set of measures to describe the texture of satellite images, but they have since become a widely used set of features to describe heterogeneity with multiple medical imaging modalities. A myriad of methods can be implemented, giving rise to datasets that extract hundreds or thousands of features, thus earning the ‐omics suffix to describe the field. While technological advances and conception of the term "radiomics" have resulted in increased exposure and appeal, commonly implemented methods for extracting quantifiable image features have been well‐established. Of particular interest is the utility of CT based image features to aid in quantification and classification of interstitial and diffuse lung diseases. Diagnosis of mild COPD, for example, is often challenging and lacks objectivity in assessment. In response, multiple groups have analyzed CT image sets to define low attenuation areas of the lung as quantitative measures of COPD status. Correlation of simple CT metrics to pathologic specimens [69,70] and pulmonary function tests [71] demonstrates the potential of image‐based analysis. The introduction of texture analysis methods [87] applied to multiple parenchymal pathologies [72–78] has further improved quantification and classification of underlying lung disease. This work has established a precedent for utilizing CT‐based analysis of lung volumes that may achieve better characterization of disease prognosis and treatment‐ related response in a variety of medical disciplines. The key difference between these existing studies and radiomics is in the size of the feature space and methods for analysis. Radiomics is partially defined by the high‐dimensionality of the extracted image feature data. Computational requirements used to pose limits on the number and type of features to be extracted, but this obstacle is no longer a primary barrier to medical image analysis with current computing resources. Additionally, more sophisticated methods for statistical analysis, primarily machine learning methods, can be employed to account for the dimensionality of the data. Proper
11 application of such techniques allows for thousands of features to be considered in construction of prognostic or prediction models while still being able to achieve a clinically useful and generalizable result. While there is much promise, there are several limitations to radiomics research. Anatomical or image noise during acquisition, region of interest identification and segmentation, and appropriate statistical methods for analysis of high‐dimensional datasets are barriers that must be conquered for radiomics to provide clinically relevant information. Secondary to these impediments, parameters utilized for feature extraction can vary and make it difficult to achieve reproducible results; however, this problem is more easily overcome. While a limited number of software packages suitable for radiomics feature extraction have been made available, only recently has a true open‐source solution for reproducible radiomics research been shared in the form of the open source, MATLAB‐based package, ibex [88]. Similarly, we have designed a platform specific to the purposes of this project and studies to be presented in the following chapters. "TREX" is a MATLAB‐based software platform for analysis of CT‐ based images that exist within the framework of a radiation therapy treatment planning system. It provides the ability to extract both image and dosimetric data using multiple methods. Further amendments have been incorporated to facilitate analysis specific to that of the normal lung volume, but TREX can be utilized for analysis of any segmented CT structure. Here we describe the current functionality of TREX.
DESCRIPTION OF SOFTWARE TREX was developed in a MATLAB (Mathworks, Natick, MA) environment and primarily facilitates analysis of CT images and regions of interest (ROIs) that exist within the Pinnacle3 treatment planning system (Philips HealthCare, Fitchburg, WI). Accordingly, though it is an important part of high‐ throughput radiomics research, data preparation including image segmentation and dose calculation, rely on the tools available in Pinnacle3.
12
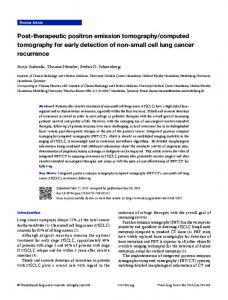
Figure 1. TREX project setup GUI. The user navigates through the TPS file system by selecting the server, institution, patient, plan, and structure (i.e. ROI). Optionally, a dose distribution associated with the selected plan can be added. Multiple entries are added to the project workspace to build the TREX project for subsequent image and dosimetric feature analysis. A graphical user interface was constructed to facilitate browsing of an existing Pinnacle3 TPS file system after establishing an FTP connection with the TPS server (Figure 1). The user is prompted to navigate each level of the TPS file system (institution, patient, and treatment plan) to identify the primary CT image set associated with a given plan for a patient of interest. The user can select and view the contoured structures, primary CT image set, and calculated dose distributions that exist within the selected patient treatment plan. The option also exists to create new structures based on simple Boolean operations applied to the set of existing contoured structures. The user builds a project by adding multiple structures, plans, and patients to the project workspace. The data can then be imported and converted for further analysis or visualization. Two main categories for data analysis are currently implemented: 1) CT‐based image feature extraction and 2) dosimetric data extraction. Each category contains a subset of different modules to calculate different classes of features. A set of tools
13 to visualize the image, structure, and dose data have also been created to facilitate local review (Figure 2).
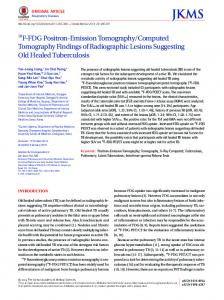
Figure 2. An example of the current visualization module. Image, structure, dose, and feature maps can be displayed and browsed for easy review.
Project Creation and Data Import Each new TREX project is initiated by defining a specific project name and a local directory location. The user proceeds by establishing a connection with the Pinnacle3 server and identifying the set of CT images and contoured structures to serve as input through the image and/or dose feature extraction algorithms. After selecting the image set and structure associated with a given patient treatment plan, the user adds an entry with the selected information to the project workspace. Optionally, an available dose distribution associated with the given plan can be added to the workspace for extraction and comparison of dosimetric data.
14 Once the setup workspace is populated with the patient of interest, including image, and structure data, TREX proceeds with a local import and conversion of the data to more easily facilitate analysis. This automated process steps through each entry in the project workspace, establishes a connection with the Pinnacle3 server, and downloads all of the requisite data from the TPS in its native format. Each patient is given a subdirectory within the main project directory where the data is locally transferred. For each entry, the CT image data is subsequently read and stored as a 3‐dimensional array with the available metadata in a binary MATLAB data format (.mat file). The contoured structure (i.e. ROI) data is read and converted to a binary mask with the same dimensions as the primary CT image set. The ROI data is saved as a separate MATLAB file along with available image metadata. If a trial dose distribution is included with a given entry, the native Pinnacle files are used to reconstruct the planned dose distribution as well. This is also saved as a separate MATLAB file. Each MATLAB file is saved to the appropriate patient directory and tagged with a randomly generated unique identifier. After each entry in the project setup workspace has been imported and converted to the desired format, dosimetric and image feature analysis can proceed. If changes are made to the project setup workspace, data import can easily be run again to add a new or remove an existing entry. If import is run again, a feedback mechanism is also established to look for any changes that may have also occurred in the TPS due to alterations in the selected ROIs and/or dose distributions.
CT‐based Image Feature Extraction CT‐based image (i.e. radiomics) feature extraction was the primary purpose for the creation of TREX and it was implemented in two different ways depending on how the ROI is defined. 1)
Global/regional feature extraction: The imported and converted structure mask for each entry is the considered ROI for feature calculation. All voxels within the masked volume are used to generate global measures from the input image.
15 2)
Local feature extraction: The imported and converted structure mask for each entry serves as the boundaries to limit calculation of local feature values. Features are calculated in smaller ROIs (e.g. 31 x 31 pixel blocks) within the larger masked structure. Depending on the spacing of the ROIs, feature values can be calculated on a voxel‐by‐voxel basis throughout the masked image or, if coarser spacing of ROIs is required, interpolation can be used to create a voxel‐wise feature map at all locations in the masked structure volume.
With a given image set and ROI, six different radiomics feature classes were considered with independent modules being built in TREX for each: •
First Order Histogram Features: Twenty‐three first order histogram features are extracted from each image. The features can be calculated from the original, unfiltered image. Additionally, prior to feature calculation, image preprocessing can be applied with 14 different filters or thresholds (2D and 3D gradient sobel, local entropy, local range, local standard deviation, 5 Laplacian of Gaussian 2D filters, and 4 image thresholds).
•
Gray Level Co‐occurrence Features: The gray level co‐occurrence matrix (GLCM) is used to define texture in an image by determining the distribution of co‐occurring voxel values along a given displacement [86]. From each GLCM, 23 gray level co‐occurrence features are extracted [86,89]. The original CT scan can be linearly downsampled to 16, 32, 64, 128, and 256 gray levels (bit depths 4‐8). The displacement vector is defined by both the direction and distance for comparison of voxel pairs. Thirteen unique directions in 3‐dimensional space are considered. Two additional GLCMs can be calculated by summing the GLCM from all axial (i.e. 2D) directions and from summing all 13 3D directions. The displacement is also defined using distances of 1, 3, and 5 voxels.
•
Gray Level Run Length Features: The gray level run length matrix (GLRLM), similar to the GLCM, is used to define texture in an image by considering strings of consecutive voxels that have similar
16 gray values along a given direction [90]. From each GLRLM, 11 gray level run length features are extracted [90–93]. The original image can be downsampled to bit depths from 4 to 8. As with the GLCM, 13 individual 3D directions as well as the 2D and 3D summed GLRLMs can be calculated. •
Neighborhood Gray‐Tone Difference Features: The neighborhood gray‐tone difference matrix (NGTDM) defines texture in an image by calculating the average gray level difference between each voxel and its neighboring voxels [94]. Five different neighborhood gray‐tone difference features are extracted from each NGTDM [94]. As with the GLCM and GLRLM methods, the original image can be downsampled to bit depths of 4‐8. Additionally, each neighborhood is defined by considering only immediately adjacent voxels (i.e. distance = 1) in two or three dimensions.
•
Laws' Filtered Features: Laws' filters are a series of 5 one dimensional spatial filters that are convolved with the image to emphasize textural structure [95]. Fifteen pairs of the Laws' 1x5 filters are implemented and can be applied to each axial slice of the original image. Eight histogram metrics are subsequently extracted from the filtered image.
•
Lung‐Specific CT Features: Multiple methods have been proposed to quantify COPD in patients using CT. In total, 23 unique features [70,76,96–100] representing the volume and cluster density of low attenuation areas in the lung are calculated from the original image.
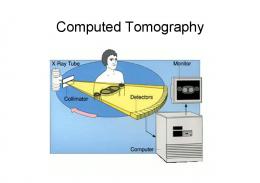
Further description of the calculated features is provided in Appendix 1. Feature extraction parameters specific to the radiomics feature class can be selected and project‐ specific parameter profiles can be defined within TREX (Figure 3 and Figure 4). Once the modules and parameters of interest are selected, image feature calculation can be initiated. TREX steps through each module (or class) sequentially. After all features have been calculated for every entry with a given feature module, the result is saved as a MATLAB file within the project directory. The extracted feature space is written to an array with each row representing a separate entry from the project workspace
17 and each column defining a unique feature. If feature extraction is repeated with a given module using additional parameters, TREX searches the previously created feature space and ignores calculation of features that have already been completed to save computation time. Additionally, certain image calculation algorithms can take advantage of multiple CPUs via MATLAB's parallel processing toolbox.
Figure 3. Global image feature extraction parameter window. Six different radiomics feature classes can be used, each with their own set of control parameters.
18
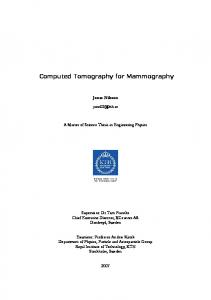
Figure 4. Local image feature (i.e. map) extraction parameter window. Similar to Figure 3, but additional options to select the locally‐defined ROI are included.
Dosimetric Data Extraction A necessary component of RT response assessment or prediction is the dosimetric data, which has been explicitly considered in TREX. After the data has been imported, several modules exist to extract dosimetric and plan‐specific data (Figure 5). These include: •
Dose‐Volume Histogram (DVH) Features: Using the imported dose distribution, a series of first order statistics are calculated in the given ROI. Additionally, absolute and relative volume receiving at least X Gy (
,
), minimum dose to the hottest X% volume (
), and mean dose
19 to the hottest and coldest X% volume (
,
) are calculated in 5% or 5 Gy intervals. In
total 149 different dosimetric features are returned. This is the primary module for dosimetric data extraction. •
Location Features: Based on the masked ROI volume, the absolute and relative locations of the bounding box encompassing the ROI as well as the location of the ROI centroid are determined. This has proven useful for defining the relative position of the GTV volume within the total lung as in Reference [26].
•
Plan Features: The Pinnacle3 data is parsed to return a set of 25 different treatment plan parameters. This includes parameters pertaining to the machine energy, number of beams, number of fractions, machine name, and heterogeneity correction, among others.
•
Spatially‐weighted DVH: Borrowing from the method proposed by Vinogradskiy et al. [101], a set of DVH features was calculated from several spatially‐weighted dose distributions. Four different weighting matrices were created by linearly scaling values on the range [0, 1] in the following orientations: superior‐inferior, anterior‐posterior, right‐left, and radially (see Reference [101]). Each weighting matrix was created to match the dimensions of the bounding box encompassing the ROI such that the dose distribution can be weighted with each of the considered weighting schemes.
•
Dose‐Radiomics Histogram (DRH) Features: As detailed above, a set of local CT image features can be calculated to give a series of voxel‐wise feature maps. These feature maps are subsequently used as surrogates of function and used to extract DRH features in a manner analogous to the concept of a dose‐function histogram [54,56,57].
Further description of the features is provided in Appendix 2.
20
Figure 5. Dosimetric feature extraction parameter window. Five different classes are implemented.
Initial Validation Accuracy of the dosimetric and image feature calculation is vital to build robust and useful clinical decision making tools. Validation of the image feature calculation methods was challenging due to scarcity of packages for such analysis during development. Several virtual phantom image sets were employed when possible to test calculated feature values. A package originally created for MRI texture analysis, Mazda [102], was used to aid in validation of some features. Additionally, the alpha version of IBEX [88] served as a check in the later stages of development. In some cases, the implementation of the feature algorithm can result in differences upon comparison. Typically this is a function of the preferred methods used for image preprocessing or bit depth downsampling that can easily be accounted for, but this does complicate comparison of results between different software packages.
21 Dosimetric features have been compared to those calculated in the TPS. Minor differences in the calculated volumes, presumably due to partial voxel averaging within Pinnacle3 produce differences in feature values on the order of 3%. Multiple treatment plans were also exported from Pinnacle3 using a DICOM exporter. These plans were subsequently imported into CERR [103] to facilitate direct comparison of scan, structure, and dose objects in a MATLAB environment. To strengthen validation and encourage reproducible research practices, the MATLAB source code will be provided at https://github.com/Krafft‐Research/.
SUMMARY TREX was initially conceived to provide a single framework for image feature calculation and dosimetric data extraction from RT treatment plan data. Other packages are now widely used specifically for radiomics analysis [88] and well‐established radiotherapy research platforms such as CERR [103] have begun to develop similar radiomics tools. This leaves the future of TREX uncertain; however, the package is easily extensible. Moving outside of the Pinnacle3 environment, DICOM import and ROI contouring tools can be integrated. Additionally, new feature classes can be implemented by creation of new modules and current methods can be extended with alternative image preprocessing schemes and new features. The ability to move beyond CT‐based image feature calculation to other modalities is also on the horizon. We have successfully implemented multiple methods to permit true high‐ throughput calculation of mineable image and treatment data.
22
CHAPTER 3: CHARACTERIZING RADIOMICS FEATURES FOR ANALYSIS OF 4‐DIMENSIONAL CT IMAGES IN THE NORMAL LUNG INTRODUCTION Quantitative analysis of lung parenchymal changes using CT has been widely investigated as means to describe the morphology and understand the mechanisms of lung disease [69–78]. Particularly in the context of interstitial and obstructive lung diseases, lung densitometry and texture analysis methods have been applied for differentiation of lung phenotypes that might assist in early diagnosis and understanding of pathogenesis. Building off of this work, there is obvious interest in application of such methods for improved and automated assessment of the risk, progression, and/or quantification of lung response in multiple disciplines. Specific to the radiation oncology community, use of CT density measures have been considered for assessing lung changes that might correlate to the delivered radiation dose and symptomatic radiation‐ induced lung damage resulting from radiation therapy (RT) [43–53]. The baseline appearance and radiation‐induced changes in the lung volume, however, are heterogeneous in nature [104], making simple radiologic density measurements of limited value for risk prediction or treatment response assessment in the normal lung. Bearing in mind the quantitative lung CT literature, this has led to consideration of a large number of radiomics‐based [83–85,89] image features which may capture additional information about the structure and function of the organ. Cunliffe et al., for example, have demonstrated change in several CT‐based image features are correlated with visually scored severity of lung changes [79] and development of symptomatic radiation pneumonitis after RT [80]. Prior to application of quantitative image features to aid in any clinical decision making, it is necessary to understand the inherent uncertainties. Though challenges still exist, this is well investigated,
23 particularly in radiomics analyses of NSCLC tumors [85,105,106]. Analysis of the normal lung, however, presents unique problems due to the anatomical composition of the organ and the effect of respiratory motion, necessitating independent characterization of features extracted from normal lung. While the differences in inspiratory and expiratory lung density have been well studied [107–109], investigation of higher‐order (i.e. texture) radiomics features have not. Additionally, the use of 4 dimensional CT [110–112] (4D‐CT) in patients treated with RT for thoracic cancers is now routine, but reproducibility and repeatability of image features in the lung volume using this modality remains unexplored. The purpose of this study is to characterize the potential variability in total lung CT image features resulting from respiration and to quantify test‐retest repeatability. We consider reproducibility and repeatability of images obtained under breath‐hold and 4D‐CT acquisition on two different scanner models and investigate collinearity in the image feature set. We aim to identify the most repeatable CT image type and present a non‐redundant CT image feature set for use in further analysis of lung volumes in an RT environment.
METHODS Patient Selection and CT Image Acquisition Twenty nine patients with non‐small‐cell lung cancer (NSCLC) were previously enrolled in an institutionally approved protocol at the University of Texas MD Anderson Cancer Center and considered in this study. Patients underwent definitive RT between 05/2005 and 05/2009. Prior to beginning RT, each patient participated in an imaging session where they were scanned under two CT acquisition modes: 4‐dimensional and breath‐hold. Patients were required to lie flat for the duration of the imaging session (~30 minutes) during which they were imaged twice under both acquisition modes. Any patient unable to breathe in a reproducible manner was removed from the study. After the first scan, the patient was asked to leave the couch and walk before returning to the imaging table
24 for the second scan. This provided test‐retest image sets to assess repeatability. Standard marking technique and immobilization using an extended wing board with T‐bar grip and Vac‐Lok cushion (Civco, Orange City, IA) was performed. In the current cohort, patients were imaged on one of two available commercial CT scanners: GE Discovery ST or GE LightSpeed RT 16 (General Electric Healthcare, Milwaukee, WI). Table 2 contains the available scanner and acquisition related characteristics. 4D‐CT acquisition occurred under cine mode with each reconstructed image sorted based on the respiratory phase recorded using the Real‐Time Position Management (RPM) Gating System (Varian Medical Systems, Palo Alto, CA). Images were sorted into 10 phases with 0% (T0) being defined as end‐inhale and 50% (T50) end‐exhale. Additionally, a secondary average (AVG) image set was derived by averaging all 10 phase images from the 4D‐CT data. Breath‐hold acquisition occurred under helical mode at both maximum inspiration (INSP) and expiration (EXP) for patients who were able to hold their breath for a sufficient length of time. Table 2. CT acquisition parameters for the test‐retest data. Parameter GE Discovery ST
GE LightSpeed RT 16
Number of Patients
12
11
17
17
Acquisition Mode
4D‐CT
Breath‐Hold
4D‐CT
Breath‐Hold
Scan Options
CINE MODE
HELICAL MODE CINE MODE
HELICAL MODE
Slice Thickness (mm) 2.5
2.5
2.5
2.5
Axial Pixel Size (mm) 0.977
0.977
0.977
0.977
kVp
120
120
120
120
Tube Current (mA)
100
300
200
493 +/‐ 20
Focal Spot Size (cm)
0.7
1.2
0.7/1.2
1.2
Filter Type
BODY FILTER
BODY FILTER
BODY FILTER
BODY FILTER
Convolution Kernel
STANDARD
STANDARD
STANDARD
STANDARD
Patient Position
HFS
HFS
HFS
HFS
25
Volume Segmentation In the current cohort, 17 patients were treated with passive scattered proton therapy while the remaining 12 were treated with 3D‐conformal or intensity modulated photon therapy. Initial segmentation of the lung volumes was performed manually using the AVG image set acquired for treatment plan dose calculation in either Eclipse (Varian Medical Systems, Palo Alto, CA) or Pinnacle (Philips Radiation Oncology Systems, Fitchburg, WI) for the proton or photon patients, respectively. The total lung volume is defined as the normal lung excluding the clinically accepted GTV. Contours on all image sets of interest were generated using an initial rigid registration of the thoracic vertebral bodies followed by an in‐house deformable image registration technique [113]. Each image set was registered to the planning CT (AVG) to create a deformation vector field. This was then used to propagate the total lung contours to the pairs of breath‐hold INSP, EXP, T0, T50, and AVG image sets for investigation of test‐retest repeatability. Additionally, contours were deformably registered to each remaining phase of the initial (i.e. test) 4D image set for assessment of phase‐related reproducibility. All contours were visually reviewed for accuracy and any inconsistencies (i.e. inclusion of the trachea) were corrected manually.
CT Image Feature Extraction For image analysis, the in‐house system described in Chapter 2 was built to extract features from the native Pinnacle data using MATLAB (Mathworks, Natick, MA). Six different radiomics feature classes were considered: •
First Order Histogram Features (336 HIST features)
•
Gray Level Co‐occurrence Features (5175 GLCM features)
•
Gray Level Run Length Features (825 GLRLM features)
•
Neighborhood Gray‐Tone Difference Features (50 NGTDM features)
26 •
Laws' Filtered Features (120 LAWS2D features)
•
Lung‐Specific CT Features (19 LUNG features)
A total of 6526 features were extracted from using each contour‐defined region of interest on every available image set.
4D‐CT Phase Reproducibility and Test‐Retest Repeatability To assess how reproducible a given feature was as a function of 4D‐CT phase, all 10 phase images from 29 patients were collected providing 290 image sets for analysis. The correlation between feature value and phase‐measured volume was calculated for each patient using the Spearman rank correlation. The percent difference on each phase image was also calculated with respect to the T50 image set. The mean percent difference across the population was subsequently calculated for each phase and used to determine the range (max ‐ min) in variation of each feature due to respiratory‐correlated phase. Additionally, the concordance correlation coefficient (CCC) was used to determine the relative reproducibility of each feature between phases. CCC as a measure of agreement describes the correlation between two measurements that fall on a 45o line passing through the origin and is defined as: 2
where
,
,
, and
are the mean and variance of two measurements and , respectively, and
is the correlation coefficient between and [114]. The CCC is an index scaled to the range [‐1, 1] where a value of one indicates perfect agreement between the two measures. For assessing test‐retest repeatability, a total of 286 images were collected which included 29 pairs of AVG, T0, and T50 and 28 pairs of EXP and INSP image sets. CCC was similarly calculated as a scaled
27 measure of agreement for each feature extracted from the total lung volume using the test and retest image sets to identify whether one image type was more repeatable than another. Since patients underwent an imaging session on one of two CT scanners, we considered the impact of machine on total lung feature values. We utilized the Mann‐Whitney U test to first determine if there was a difference in the distributions between the two machines for each feature individually. This was performed with the T50 image sets only and p‐values were adjusted using the Bonferroni correction. Secondly, we considered difference in repeatability of a given image type due to machine by calculating CCC for each feature using the patients imaged on the GE Discovery ST (n = 12 patients) or GE LightSpeed RT 16 (n = 17) separately.
Assessment of Feature Set Collinearity While repeatability and reproducibility are well characterized, many of the features are highly correlated to one another. Different strategies can be employed to reduce the feature set dimension to identify a robust subset of non‐redundant image features. We have utilized a heuristic approach based on Kuhn et al. [115] utilizing the pairwise Pearson correlation coefficients between total lung features from the T50 test‐retest scans. The initial feature set was limited to the subset considered highly repeatable (CCC 0.95) and a correlation matrix of the remaining features was constructed. To remove highly correlated predictors, two features with the highest pairwise correlation were initially selected. The average correlation for each of these features across the entire feature set was calculated and the variable with the greater average correlation was removed. This process repeated until the maximum pairwise correlation in the resulting feature set was less than 0.85. Additionally, we explored the similarity of features and patients with the reduced feature set by employing agglomerative hierarchical clustering with a complete linkage function. All analyses were performed using R version 3.2.3 [116].
28
RESULTS 4D‐CT Phase Reproducibility Figure 6 demonstrates the absolute change in lung density as a function of phase. The difference in density between near end‐inhale (T0) and end‐exhale (T50) varies as little as 7 HU to as much as 99 HU across the population. Figure 7 illustrates the percent change in different features relative to the T50 image set can vary substantially more or less in other features than the change in volume itself. The mean Spearman rank correlation exceeded 0.70 (| | > 0.70) in 4682 of 6526 features suggesting that the variation in feature value was at least moderately correlated to respiratory‐related changes in the total lung volume for the majority of features. Across all features, 3300/6526 have a range of variation 10%, 2364 have range > 10% and 25% and 862 have a range 25%. LUNG features exhibit noticeably more variation relative to the other feature classes as only 4/19 (21.1%) have range of variation