angle and distance to the objects contained in the map to ... ping with sonar sensors. ..... [16] H. Moravec and A. Elfes, âHigh resolution maps from wide angle.
Utilizing Reflection Properties of Surfaces to Improve Mobile Robot Localization Maren Bennewitz
Cyrill Stachniss
Abstract— A main difficulty that arises in the context of probabilistic localization is the design of an appropriate observation model, i.e., determining the likelihood of a sensor measurement given the pose of the robot and a map of the environment. Many successful approaches to localization rely on data provided by range sensors, e.g., laser range scanners. When using such data one normally has to deal with erroneous maximum-range readings that occur due to poor-reflecting surfaces. In general, these readings cannot be distinguished from readings obtained when no obstacle is within the measurement range of the sensor. Therefore, existing localization techniques treat these readings alike in the observation model. In this paper, we present a novel approach that explicitly considers the reflection properties of surfaces and thus the expectation of valid range measurements. In addition to the expected range measurement, we compute the probability of reflectance for a beam given the relative pose of the robot to the obstacle taking into account the angle of incidence of the beam. We estimate the reflection properties of surfaces using data collected with a mobile robot equipped with a laser range scanner. As we demonstrate in experiments carried out with a real robot, our technique leads to significantly improved localization results compared to a state-of-the-art observation model.
I. INTRODUCTION Robust localization is a prerequisite for mobile service robots operating in the real world. Several tasks, such as deliveries [1], giving tours [2] as well as assisting people [3], can only be carried out if the robot knows its pose. Since sensor data is noisy, probabilistic approaches that explicitly take the uncertainty into account are typically applied to estimate the pose of the robot. One of the key problems in probabilistic localization is the design of the observation model. For a given pose of the robot and the map of the environment, the observation model specifies the likelihood of a sensor measurement. Laser range sensors have been widely used for successful localization [4], [5], [6], [7], [8]. They provide distance and bearing information to objects in the environment. In practice, one has to deal with erroneous readings also called “maximum-range” readings that result from poor-reflecting surfaces or readings obtained in situations in which no obstacle is within the measurement range of the sensor. Especially, low-cost laser range sensors suffer from maximum-range readings caused by objects with low reflection properties. One popular approach that explicitly models failures corresponding to low or non reflectance is the ray-cast model M. Bennewitz, C. Stachniss, and W. Burgard are with the Institute for Computer Science, University of Freiburg, Germany and S. Behnke is with the Institute for Computer Science, University of Bonn, Germany This work has been supported by the DFG under the contract number BE 2556/2-2 and SFB/TR-8 as well as by the EC under FP7-231888-EUROPA.
Sven Behnke
Wolfram Burgard
proposed by Fox et al. [5]. This model, however, does not take into account that the likelihood of erroneous readings depends on the reflection properties of the corresponding surfaces. In this paper, we propose to estimate the reflection properties of surfaces and to use this information in the observation model. We collect data with a mobile robot equipped with a low-cost, miniature laser range scanner to estimate the distances and angles from which the objects are detected by the scanner. We compute histograms for the number of detections and non-detections for regions in the environment given the viewing angle and the viewing distance. We then use this information to calculate the probability of reflectance for a beam given the pose of the robot in the map. We apply the well-known Monte-Carlo localization (MCL) technique [9] to estimate the robot’s pose and use a variant of the ray-cast model [5] in which expected measurements are compared to measured distances. The novelty of our approach is that we additionally take into account the viewing angle and distance to the objects contained in the map to calculate the probability of reflectance for a beam. As we demonstrate in the experiments carried out with a real robot, we can significantly improve the localization compared to the standard ray-cast model. Our approach is especially valuable when large parts of a range scan are erroneous maximum-range readings due to low reflectance of objects or due to a comparably short sensor range. Such effects may occur rarely when using a highly accurate SICK laser range finder but can be observed frequently when using low-cost, light-weight scanners such as the Hokuyo URG04LX. This sensor is often used for humanoid robots [10] or flying vehicles [11] since these types of robots have only a very limited payload of a few hundred gram. This paper is organized as follows. After reviewing related work, we explain in Section III how to learn reflection properties of surfaces. In Section IV, we present our novel observation model for MCL. Finally, our experimental results illustrate that the accuracy of our localization approach and demonstrates the significantly improved performance compared to the standard ray-cast model. II. RELATED WORK Various observation models for probabilistic localization based on laser range data have been proposed [12], [13]. These approaches either approximate the characteristics of the sensor or aim to increase the robustness of the localization process by smooth likelihood models. Thrun et al. [9] as well as Lenser and Veloso [14] observed that the likelihood
function can have a serious influence on the performance of the localization technique. In the standard ray-cast model proposed by Fox et al. [5], it is assumed that beams are reflected by the first obstacle in the map along the ray with the robot’s pose as origin. Expected distances, which can be computed easily for a pose of the robot given the map, are then compared to the actually measured distances. In this approach, failures due to low or non reflectance are considered in the observation model and it has been successfully applied in practice. However, it is not taken into account that different surfaces can have distinct reflection properties. As we show in our experiments, this variance in reflection properties may substantially influence the localization performance especially when they lead to larger numbers of erroneous maximum-range readings. In correlation-based methods presented by Konolige and Chou [6] and by Schiele and Crowley [15] as well as in the endpoint model proposed by Thrun [7], the likelihood of a single range measurement depends on the distance of the corresponding beam endpoint to the closest obstacle represented in the map. Whereas these models haven been shown to be robust in highly cluttered environments, they suffer from two drawbacks. First, they do not take into account visibility constraints, second, they provide no direct mechanism to deal with maximum-range readings, which is why these readings are typically ignored. Gutmann et al. [4] and Arras et al. [8] presented featurebased localization approaches. Here, a set of features is extracted out the range scan and matched to features contained in the representation of the environment. One drawback of these methods are the assumptions the feature extractor makes about the structure of the environment. Moravec and Elfes [16] presented an approach to mapping with sonar sensors. When using sonar sensors, one encounters the inherent problem of specular reflection which means that sonar beams are reflected between different objects resulting in false range measurements. Moravec and Elfes simply do not consider range readings above a certain distance since they assume that specular reflection results in readings near the maximum range. Lim and Cho [17] proposed to use specular reflection probabilities to compute a measure of reliability for range readings. This quantity is computed given the measured distance and the angle of incidence. The difference to our approach is that we explicitly model that objects yield either valid measurements or erroneous maximum-range readings depending on the viewing angle and distance. Our goal is not to discount measurements with a low reliability or to ignore readings. Instead, we seek to utilize all measurements in an appropriate fashion during localization. III. ESTIMATING REFLECTION PROPERTIES A. Standard Reflection Probability Maps In our approach, the environment is represented using a grid map that consists of equally spaced cells. Reflection probability grids are typically computed using so-called hits and misses which are counted for each cell [13]. The number
d
? error
miss
a
? error
miss robot
error
? error
hit
robot
robot
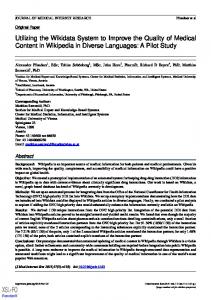
Fig. 1. (Left) The cell containing the beam endpoint gets assigned a hit, the cells the beam passes through get assigned a miss. (Middle) In the first stage of our mapping approach, we do not know which object along the ray of the beam caused the erroneous maximum-range reading. Thus, all cells along the ray get assigned the error. (Right) In the second stage, we assign the error reading to the first occupied cell along the ray (which has been observed from a different pose). We update the histogram given the distance d and the angle a.
of hits represents the number of cases a beam ended in the corresponding cell. The endpoint of a beam can easily be computed given the robot’s pose and the measured range. The number of misses corresponds to the number of cases a beam passed through the cell. The cells a beam passes through can be determined via ray-casting. Consider the example depicted in Fig. 1 (left) for an illustration. The reflection probability of a cell (x, y) is then computed as pref (x, y) =
hits x,y . hits x,y + misses x,y
(1)
A classical reflection probability map does not model the case that erroneous maximum-range readings can occur when the beam hits an object with a poor-reflecting surface and such beams are ignored during mapping. In our approach, we explicitly take into account the case that the beam is reflected by the object or that a too small fraction of the light has been reflected by the surface and thus an error reading is obtained. When using highly accurate laser range sensors such as the SICK laser scanner, these considerations can in general be neglected since the mentioned effects occur rarely. In contrast to that, range measurements obtained by low-cost and light-weight range scanners, such as the Hokuyo URG04LX, are highly sensitive to the surface material of the measured object. In our experience, the probability of a valid measurement depends on the viewing angle, i.e., the angle of incidence of the beam as well as on the distance to the object. In the following, we describe how to estimate such reflection properties of surfaces. B. Estimating Reflection Properties from Laser Data Learning reflection probabilities requires an accurate estimate about the robot’s trajectory. To acquire such an estimate, we use a robot that is equipped with two laser range finders: an accurate SICK LMS and a comparably noisy Hokuyo URG-04LX. To compute the trajectory of the robot given accurate laser range data, we apply an approach to grid-based SLAM (Simultaneous Localization and Mapping) with Rao-Blackwellized particle filters. A detailed description of this approach can be found in [18]. We then use the obtained pose estimates to learn a reflection probability map of the environment given data of the noisy laser range scanner.
We count the number of hits and misses for each cell. Additionally, the number of error readings potentially caused by each cell is determined (see Fig. 1, center image). We use histograms that store those values for a discrete set of viewing distances and angles of incidence. To compute the angle of incidence of a beam, we estimate the normal of the surface in a neighborhood in the scan around the beam under consideration by fitting a line through neighboring endpoints. Here, we assume that the normal can be uniquely determined for each grid cell (which typically have a size of 5 × 5 cm). When learning these histograms, two problems arise. First, it is not clear which cell along the beam caused the error reading given an invalid measurement. Second, the histograms are typically not completely filled since the cells are not observed from all distances and angles. In the following, we describe how to deal with these two problems. 1) Two-stage Mapping: To deal with the first problem, we apply a two-stage mapping approach. In the first stage, we process the sensor data to count the number of hits, misses, and errors for each cell. Here, misses are counted for all cells along the ray within a distance below the maximum measurement range of the sensor. To obtain a decision at which cell a ray-casting operation is aborted, we calculate for each cell: ( hits x,y 1 if hits x,y +misses > 0.5 x,y bin(x, y) = (2) 0 otherwise Afterwards, we initialize the histograms for all occupied cells that have error readings assigned and process the sensor data again. This time, we can assume that error readings are caused by the first occupied cell along the beam if one exists within the maximum measurement range of the sensor. Fig. 1 (middle) and (right) visualize the error assignment in the two stages of mapping. In case an error reading occurs, we update the histogram of the occupied cell (x, y), which is assumed to have caused the error reading. This is done given the distance d and the angle a computed based on the map. This means that err (d, a) is increased for (x, y). Accordingly, hits(d, a) is updated for (x, y) when a beam with length d and angle a ends in the cell (x, y) . Since we only need the histograms at occupied cells, our representation is only slightly more complex than that of standard reflection probability maps. 2) Dealing with Incomplete Data: We assume a monotonic increase of the probability of error readings with distance. In practice, one typically observes a cell from many different angles but only from very few distances. Therefore, if an error reading occurs at distance de , we also count an error for all greater distances di > de in the histogram given the angle of incidence a: ∀di > de : err (di , a) ← err (di , a) + err (de , a)
(3)
For reasons of readability, we omit the cell (x, y) in the formulas. The motivation behind this approach is the mode of operation of a laser scanner. The sensor emits light and measures the time needed until a certain amount of the reflected light is observed by the detector in the scanner. If
not enough light is reflected, we obtain an error reading. In this case, either no object was within the range of the sensor or too little light was reflected in direction of the sensor. The amount of the reflected light given a surface depends nontrivially on the angle of incidence and the distance between the sensor and the object. The closer the object to the sensor and the closer the angle of incidence to the normal angle of the measured object, the higher the amount of reflected light. Similarly to Eq. (3), for a hit at distance dh , we count this hit also for all shorter distances di < dh in the histogram given the angle of incidence: ∀di < dh : hits(di , a) ← hits(di , a) + hits(dh , a)
(4)
To estimate the maximum angle of incidence for which we expect to obtain valid range measurements, we proceed as follows. Given the histogram for a certain distance, we search for a separator line that best explains the corresponding hit and error readings. The optimal separator given the data can be determined by means of a score function we have to maximize. The score function is defined as a X [hits(d, i) − err (d, i)] + score(d, a) = i=0 B X
[err (d, i) − hits(d, i)] ,
(5)
i=a+1
where B refers to the number of bins in the angular histogram. According to this function, we compute for each distance d the angle a∗ that gets the highest score and thus best separates the hit observations from the error observations a∗
=
argmax score(d, a).
(6)
a
Fig. 2 illustrates the separator line (dashed line) for an example histogram and Fig. 3 depicts the corresponding score function. For probabilistic localization, we need to compute the probability that an occupied cell reflects a beam or leads to an error reading. From physics, we know that the closer the angle of incidence of a beam is to the normal angle of the observed object, the higher the amount of reflected light. It is therefore reasonable to assume that there exists one angular difference where there will be a valid measurement for smaller values and an error reading for bigger ones. As a result, we use a step function to model this probability. Given the separator a∗ , we can do this in a straight-forward manner. We then can compute the probability of reflectance given d averaged over the all angles a smaller than a∗ as Pa∗ ′ ∗ a′ =0 hits(d, a ) , pref (d, a < a ) = Pa∗ P ∗ a ′ ′ a′ =0 hits(d, a ) + a′ =0 err (d, a ) (7) and for d, a < a∗ accordingly. Since a∗ cannot always be determined perfectly due to missing data (see also Fig. 2), we do not use Eq. (7) directly but apply linear interpolation between pref (d, a < a∗ ) and pref (d, a > a∗ ) for all angles around a∗ where no data is available. See Fig. 4 for an illustration.
error count hit count
30 20 10 0 -10 -20 -30
B. Improved Observation Model
hit count error count
0
10
20
30
40
50
60
70
80
90
angle of incidence [deg]
score
Fig. 2. Illustration on how to compute the optimal separator a∗ (here illustrated by the dashed line). 120 100 80 60 40 20 0 -20 0
10
20
30
40
50
60
70
80
90
angle of incidence [deg]
Score function corresponding to the histogram show in Fig. 2. reflection probability
Fig. 3.
p(zt | xt , m)
1 0.8
(9)
0.4 0.2 0 10
20
30
40
50
60
70
80
90
angle of incidence [deg]
Fig. 4.
Resulting reflection probability function.
Note that if enough statistical data was collected with the robot, these approximations would not be necessary. In this case, one could compute the reflectance probability and analogously the probability of obtaining an error reading for each discrete angle a separately. In practice, however, it is typically impossible to observe each cell with each angle of incidence and from each distance. In the following section, we describe how to use the information about the reflectance properties of objects during probabilistic localization with a particle filter. IV. CONSIDERING REFLECTION PROPERTIES DURING LOCALIZATION A. Monte-Carlo localization We apply Monte-Carlo localization (MCL) [9] to estimate the pose xt of the robot at time t. MCL recursively estimates the posterior about the robot’s pose based on the following equation p(xt | z1:t , u0:t−1 ) = η · p(zt | xt ) · | {z }
xt−1
= α · pmax range (zt | xt , m) + β · pexp dist (zt | xt , m) + γ · p1 (zt | xt , m) + . . . ,
0.6
0
Z
We propose an improved observation model p(zt | xt ) that takes into account the estimated reflection properties explained in the previous section to realize a more robust and efficient localization for robots equipped with low-cost laser range finders such as the Hokuyo URG-04LX. Typical observation models for MCL, that use ray-casting operations in the map to compute the expected distance of a sensor measurement, are defined as a weighted sum of functions. In Section 6.3 of [13], Thrun et al. propose to apply a uniform distribution to model a random measurement, an exponential function to better cope with people in the vicinity of the robot, a Gaussian to model the measurement uncertainty of the sensor, and a constant for maximum range readings. In general, such ray-cast models can be described by
observation model
p(xt | xt−1 , ut−1 ) · p(xt−1 | z1:t−1 , u0:t−2 ) dxt−1 .(8) {z } | {z } | motion model
recursive term
Here, η is a normalization constant, u0:t−1 denotes the sequence of motion commands up to time t − 1, and z1:t is the sequence of observations. For reasons of readability, the map m is neglected in Eq. (8). MCL uses a set of particles to represent the above posterior. This set is updated using the sampling-importanceresampling particle filter.
where pmax range describes the function that determines the likelihood to obtain maximum-range readings, pexp dist handles the measurement noise in the sensor and is typically modeled by a Gaussian. Other properties can be described by the functions labeled p1 , . . .. The terms α, β, γ, . . . represent weights that can be set manually or learned by techniques such as expectation maximization. Our novel technique, that considers the angle of incidence of the beam as well as the distance of the robot for each cell individually to estimate the reflection probability, can be seen as orthogonal to such models and can easily be combined with them. We can directly integrate our knowledge about the reflection properties of cells into Eq. (9) without the need to change the individual functions: p(zt | xt , m)
= α · perr (d, a) · pmax range (zt | xt , m) + β · pr ef (d, a) · pexp dist (zt | xt , m) + γ · p1 (zt | xt , m) + . . . , (10)
where pr ef (d, a) denotes the probability of reflection of the first occupied cell along the beam given distance d and angle of incidence a, and perr (d, a) = 1 − pr ef (d, a) stands for the corresponding probability for an error reading. These probabilities are computed for a cell given the histogram as described in the previous section. As a result, the reflection properties of surfaces of the individual cells are directly incorporated into the existing observation model. Perfectly reflecting surfaces will lead to the original observation model. However, if the surface in the corresponding cell has different properties, our model explicitly takes these properties into account which results in more appropriate distributions as our experiments demonstrate. V. EXPERIMENTAL RESULTS To evaluate our approach, we carried out experiments with a wheeled robot equipped with a noisy and short-range (theo-
black door with window
black door
black door
black door with window
trash can
10
6 4 2 0
error (mean-true) [m]
Fig. 5. Enhanced reflection probability map. Different colors of cells indicate the maximum angle of incidence until which valid measurements are expected (the brighter the color red, the bigger the angle). The shown angles correspond to a measurement distance of 0.5 − 1 m.
14 12 10 8 6 4 2 0
A. Learning an Enhanced Reflection Probability Map In the dataset used to learn the enhanced reflection probability map of the environment, the robot traveled approximately 300 m. We manually steered the robot through the environment which has a size of approximately 20 × 20 m. Afterwards, we estimated the trajectory of the robot from the data of the SICK scanner using a SLAM approach with RaoBlackwellized particle filters [18]. We then used the resulting trajectory to learn a representative map of the environment for the data of the Hokuyo scanner. The enhanced reflection probability map learned by our approach is visualized in Fig. 5. The map has a resolution of 5 cm. The different colors of the cells indicate the maximum angle of incidence until which valid measurements are expected (the darker the color the smaller the angle). The shown angles correspond to the measurement distance of 0.5 m to 1 m. For this dataset, we used an angular discretization of 5◦ and a distance discretization of 50 cm. As can be seen, dark doors which frequently occur in the environment, have only a small range of angles for which valid measurements are expected. Similarly, the window front leads only to valid measurements when the angle of incidence is almost orthogonal to the surface. B. Improving Global Localization We recorded a second dataset which we used for the evaluation of our localization approach. A close to ground
50
100 time step
1 0.5
150
standard raycast our method
0
20 40 60 80 100 120 time step
standard raycast our method 1 0.5 0
14 12 10 8 6 4 2 0
50
100 time step
150
standard raycast our method
0
20 40 60 80 100 120 time step
standard raycast our method 1 0.5 0
0
retical maximum measurement range: 5.6 m) Hokuyo URG04LX laser range scanner. The scanner provides a 240◦ field of view. To estimate the trajectory of the robot and to obtain ground truth data, we used the data of the SICK LMS laser scanner (maximum measurement range: 80 m, 180◦ field of view) which was also mounted on the robot. In contrast to the Hokuyo, the SICK sensor provides highly accurate distance data.
standard raycast our method
0 0
0
image best viewed in color
p(converged)
standard raycast our method
8
p(converged)
railing
error (mean-true) [m]
black door
p(converged)
error (mean-true) [m]
window front
50
100 time step
150
0
20 40 60 80 100 120 time step
Fig. 6. Statistical evaluation of the global localization performance of our method vs. the standard ray-cast model for three different dataset (15 runs with different seeds). The left plots shows the error, computed as weighted mean error, vs. time and the right plots show the corresponding convergence probability vs. time given the 15 runs. As can be seen, our method significantly outperform the ray-cast model (the error bars illustrate the 95% confidence intervals).
truth estimate of the robot poses is obtained by using the SICK laser scanner (and by registering the second dataset in the map build from the first dataset). The following localization experiments were carried out using only the data of the Hokuyo scanner. We partitioned the dataset into three parts and evaluated the performance of our method in comparison to the standard ray-cast model. We performed 15 runs with different seeds for each dataset and evaluated the distance of the weighted mean of the particles to the true pose over time for each technique. One time step corresponds to the integration of an observation which is done after the robot traveled for at least 10 cm or rotated by at least 10◦ according to odometry. The results are shown in the left column of Fig. 6. Furthermore, we computed the convergence probability of the filter over time by counting when more that 95% of the probability mass is inside a 1.5 m radius. The results are depicted in the right column of Fig. 6 and the error bars indicate the 95% confidence intervals. As these results demonstrate, our method that explicitly considers reflection properties of surfaces significantly outperforms the standard ray-cast model since our filter converges significantly faster (the task in global localization is to determine the robot’s pose as fast as possible). We performed a further experiment in which the robot was moving in an environment in which the walls are highly reflecting. As expected, no significant difference between the standard ray-cast model and our approach can be determined in this case (see Fig. 7).
error (mean-true) [m]
10
standard raycast our method
8 6 4 2 0 0
50
100
150
200
time step
Fig. 7. Comparison of the pose error during global localization in an environment that contains only few surfaces with different reflection properties (multiple bright white posters have been added to the walls to ensure high reflectance). As expected, in this setting no significant difference between the ray-cast model and our new approach can be observed. our method
learned knowledge about reflection properties of objects. As we demonstrate in experiments carried out with a wheeled robot, we can significantly speed-up global localization in comparison to the standard ray-cast model. Our method converges faster to the true pose of the robot and substantially reduces the error in the estimated pose. Given these encouraging results, it can be presumed that utilizing reflection properties of surfaces can also improve solutions to the simultaneous localization and mapping problem using data of such low-cost sensors. One possibility, for example, is to incorporate the reflection properties in the scan-matching routine underlying existing SLAM methods such as [18] to obtain better proposal distributions which in turn leads to more efficient algorithms. R EFERENCES
standard raycast model
Fig. 8. Typical results obtained in a global localization experiment for our method (top row) and the standard ray-cast model (bottom row). The images depict the particle distribution at different time steps and the cross indicates the ground truth. The images correspond to one experiment of the statistical evaluation shown in the first row of Fig. 6. As can be seen, our method converges faster towards the true location of the robot. For illustration reasons, the maps depicted in the background of the images show the same reflection probability map of the environment.
The images in Fig. 8 visualize a typical evolution of the particles for one experiment. The first row depicts the resulting particle sets when applying our method, whereas the second row shows the particle distribution obtained with the standard ray-cast model. Again, it can be seen that our method converges faster towards the true pose of the robot. Since the standard ray-cast model does not consider different reflection properties of surfaces, particles at poses far away from the true location of the robot are more likely to survive. VI. CONCLUSIONS In this paper, we presented a novel technique to learn reflection properties of surfaces and to utilize this knowledge in probabilistic localization. Especially for low-cost and light-weight laser range scanners, which are frequently used with humanoids or small flying vehicles, the probability of the reflectance of a beam depends highly on the angle of incidence and on the distance of the scanner to the object. We therefore proposed to explicitly consider the reflection properties of surfaces during localization. Our approach extends the standard ray-cast observation model by incorporating the
[1] R. Simmons, R. Goodwin, K. Haigh, S. Koenig, and J. O’Sullivan, “A layered architecture for office delivery robots,” in Proc. of the First Int. Conf. on Autonomous Agents, 1997. [2] R. Siegwart, K. Arras, B. Jensen, R. Philippsen, and N. Tomatis, “Design, implementation and exploitation of a new fully autonomous tour guide robot,” in Proc. of the 1st Int. Workshop on Advances in Service Robotics (ASER), 2003. [3] M. Montemerlo, J. Pineau, N. Roy, S. Thrun, and V. Verma, “Experiences with a mobile robotic guide for the elderly,” in Proc. of the National Conf. on Artificial Intelligence (AAAI), 2002. [4] J.-S. Gutmann, W. Burgard, D. Fox, and K. Konolige, “An experimental comparison of localization methods,” in Proc. of the IEEE/RSJ Int. Conf. on Intelligent Robots and Systems (IROS), 1998. [5] D. Fox, W. Burgard, and S. Thrun, “Markov localization for mobile robots in dynamic environments,” Journal of Artificial Intelligence Research, vol. 11, 1999. [6] K. Konolige and K. Chou, “Markov localization using correlation,” in Proc. of the Int. Conf. on Artificial Intelligence (IJCAI), 1999. [7] S. Thrun, “A probabilistic online mapping algorithm for teams of mobile robots,” Int. Journal of Robotics Research, vol. 20, no. 5, pp. 335–363, 2001. [8] K. Arras, R. Philippsen, N. Tomatis, M. de Battista, M. Schilt, and R. Siegwart, “A navigation framework for multiple mobile robots and its application at the Expo.02 exhibition,” in Proc. of the IEEE Int. Conf. on Robotics & Automation (ICRA), 2003. [9] S. Thrun, D. Fox, W. Burgard, and F. Dellaert, “Robust Monte Carlo localization for mobile robots,” Artificial Intelligence, vol. 128, no. 1-2, 2001. [10] S. Thompson, S. Kagami, and K. Nishiwaki, “Localisation for autonomous humanoid navigation,” in Proc. of IEEE-RAS Intl. Conf. on Humanoid Robots (Humanoids), 2006. [11] R. He, S. Prentice, and N. Roy, “Planning in information space for a quadrotor helicopter in a gps-denied environment,” in Proc. of the IEEE Int. Conf. on Robotics & Automation (ICRA), 2008. [12] H. Choset, K. Lynch, S. Hutchinson, G. Kantor, W. Burgard, L. Kavraki, and S. Thrun, Principles of Robot Motion Planning. Cambridge, MA, USA: MIT Press, 2005. [13] S. Thrun, W. Burgard, and D. Fox, Probabilistic Robotics. Cambridge, MA, USA: MIT Press, 2005. [14] S. Lenser and M. Veloso, “Sensor resetting localization for poorly modelled mobile robots,” in Proc. of the IEEE Int. Conf. on Robotics & Automation (ICRA), 2000. [15] B. Schiele and J. L. Crowley, “A comparison of position estimation techniques using occupancy grids,” in Proc. of the IEEE Int. Conf. on Robotics & Automation (ICRA), 1994. [16] H. Moravec and A. Elfes, “High resolution maps from wide angle sonar,” in Proc. of the IEEE Int. Conf. on Robotics & Automation (ICRA), 1985. [17] J. Lim and D. Cho, “Physically based sensor modeling for a sonar map in a specularenvironment,” in Proc. of the IEEE Int. Conf. on Robotics & Automation (ICRA), 1992. [18] C. Stachniss, G. Grisetti, W. Burgard, and N. Roy, “Evaluation of Gaussian proposal distributions for mapping with Rao-Blackwellized particle filters,” in Proc. of the IEEE/RSJ Int. Conf. on Intelligent Robots and Systems (IROS), 2007.