Journal of Applied Pharmaceutical Science Vol. 6 (07), pp. 012-019, July, 2016 Available online at http://www.japsonline.com DOI: 10.7324/JAPS.2016.60702 ISSN 2231-3354
A Simple and Sensitive HPLC/UV Method for Determination of Meloxicam in Human Plasma for Bioavailability and Bioequivalence Studies Laila H. Emara1*, Maha F. Emam1, Nesrin F. Taha1, Hala M. Raslan2, Ahmed A. El-Ashmawy1 1
Industrial Pharmacy Laboratory, Medical and Pharmaceutical Chemistry Department, Division of Pharmaceutical Industries, National Research Centre, 33 EL Bohouth st. (former EL Tahrir st.), Dokki, Giza, Egypt. 2Department of Internal Medicine, Division of Medical Researches, National Research Centre, 33 EL Bohouth st. (former EL Tahrir st.), Dokki, Giza, Egypt.
ARTICLE INFO
ABSTRACT
Article history: Received on: 05/05/2016 Revised on: 24/05/2016 Accepted on: 23/06/2016 Available online: 28/07/2016
An HPLC/UV method to monitor meloxicam (MX) in human plasma was developed and properly validated. This method was based on a reversed-phase chromatographic analysis using C18-Symmetry column and a mobile phase consisting of acetonitrile: deionized water [50:50 (% v/v)] adjusted to pH 3 with glacial acetic acid. The detection wavelength was 360 nm using piroxicam as an I.S. The developed HPLC method was linear, sensitive, accurate, precise, selective and stable. This method exclusively provided a LLOQ of 5 ng/mL and ULOQ of 3000 ng/ml which could be considered as an excellent and economical method for carrying-out BA/BE studies. The determination of pharmacokinetics of single oral dose (15 mg/tablet) administered to healthy human male volunteer was carried-out to compare the bioavailability of three different MX products with a washout period of 8-days between treatments. Moreover, a comparative in vitro dissolution study of the three products using USP#4 (the Flow-through cell, FTC) has been carried-out prior to the in vivo test. The pharmacokinetic data revealed that the developed HPLC method was sensitive enough to monitor the multiplepeak phenomena characterized for MX absorption. Where, the first C max appeared at 4.5–5.5 hrs and the second at 10–12 hrs, for the tested products.
Key words: HPLC/UV, Meloxicam, Validation, Pharmacokinetic, Stability.
Abbreviations: MX: Meloxicam, I.S.: Internal Standard, Q: Amount Dissolved, IR: Immediate Release, LOQ: Lower limit of quantification, ULOQ: Upper limit of quantification, BA: Bioavailability, BE: Bioequivalence.
INTRODUCTION The design, performance, and evaluation of bioavailability (BA) and bioequivalence (BE) studies have received major attention from academia, the pharmaceutical industry and health authorities over the last couple of decades. These studies are performed to evaluate the safety and efficacy of a generic product (US-FDA Guidance for Industry, 2001). According to International/Reference Guidelines (ICH, WHO, US-FDA, EMA), BA/BE of the generic products are essential
* Corresponding Author Laila H. Emara, Industrial Pharmacy Laboratory, Medical and Pharmaceutical Chemistry Department, Division of Pharmaceutical Industries, National Research Centre, 33 EL Bohouth st. (former EL Tahrir st.), Dokki , Giza, Egypt. Email:
[email protected]
studies required to be submitted to the Health Authorities for reviewing by experts in the area whether these products are manufactured on a national level or imported from (or exported to) other countries. One of the major activities to perform a successful BE study is the development and validation of a simple, unexpensive, sensitive and reliable bioanalytical method to monitor the drug in human plasma samples according to US-FDA requirements (US-FDA Guidance for Industry, 2001). Meloxicam (MX) is an oxicam derivative of [4-hydroxy-2-methyl-N-(5methyl-2-thiazolyl)-2H-1,2-benzothiazine-3-carboxamide-1,1dioxide]. MX is a non - steroidal drug used as anti-inflammatory, analgesic, and antipyretic therapeutic drug (Boehringer, 2014; Busch et al., 1998; Fahmy, 2006; Hanft et al., 2001; Kurti et al., 2011; Reynolds, 2005;). MX is almost completely absorbed when given parenterally, orally or rectally with an absolute bioavailability of 89%.
© 2016 Laila H. Emara et al. This is an open access article distributed under the terms of the Creative Commons Attribution License -NonCommercialShareAlikeUnported License (http://creativecommons.org/licenses/by-nc-sa/3.0/).
Emara et al. / Journal of Applied Pharmaceutical Science 6 (07); 2016: 012-019
Maximum MX plasma concentrations (Cmax) were achieved after 5-6 hrs (Tmax) when administered after breakfast (Davies and Skojdt, 1999; Turck et al., 1995; Turck et al., 1997). Very similar values were found after rectal administration (Davies and Skojdt, 1999). Absorption after intramuscular injection is faster than oral administration, with (Tmax) occurring after 1-1.5 hrs (Narjes et al., 1996). The pharmacokinetics of MX are linear over the entire dose range of 7.5 to 30 mg and remain unchanged from single to multiple dosing conditions, total MX clearance found to be 7-8 ml/min with an elimination half-life around 20 hrs (Turck et al., 1997). Although several pharmacokinetic studies of MX have been published, however, few reports have focused on bioanalytical method validation in human plasma, pharmacokinetics and BA/BE studies (Dasandi et al., 2002; Gschwend et al., 2007; Marcelin-Jimenez et al., 2005; Rigato et al., 2006; Turck et al., 1997). Several HPLC methods coupled with UV detection (Ahmad et al., 2011; Bae et al., 2007; Dasandi et al., 2002; Elbary et al., 2001; Ghorab et al., 2004) or tandem mass spectroscopy (LC/MS/MS) (Rigato et al., 2006) were reported for the determination of MX in human plasma. These methods adopted different clean-up procedures including direct injection, protein precipitation (Dasandi et al., 2002; Elbary et al., 2001), liquid-liquid extraction (LLE) followed by evaporation and reconstitution (Bae et al., 2007). However, most of those methods gave insufficient sensitivity with lower limit of quantification (LLOQ) 10 – 100 ng/ml, also these methods used relatively large plasma volumes (0.5–1 ml). A more sensitive and fully validated bioanalytical method was required for accurate estimation of the primary pharmacokinetic parameters of oral single dose of 15 mg MX. Also, the method should be sensitive enough to detect a LLOQ less than 10 ng/ml, which will allow more accurate estimation of the AUC0-∞. In the present study, our objective was to develop and validate an HPLC/UV method which could be easily applied for the determination of MX in human plasma samples for BA/BE studies. The potential of the developed HPLC method will be tested as a single dose (15 mg MX/ tablet) orally administered to healthy human male volunteer to compare the bioavailability of three different MX market products. In addition, to test the validity of the previous in vitro dissolution study (Emara et al., 2014) of MX market products using different operational conditions of flow through dissolution cell (FTC, USP Apparatus # 4). In that study (Emara et al., 2014), we have reached a conclusion that the generic products of MX might not be interchangeable with the innovator product (Mobic®, Boehringer Ingelheim, Germany).
013
except for acetonitrile, ethyl acetate and methanol were HPLC grade. Deionized water by Milli Q plus, Millipore, USA was used. Study Formulations The products used in this study were; the innovator product Mobic® manufactured by (Boehringer Ingelheim; Germany) purchased from European market (R1) (Lot number 544144) and (R2) for Mobic® purchased from Egyptian market; (Batch number 302064). The generic product was Mobitil (G), manufactured by (Medical Union Pharmaceuticals; Egypt) (Batch number 142536). Each product contained 15 mg MX/tablet. Chromatographic Conditions and Instruments The HPLC system consisted of a Waters 600 E multi solvent delivery system controller equipped with Rheodyne injector P/N 7725i. The analytical column was a Symmetry C18 (particle size 5 µm, 3.9 cm X 150 mm i.d.), protected by a guard pack pre-column module with Symmetry C18, 5 µm inserts. The detection wavelength, 360 nm, was determined by scanning the maximum absorbance wavelength of MX and piroxicam (set as internal standard, I.S.) in the mobile phase using an UV spectrophotometer (Waters 2487 dual λ absorbance detector) coupled to Millennium 32 computer program. A peak area ratio of the drug to the I.S. was used for quantitation. The mobile phase consisted of a mixture of acetonitrile and deionized water (adjusted to pH 3 using glacial acetic acid) in the ratio of (50:50, v/v), eluted at a flow rate of 1 ml/min. Standard Solutions Standard Stock solutions of MX (100 µg/ml) and Piroxicam (100 µg/ml) were prepared in methanol. The working standards were obtained by diluting the standard stock solutions with the mobile phase. MX final calibration standards from 0.005 – 3 µg/ml were prepared independently. Piroxicam stock solution in methanol was diluted to obtain final concentration of 0.5 µg/ml. Prepared samples were stored at -20 °C until analysis.
MATERIALS AND METHODS
Sample Treatment Two hundred and fifty microliters of plasma, 25 µl of MX calibration standards, 25 µl of an I.S. solution (Piroxicam, 0.5µg/ml) and 75 µl of 1M HCl were added to a glass tube. After vortex mixing for 30 sec, 1.25 ml of ethyl acetate was added and the mixture was vortex mixed for 2 min for protein precipitation. Each sample was centrifuged (9000 rpm for 5 min), and the organic layer was transferred to a new glass tube and evaporated to dryness under vacuum (miVac DUO concentrator, DUC-23050B00, Genevac, USA) at 60 °C. The residue was reconstituted with 100 µl of the mobile phase, vortexed for 2 min, and 25 µl aliquot was injected onto the HPLC column.
Reagents and Chemicals MX was kindly donated from Delta Pharma (Cairo, Egypt) and Piroxicam was purchased from Sigma (St. Louis, MO, USA). All other reagents and solutions were of analytical grade
HPLC Method Validation The proposed method was validated in compliance with US-FDA guidelines for bioanalytical method validation (US-FDA Guidance for Industry, 2001). The method was validated for
014
Emara et al. / Journal of Applied Pharmaceutical Science 6 (07); 2016: 012-019
specificity, linearity, lower limit of quantitation (LLOQ), recovery, accuracy, precision (intra-day and inter-day) and stability (stock solution, freeze-thaw, benchtop and long-term plasma stability). Specificity Specificity is the ability to assess unequivocally the analyte in the presence of components which may be expected to be present. Typically these might include impurities, degradants, matrix, etc. (Sinha et al., 2009). Blank plasma was treated as described above for sample treatment. The chromatograms were inspected for the presence of substance(s) which might interfere with the peaks of (MX and I.S.). Linearity of Calibration Curve The linearity of the method was evaluated at MX concentrations ranging from 0.005 – 3 µg/ml. Two standard calibration curves were constructed for the lower (0.005 – 0.50 µg/ml) and higher (0.25 – 3.0 µg/ml) MX concentration ranges using linear least-squares regression analysis by plotting peak area ratios of (MX/I.S.) as a function of MX plasma concentration. Absolute Recovery, Accuracy and Precision Intra- and inter-day precision and accuracy were evaluated by replicate analysis of six sets of samples spiked with different concentrations of MX (0.02, 0.1, 0.25, 1.5 and 2.5 µg/ml) within 1 day or on 3 consecutive days, respectively. For evaluation of accuracy, the relative standard error percentage (R.S.E. %) was determined as [(mean of detected concentration added concentration) / added concentration] X 100, while the precision was evaluated as the coefficient of variation (C.V.). The absolute recovery was calculated from standard calibration curves; namely the peak area ratios of MX / I.S. in plasma were compared with those in standard solutions. Lower Limit of Quantification (LLOQ) The lower quantification limit of an individual analytical procedure is the lowest amount of analyte in a sample, which can be quantitatively determined with suitable precision and accuracy (Sinha et al., 2009). The LLOQ was analyzed six times for conformation. Stability Studies The stability of MX in different samples was tested using low, medium and high quality control samples (LQC, MQC and HQC, respectively) for stock solution, benchtop, three freezethaws cycles and long –term plasma stabilities. For stock solution stability, the samples prepared from a fresh stock solution were compared to those samples prepared from a stock solution kept at (-20 °C) for 2 months. For benchtop stability testing, the processed samples were kept on bench at room temperature for 6-8 hrs and then reanalyzed. The freeze–thaw stability of MX was determined over three freeze–thaw cycles within 3 days. In each freeze–thaw cycle,
the spiked plasma samples were frozen at −20 °C for 12-24 hrs and thawed at room temperature. Measurements were done after the third freeze - thaw cycle. The long-term plasma stability was evaluated after keeping the plasma samples frozen at −20 °C for 6 weeks. The samples were analyzed and the results were compared with those obtained from the freshly prepared samples. Comparative In Vitro Dissolution Study Comparative in vitro dissolution studies of the 3 market products were carried-out as described previously (Emara et al., 2014) using the closed loop setup of the flow through cell (FTC) dissolution apparatus (USP # 4, a Dissotest CE-6 equipped with a CY 7-50 piston pump, Sotax, Switzerland) in phosphate buffer pH 7.5. The FTC design chosen for carrying out the dissolution testing was fully described and illustrated previously (Emara et al., 2014). The dissolution studies were carried-out in triplicate. Dissolution Data Analysis The dissolution profiles of the three market products were compared with each other using fit factors (f1 and f2) (Moore and Flanner, 1996), and are defined as follows [Equation (1and 2)]:
Equation (1) and
Equation (2) Where, Rt is the percentage of drug released for a reference batch at time point t, Tt is the percentage of drug released for the test batch, n is the number of time points and W t an optional weight factor. The factor, ƒ1, is the average % difference over all time points in the amount of test batch dissolved as compared to the reference batch. The ƒ1 value is 0 when the test and the reference profiles are identical and increases proportionally with the dissimilarity between the two profiles. Difference factor of 0-15 ensures minor difference between two products (Costa and Lobo, 2001). The ƒ2 value is a measure of the similarity between two dissolution curves and its value is between 0 and 100. The value is 100 when the test and the reference profiles are identical and approaches zero as the dissimilarity increases. FDA suggests that two dissolution profiles are considered similar if the similarity factor ƒ2 is between 50 and 100 (US-FDA Guidance for industry, 1997). Clinical Application The developed HPLC method was applied to compare the pharmacokinetics of MX plasma concentrations from the three
Emara et al. / Journal of Applied Pharmaceutical Science 6 (07); 2016: 012-019
market products (R1), (R2) and (G) following the oral administration of single dose of 15 mg of MX to a healthy human Egyptian male volunteer under fed condition. The study was done as a three treatment with 8 days wash-out period between each phase. The study was approved by the Medical Research Ethical Committee of the National Research Centre – Cairo – Egypt [Registration No. 14062] and the protocol complies with the declarations of Helsinki and Tokyo for humans. The biochemical examination of the selected volunteer revealed normal kidney and liver functions. The selected volunteer was on non-drug treatment regimen one week before the participation in the study. The nature and the purpose of the study were fully explained to him with an informed written consent. The volunteer was instructed to fast for at least 10 hrs prior to clinical experiment. On study days, he was provided with a standardized breakfast meal followed by administration of MX with 250 mL water .The volunteer was allowed to drink water at libitium, until 6 hrs after dosing where he received standardized lunch meal. Venous blood samples of 2.5 mL were collected, through an indwelling cannula placed on the forearm, into vacutainer tubes containing EDTA at preset time intervals of 0 (pre-dose), 0.5, 1, 2, 3, 3.5, 4, 4.5, 5, 5.5, 6, 7, 8, 10, 12, 24, 48, 72 and 96 hrs postdose. Blood samples were centrifuged at 9000 rpm for 15 min, the plasma was separated promptly and frozen at -20 °C until subsequent analysis. The unknown samples were calculated via daily calibration curves as well as the quality control (QC) samples (Low, Medium and High) during each run (US-FDA Guidance for Industry, 2001). Pharmacokinetic Analysis Pharmacokinetic parameters for MX, following oral administration of the three treatments, were determined from the plasma concentration time data by means of a noncompartmental analysis using the WinNonLin – Professional 2.1 (WNL-Pro 2.1) computer program (Pharsight, USA). The AUC0–96 (μg.hr/mL) is determined as the area under the plasma concentration-time curve up to the last measured sampling time and calculated by the trapezoidal rule and AUC 0–∞ is the sum of AUC0–96, plus the residual area calculated as the concentration at the last measured time point divided by Kel (hr-1). Kel is the elimination first order rate constant associated with the terminal (log-linear) portion of the curve. The maximum drug concentration (Cmax, μg/mL) and the time to reach Cmax (Tmax, hr) were obtained from the individual plasma concentration-time curves. Mean residence time (MRT) (hr) was calculated as AUMC/AUC, where AUMC is the area under the first moment of the drug concentration in blood or plasma curve (Gibaldi and Perrier, 1982). RESULTS AND DISCUSSION Optimization of Chromatographic Conditions MX has two pKa values and its profile is most likely to be affected by the pH of the environment and thus the extent of
015
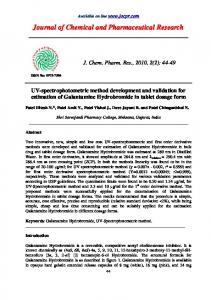
ionization of MX molecules. Therefore, it was concluded that low pH would be more suitable for construction of MX standard solutions (Shaji and Varkey, 2012). The composition of mobile phase was selected through several trials to achieve good resolution and symmetric peak shapes of MX and I.S. as well as short run times using a Symmetry C18 column. The mobile phase consisting of acetonitrile: water (adjusted to pH 3 with glacial acetic acid) in the ratio of 50: 50 (% v/v) achieved our purpose. The method was selective and required a relatively short run time (6 min) to separate MX and I.S. Figure 1 (A,B & C) showed representative chromatograms of blank human plasma, human plasma spiked with standard 1.5 g/ml MX and 0.5 g/ml I.S. and plasma sample obtained from the healthy human volunteer at 3.5 hrs after oral administration of 15 mg MX from Mobic®. Good resolution of the drug and I.S. were obtained where the retention times of I.S. and MX were 3.3 and 5.6 min, respectively as shown in Figure (1). No endogenous interfering peaks from plasma samples were observed.
(A)
(B)
(C)
Fig. 1: Representetaive HPLC Chromatograms of MX in Blank Human Plasma (A); Human Plasma Spiked with 1.5 µg/ml MX and 0.5 µg/ml Piroxicam (I.S.) (B); and Human Plasma Sample Collected 3.5 hrs after Single Oral Administration of 15 mg MX (Mobic®, Boehringer Ingelheim, Germany, R1)(C).
Linearity and Reproducibility Peak area ratios of MX/ I.S. versus MX concentrations were plotted to construct two standard calibration curves for MX
016
Emara et al. / Journal of Applied Pharmaceutical Science 6 (07); 2016: 012-019
concentrations covering the whole range of 0.005 to 3 g / ml. Good linear relationships were established in both low (0.005 - 0.5 µg/ml) and high (0.25 - 3.0 µg/ml) concentrations as shown in Figure (2). The polynomial regression for the calibration plots showed regression coefficient r2 = 0.9996 and 0.9999 for the low and high concentration ranges, respectively. Also, Figure (2) showed the regression equations of y = 23.782x + 0.0071 and y = 2.4349x + 0.0109 for both concentration ranges, respectively.
determined by calculating the CV % of the peak area ratios. The intra-day accuracy and precision varied from 92.97 to 100.57 % and from 0.0154 to 0.0348 %, respectively. The inter-day accuracy and precision were similarly evaluated for three replicates of different MX plasma concentrations on three different days and results ranged from 92.60 to 98.70 % and from 0.0142 to 0.0608 %, respectively. This suggests that the present method gave a satisfactory accuracy, precision and reproducibility. Lower Limit of Quantification (LLOQ) The lower limit of quantification (LLOQ) was found to be 0.005 g/ml with a CV % of 3.87%. This LLOQ value was two times lower than that reported by Bae et al., 2007, using HPLC/UV and by Medvedovici et al., 2004, using HPLC-diode array detector, 10 times lower than that reported by Dasandi et al., 2002 using HPLC/UV, and 20 times lower than that reported by Velpandian et al., 2000 using HPLC/UV. Moreover, this LLOQ value was almost half the LLOQ value obtained by Wiesner et al., 2003 using LC–MS–MS method (LLOQ was 8.96 ng/ml). This indicated that the developed HPLC/UV method can be used for detection and quantification of MX over a wide range of concentrations. This method exclusively provided quantification limit of 5 ng/mL, which was lower than those provided by LC-MS (Wiesner et al., 2003). Moreover, the current method needs small volume of plasma samples (0.25 ml), more sensitive and economical as well. Stability
Fig. 2: Calibration Curves of MX in Human Plasma. : (A) Lower Concentration Range (0.005 - 0.5 µg/ml); (B) Higher Concentration Range 0.25 - 3 µg/ml.
Accuracy and Precision Table (1) gave a summary of the accuracy and precision of MX concentrations levels of: 0.02, 0.1, 0.25, 1.5 and 2.5 g/ml. Table 1: Accuracy and Precision of MX. Spiked Concentration (µg/ml)
within-day (intra -day) 0.02 0.1 0.25 1.5 2.5 day to day (inter - day) 0.02 0.1 0.25 1.5 2.5
Calculated Concentration (µg/ml)
CV%
Recovery%
0.0188 ± 0.0003 0.1006 ± 0.0035 0.2324 ± 0.0079 1.4271 ± 0.0321 2.4488 ± 0.0484
0.0154 0.0348 0.0338 0.0225 0.0197
93.83 100.57 92.97 95.14 97.95
0.0186 ± 0.0008 0.0987 ± 0.0060 0.2315 ± 0.0083 1.4435 ± 0.0321 2.4723 ± 0.0350
0.0420 0.0608 0.0358 0.0223 0.0142
93.00 98.70 92.60 96.24 98.89
The intra-day accuracy was assessed by calculating the mean percentage recoveries while intra-day precision was
Stability of the drug in different media was carried out by performing stock solution, benchtop, freeze –thaw of plasma samples and long term stability of dug in plasma. The studies were performed in triplicate for low, medium and high concentrations. Recovery percentage for each set of data was calculated and presented in Table (2). The stock solution samples stored in a freezer at −20 °C remained stable in methanol for at least 2 months as shown in Table (2). The percentage recoveries of spiked MX in plasma of concentrations 0.02, 0.04, 0.25,1 and 1.5 µg/ml were 90.70 %, 103.88 %, 88.06%, 93.55% and 90.31 %, respectively. Meanwhile, in another study done by Mahmood et al., 2008, results showed that the stock solution of MX in acetonitrile at concentration of 1 mg/mL was stable for 6 weeks storage at 4 °C and 25 °C with percentage recoveries of 99 % and 99.13 %, respectively. Concerning the benchtop stability for (6-8 hrs at 25 °C); thawing the frozen samples and keeping them at room temperature for 6 hrs had no effect on quantification. Percentage recoveries of MX and I.S. were within the range of 97.22 - 99.93% as shown in Table (2). Similarly, in a study done by Dasandi et al., 2002 to evaluate the benchtop stability of MX at 20 ºC, the samples were stable even after 8 hrs. Another study done to evaluate the stability of MX in plasma samples at 24 and 48 hrs after sample treatment (Porta et al., 2005), it has been reported that the test samples were stable up to 48 hrs.
Emara et al. / Journal of Applied Pharmaceutical Science 6 (07); 2016: 012-019
017
Table 2: Stability Studies of MX. a
Quality Control Sample
Low Concentration 0.02 µg/ml 0.04 µg/ml 90.70% 103.88% 1- Stock Solution Stability (2 Months) (± 3.91) ( ± 3.96) 99.93% --------2- Benchtop Stability (± 0.31) 87.92% -----3- Freeze and Thaw Stability (± 3.17) 96.69% ------4- Six Weeks Long-Term plasma Stability (± 1.98) 90.14 I.S. Benchtop Stability (± 2.36) a Stability is expressed by recovery % from initial concentration.
Three freeze–thaw cycles of the quality control samples did not appear to affect the quantification of MX as depicted by the percentage recoveries ranging from 85.15 to 97.56 % of initial concentrations [Table (2)]. Results revealed no apparent changes in the concentrations of MX in plasma concerning the long term storage at -20 oC for 6 weeks [Table (2)]. The percentage recoveries were within the range of 85.29 - 96.69 % of the initial concentrations, which were within the US-FDA accepted range (US-FDA Guidance for industry, 2001). Another study (Porta et al., 2005), stated that MX could be frozen in serum at a temperature of -20 ºC for 60 days without degradation. This suggests that human plasma samples containing MX can be handled under normal laboratory conditions without any significant loss of compound. These full validation tests had concluded that the developed HPLC method was linear, sensitive, accurate, economical, and stable under the specified conditions adopted in this study. This method had the lowest LLOQ value than the other published HPLC methods and hence, the use of this method, could save time and money and it can be applied even with very high accuracy and precision. Comparative In Vitro Dissolution Studies A Comparative in vitro dissolution study of market products of MX were carried-out previously (Emara et al., 2014), using different operational conditions of the FTC, in phosphate buffer (pH=7.5). That study opened an important question about the optimization of the FTC to obtain reliable and discriminative results reflecting the major as well as the minor formulation variables prior to the BE testing. The in vitro testing focused on applying seven different FTC operational conditions to investigate their impact on the similarity / dissimilarity between G (Mobitil, Medical Union Pharmaceuticals; Egypt) and R2 (Mobic® - Boehringer Ingelheim, Germany, purchased from Egyptian market) (Emara et al., 2014). The dissolution data calculated upon applying the different conditions of FTC, revealed that only one single in vitro dissolution test out of seven, gave similar dissolution profiles for R2 and G (Emara et al., 2014). Moreover, the dissolution rate of product R2 was much less affected by changing the FTC
Recovery % of MX Medium Concentration 0.1 µg/ml 0.25 µg/ml ------88.06% ( ± 4.43) --------99.25% ( ± 3.27) 92.86% 91.92% (± 3.36) (± 1.14) --------85.29% (± 3.58) 102.04% (± 0.87)
High Concentration 1µg/ml 1.5 µg/ml 93.55% 90.31% (± 1.29) (± 5.75) -------97.22% (± 3.031) 85.15% 97.56% (± 0.96) (± 1.33) -------96.51 (± 1.96) 91.33 (± 3.98)
operational conditions than product G. Therefore, in the present study, the bioavailability of R2 versus G was proposed. The dissolution profiles of MX from reference products (R1 & R2, Mobic®, Boehringer Ingelheim, Germany purchased from European and Egyptian markets, respectively) and generic product (G) were shown in Figure (3). Considering a single point specification (Q≥75% in 30 min); all these products met the pharmacopoeial dissolution criterion in the USP and the requirement for an IR dosage form (USP 30, 2007). The tested products showed comparable dissolution performances with percentage dissolved in 30 min ranging from 78.69 to 85.90%, using the FTC apparatus.
Fig. 3: In vitro Dissolution Profiles of MX from the Three Market Products using the Closed Loop-Setup of the FTC (USP # 4) in Phosphate Buffer pH 7.5. The Straight Line shows Q= 75%. Mean ± S.D. (n=3) R1 (Mobic® 15mg, Boehringer Ingelheim, Germany) Purchased from European Market; R2 (Mobic® 15mg, Boehringer Ingelheim, Germany) Purchased from Egyptian Market; G (Mobitil 15mg, Medical Union Pharmaceuticals, Egypt).
According to the fit factors results, the dissolution profiles of R2 and G were similar to the innovator R1, where (f1) values were 4 and 5 and (f2) values were 72 and 62 for R2 and G, respectively. Clinical Application: The pharmacokinetics of MX after administering a single oral dose of 15 mg of R1, R2 and G products to a human male Egyptian volunteer in three periods with 8 days wash out period between treatments were presented in Table (3) and Figure (4). It
018
Emara et al. / Journal of Applied Pharmaceutical Science 6 (07); 2016: 012-019
was found that the developed HPLC method was exclusively selective for MX peak (peak of interest) with no endogenous interfering peaks or metabolites observed in the chromatogram during the whole monitored time intervals (0 hr – 96 hr). In addition, the percentage recovery of quality control samples (LQC, MQC and HQC) were within the accepted US-FDA limits.
Fig. :4 Plasma Concentration – Time Profiles of MX in a Single Human Volunteer after Oral Administration of 15 mg MX of: R1 (Mobic® 15mg, Boehringer Ingelheim, Germany) was Purchased from European Market; R2 (Mobic® 15mg, Boehringer Ingelheim, Germany) was Purchased from Egyptian Market; G (Mobitil, 15mg, Medical Union Pharmaceuticals, Egypt). Table 3: Pharmacokinetic Parameters of MX in Healthy Human Volunteer after Oral Administration of 15 mg MX from the Three Market Products. Pharmacokinetic Market Products (15 mg MX / Tablet) Parameters R1 R2 G Cmax (µg/ml) 1.87 1.86 1.80 Tmax (hr) 4.5 4.5 5.5 AUC0-96 (µg.hr/ml) 39.23 44.07 42.89 AUC0-∞ (µg.hr/ml) 39.32 44.38 43.79 MRT (hr) 18.44 19.70 21.37 R1: (Mobic® 15mg, Boehringer Ingelheim, Germany) Purchased from European Market; R2: (Mobic® 15mg, Boehringer Ingelheim, Germany) Purchased from Egyptian Market; G: (Mobitil 15mg, Medical Union Pharmaceuticals, Egypt).
The data showed that absorption of MX from the three market products gave Cmax of 1.87, 1.86 and 1.80 µg/ml for R1, R2 and G, respectively. Also, Tmax values of R1 and R2 were almost the same (4.5 hrs), while G showed slightly higher Tmax value (5.5 hrs). The AUC0-96 values were 39.23, 44.07 and 42.89 µg. hr / ml for R1, R2 and G, respectively, while AUC0-∞ values attained values of 39.32, 44.38 and 43.79 µg. hr / ml for R1, R2 and G, respectively. The pharmacokinetic data revealed that the developed HPLC method was sensitive enough to monitor the multiple peak phenomena characterized for MX absorption. The first C max appeared at 4.5 – 5.5 hrs and a second one at 10 –12 hrs, for the three tested products. The multiple peaks of MX might be due to a continued absorption of several portions of slowly dissolving drugs and precipitation of the drug followed by re-dissolution, especially because MX is poorly soluble in acidic media. Hence, MX might be precipitated in the stomach and re-dissolved after meal and/or the reported possibility of gastrointestinal recirculation, enterohepatic circulation (Busch et al., 1995; Lehr et
al., 2009; Turck et al., 1996; Turck et al., 1997) or enteroentric circulation (Veneeta, 1999). The pharmacokinetic parameters of Cmax, Tmax, AUC 0-96 , AUC0-∞ and MRT for R1, R2 and G in the present study were in agreement with previous studies conducted in healthy human volunteers (Bae et al., 2007; Bae et al., 2011; Marcelín‐Jiménez et al., 2005; Weisner et al., 2003), however, these studies did not detect the multiple peak phenomena characterized for MX absorption. On the other hand, a previous bioequivalence study done by Elbary et al., 2001, to assess the bioavailability of two commercial products of MX on 12 healthy human volunteers showed that Cmax and Tmax values, following administration of 15 mg oral MX were 2-fold lower than our current results. It is worthy to mention that after oral administration of a single dose of 30 mg MX, which is double the dose administered in the present study, Türck et al., 1996 reported Cmax values of 1.500 - 1.900 µg/ml. However, none of the previous works described the type of population under investigation (Marcelín‐Jiménez et al., 2005); nevertheless, it had been reported that there exist no differences in bioavailability of MX due to either cirrhosis (Busch et al., 1995), renal impairment (Boulton‐Jones et al., 1997), or gender (Sander et al., 1995). CONCLUSION The developed HPLC/UV method to monitor MX in human plasma samples could be considered as an excellent and economical method for BA/BE studies. The LLOQ was 5 ng/ml, which is less than the other published methods including the more expensive LC/MS/MS methods with a smaller volume of plasma samples as well. Moreover, the developed method was able to monitor the multiple peak phenomena characterized for MX absorption. The in vitro dissolution testing using a special design and condition of the FTC apparatus (USP # 4) could be used as an alternative method to the conventional USP 1 & 2 testing apparatuses. REFERENCES Ahmad M, Murtaza G, Akhtar N, Siddique F and Khan SA. Bioequivalence Study Of Two Brands Of Meloxicam Tablets In Healthy Human Pakistani Male Subjects. Acta pol pharm, 2011; 68, 115-119. Bae J.-W, Kim M.-J, Jang C.-G and Lee S.-Y. Determination Of Meloxicam In Human Plasma Using A HPLC Method With UV Detection And Its Application To A Pharmacokinetic Study. J Chromatograph B, 2007; 859(1), 69-73. Bae JW, Choi CI, Jang CG and Lee SY. Effects Of Cyp2c9* 1/* 13 On The Pharmacokinetics And Pharmacodynamics Of Meloxicam. Br J Clin Pharmacol, 2011; 71(4), 550-555. Boehringer I. Mobic Pamphlet Council Of Arab Health Ministers, 2014. Boulton‐Jones J, Geddes CG, Heinzel G, Türck D, Nehmiz G and Bevis PJ. Meloxicam Pharmacokinetics In Renal Impairment. Br J Clin Pharmacol, 1997; 43(1), 35-40. Busch U, Heinzel G, Narjes H, Nehmiz G, Krimmer J and Rosch W. Pharmacokinetics Of Meloxicam In Patients With Liver Insufficiency Associated With Liver Cirrhosis. Rheumatol Eur, 1995; 24(S3), 177.
Emara et al. / Journal of Applied Pharmaceutical Science 6 (07); 2016: 012-019 Busch U, Schmid J, Heinzel G, Schmaus H, Baierl J, Huber C and Roth W. Pharmacokinetics Of Meloxicam In Animals And The Relevance To Humans. Drug Metabol Disposit, 1998; 26(6), 576-584. Costa P and Lobo JMS. Modeling and comparison of dissolution profiles. Eur J Pharma Sci, 2001; 13, 123-133. Dasandi B, Saroj H and Bhat K. LC Determination And Pharmacokinetics Of Meloxicam. J Pharmaceut Biomed Anal, 2002; 28(5), 999-1004. Davies NM and Skojdt NM. Clinical Pharmacokinetics Of Meloxicam. Clin Pharmacok, 1999; 36(2), 115-126. Elbary AA, Foda N and Elkhateeb M. Reversed Phase Liquid Chromatographic Determination Of Meloxicam In Human Plasma And Its Pharmacokinetic Application. Anal Lett, 2001; 34(7), 1175-1187. Emara LH, Emam MF, Taha NF, El-ashmawy AAER and Mursi NM. In-Vitro Dissolution Study Of Meloxicam Immediate Release Products Using Flow Through Cell (Usp Apparatus 4) Under Different Operational Conditions. Int J Pharm Pharmaceutic Sci, 2014; 6(11), 254260. Fahmy M. Ca-Alginate Beads Loaded With Meloxicam: Effect Of Alginate Chemical Composition On The Properties Of The Beads And Ulcerogenicity Of The Drug. J Drug Delivery Science and Technology, 2006; 16(3), 183-189. Ghorab MM, Abdel-Salam HM, El-Sayad MA and Mekhel MM. Tablet formulation containing meloxicam and beta-cyclodextrin: mechanical characterization and bioavailability evaluation. AAPS PharmSciTech, 2004; 5(4): e59. Gibaldi M and Perrier D. Pharmacokinetics (2nd Edition). ed. 1982, New York: Marcel Dekker Inc. Gschwend MH, Erenmemişoğlu A, Martin W, Tamur U, Kanzik I and Hincal AA. Pharmacokinetic And Bioequivalence Study Of Meloxicam Tablets In Healthy Male Subjects. Arzneimittel-forschung, 2007; 57(05): 264-268. Hanft G, Türck D, Scheuerer S and Sigmund R. Meloxicam Oral Suspension: A Treatment Alternative To Solid Meloxicam Formulations. Inflam Res, 2001; 50(1), 35-37. Kürti L, Kukovecz Á, Kozma G, Ambrus R, Deli MA and Szabó-Révész P. Study Of The Parameters Influencing The Co-Grinding Process For The Production Of Meloxicam Nanoparticles. Powder Technol, 2011; 212(1), 210-217. Lehr T, Staab A, Tillmann C, Trommeshauser D, Schaefer HG and Kloft C. A Quantitative Enterohepatic Circulation Model. Clin Pharmacok, 2009; 48(8), 529-542. Mahmood K and Ashraf M. A Simple, Specific And Precise HPLC Method For The Measurement Of Meloxicam In Biological Fluids. Pak J Sci, 2008; 60(3-4), 85-89. Marcelín‐Jiménez G, Hernández J.A, Angeles AP, Contreras L, García A, Hinojosa M, Morales M, Rivera L, Martínez‐Rossier L and Fernández A. Bioequivalence Evaluation Of Two Brands Of Meloxicam Tablets (Promotion® And Mobicox®): Pharmacokinetics In A Healthy Female Mexican Population. Biopharmaceutl Drug Disposit, 2005; 26(5), 167-171. Medvedovici A, Albu F, Georgita C, Mircioiu C and David V. A Non-Extracting Procedure For The Determination Of Meloxicam In Plasma Samples By HPLC-Diode Array Detection. ArzneimittelForschung, 2004; 55(6), 326-331. Moore JW and Flanner HH. Mathematical comparison of dissolution profiles. Pharma technol, 1996; 20(6), 64-74. Narjes H, Türck D, Busch U, Heinzel G and Nehmiz G. Pharmacokinetics And Tolerability Of Meloxicam After Im Administration. Bri J Clin Pharmacol, 1996; 41(2), 135-139. Porta V, Ferraz HG, Souza TMDL, Kano EK and Serra CHDR. Determination Of Meloxicam In Human Plasma By HPLC. Revista Brasileira de Ciências Farmacêuticas, 2005; 41(2), 215-222.
019
Reynolds JEF. Martindale, Extra Pharmacopiea, in The Complete Drug Reference: Meloxicam, S, S., Editor. 2005: London: Pharmaceutical Press. Rigato HM, Mendes GD, Borges N and Moreno R. Meloxicam Determination In Human Plasma By High-Performance Liquid Chromatography Coupled With Tandem Mass Spectrometry (LC-MS-MS) In Brazilian Bioequivalence Studies. Int J Clin Pharmacol Therapeut, 2006; 44(10), 489-498. Sander O, Hübner G, Türck D, Degner F and Rau R. Meloxicam Pharmacokinetics In Elderly Compared To Younger Male And Female Patients With Rheumatoid Arthritis. Rheumatol Eur, 1995; 24(S3), 221. Shaji J and Varkey D. Development And Validation Of A Reverse Phase-Hplc Method For Determination Of Meloxicam In Pharmaceutical Dosage Forms And Human Plasma. Int J Pharmaceut Sci Revi Res, 2012; 12(1), 152-160. Sinha PK, Jeswani RM, Topagi KS and Damle MC. A Validated RP-HPLC Method For Determination Of Meloxicam In The Presence Of Its Impurities. Int J Pharm Tech Res, 2009(1); 1051-1060. Türck D, Busch U, Heinzel G and Narjes H. Clinical Pharmacokinetics Of Meloxicam. Eur J Rheumatol Inflamm, 1995; 15, 2234. Türck D, Roth W and Busch U. A Review Of The Clinical Pharmacokinetics Of Meloxicam. Br J Rheumatol, 1996; 35(suppl 1), 1316. Türck D, Busch U, Heinzel G and Narjes H. Clinical Pharmacokinetics Of Meloxicam. Arzneimittel-Forschung, 1997; 47(3), 253-258. US-FDA. Guidance for industry: Dissolution testing of immediate release solid oral dosage forms. Food and Drug Administration, Center for Drug Evaluation and Research (CDER), Rockville, MD, USA, 1997. US-FDA. Guidance for Industry: Bioanalytical Method Validation, U.D.o.H.a.H.S., FDA (2001) Center of Drug Evaluation and Research (CDER), Rockville, MD, USA,