UWB RADAR IMAGING SYSTEM WITH TWO-ELEMENT RECEIVING ARRAY ANTENNA Dmitriy L. Sostanovsky1, Anatoliy O. Boryssenko2, E.S. Boryssenko3 1 Ratio Company, Kiev, Ukraine, (
[email protected]) Antenna & Propagation Laboratory, University of Massachusetts, Amherst, MA, USA (
[email protected]) 3 A&E Partnership, Amherst, MA, USA (
[email protected]) 2
Abstract UWB signals can propagate in cluttered environment and opaque media that enables exploring hidden homogeneities through registering and processing backscattered signals. One of such an application is UWB through-wall vision radar (UWBR), Sostanovsky (2004a), Radar Vision (2005). A prototype of low-complexity and low-cost portable UWBR sensor with a small receiving antenna array is presented. Several key implementation issues are discussed including design of antennas and other electromagnetic-related aspects of signal processing algorithms for time-domain focusing and imaging. Simulated and measured radar images demonstrate radar operation to map out a person behind walls. Keywords: Ultra-wide band (UWB), radar, through-wall vision, time-domain focusing, signal processing, receiving array, filed of view (FOV).
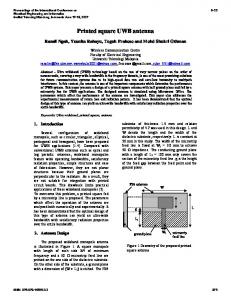
1. UWBR HARDWARE DESIGN 1.1. SYSTEM GENERAL ARCHITECTURE The UWBR block-schema and photo are in Fig. 1. The system includes 3 packaged modules of the same overall size, i.e. two receiving modules, at the left and right, and one transmitting module, at the centre. Each module contains antenna, RF and control electronics. Additionally, the transmitting module holds the system control electronics, interface to computer and power supply. All the modules have the same antennas based on novel patented antenna geometry, Sostanovsky (2004).
1.2. ANTENNA DESIGN The antenna includes only two specially-shaped metallic elements, i.e. a curved flare and its second part that serves partially as a reflector and second arm of a TEM-horn-like radiator, Fig. 2a. This antenna has a number of outstanding features such as broadband matching to 50 Ohm coaxial line, Fig. 3, and high directive gain with -20…-30 dB front-to-back ratio, Fig. 4. The later feature is extremely important for reducing considerably the level of signals scattered by background beyond the radar FOV. Those high-performed antenna features are accessible only through numerical full-wave electromagnetic analysis and parametric optimization. A triangular-patched antenna model used for these purposes is exhibited in Fig. 2 and the whole array is in Fig. 2b.
Fig.1.UWBR block-schema (top) and photo (bottom)
1.3. RADAR CIRCUITRY DESIGN
(a)
(b) Fig.2.UWBR antenna: (a) element mesh, (b) array.
All circuitry is placed on PCBs mounted inside the corresponding modules. A number of advanced schematic solutions were developed and implemented for the transmitter and receiver to support high-performed system operation. Specifically, the transmitter has to drive the transmitting antenna with necessary short pulses and the receiver must provide capturing of sharp backscattered signals. The presented system operates in the 0.5-2.5 GHz band at the -10 dB PSD level. This band is a result of trading between resolution, in-matter propagation properties and the antenna overall size. The transmitter provides 60 Volt peak-to-peak output pulses with the 1 MHz pulse repetition rate. The receivers operate in a stroboscopic mode with downconverting to the audio frequency band that enables next easier signal digitizing, e.g. with the help of a standard Windows-compatible sound card. The receiver-recorded signals, viz. scan signals, are updated at the 100 Hz rate, viz. 100 images per second that is compared to modern high-quality computer and TV displays.
2. RADAR ALGORITHMS & SOFTWARE 2.1. SOFTWARE ARCHITECTURE & FUNCTIONS Besides merely hardware, the system software is its inherent part to support functioning in a real-time or near real-time mode. The system software performs three main jobs: • Controlling the process of sounding and data recording. • Processing received signals and providing timedomain focusing.
Fig.3. Simulated element input impedance. (E ─, H - -)
Fig.4.Simulated element radiation pattern at 2 GHz.
• Imaging the radar scenes within FOV. All the program routines related to controlling, processing and imaging are performable at a standard PC system, e.g. a notebook, without any extra DAC/DAC special extensions. 2.1.1. Computer interface Controlling functions are provided through the PC serial COM ports while the data digitization and acquisition is accomplished with the help of the Windows-compatible sound card. Such cards have a stereo input with two channels used for the left and right receivers of the radar. 2.1.2. Programming Issues All the controlling and processing software is written in Matlab with several DDL patches re-written in C and compiled for accelerating a number of slowrunning routines related to imaging. The processing algorithms include also band-pass filtering of recorded waveforms, 2-D image processing, background removing, etc.
2.2. TIME-DOMAIN IMAGING ALGORITHM The scene images, Fig. 5, are generated for a given horizontal FOV bounded with the minimum distance, maximum distance, and angular extent. The maximum distance can be set up to 10 m apart and angular coverage in front of antennas can be up to 150 degree for the UWBR prototype. All the scene parameters are controllable through software as well as both the range and angular resolution parameters.
Fig.5.Radar scene for imaging with array.
• D1 & D2 are the distances from the receivers 1 & 2 to the focusing point (pixel) {i,j}. • c is the speed of light. The synthesized waveforms in two receiver channels are illustrated in Fig. 7. The initial part of the signal, viz. direct coupling signal, is the same for both the channels because of the geometrical symmetry while the target scattered signals are mutually shifted in time because of their different positions with respect to the transmitter for targets off the radar “optical” axis, and so on.
Fig.6.Radar FDV scene as numerical map of pixels.
The range and resolution characteristics define the number of “pixels”, i.e. spatial point to which the system needs to be focused, Fig. 6. The number of the pixels identifies the overall computational cost to form a scene image. The physical size of pixel is determined by the increments for sampling versus the distance and angle controllable in the UWBR software. In particular, the radar system is focused at each pixel through (1) equalizing the delay because of twoway travelling time in the receiver channels, Fig. 5, and (2) computing the correlation between the signals in two channels. The idea of equalizing is based on the apparent geometrical relations between the transmitting, scattering and receiving standpoints, Fig. 5. Thus, the “brightness” of a pixel {i,j} over the scene image can be computed as: Fig.7.Syntesized received signal for radar array.
I i , j = ∫ W (t ) ⋅ s1,ij (t ) ⋅ s2,ij (t )dt
(1)
TW
s1( 2 ),ij (t ) = S 1( 2 )(t − D0 c − Di , j 1(2) c)
3. SIMULATED & MEASURED RESULTS
• W(t) is a weighting window function.
The presented UWBR prototype is under tests by now. Some preliminary test results are reported in this work. The current test program is directed to the UWBR software while the hardware tests are mostly completed.
• TW is an appropriate time window for averaging over a pixel spot.
3.1. IMAGING OF A PERSON BEHIND WALL
• S1 & S2 are signals received in two channels, viz. numbered with 1 & 2, of the receiving array.
For example, the synthesized (simulated) image is depicted in Fig. 8 and real measured and computed image of nearly the same scene with a scattering ob-
where:
ject in front of the UWBR antennas is given in Fig, 9. Also, a couple of different imaging techniques is demonstrated in Fig, 8 and Fig. 9. The object, i.e. a person behind a brick-made wall, is detected at a spatial position to be shifted a bit, about 15 degree, to the left of the scene. The radar is installed in close proximity to the wall. The maximum range for both the cases in Fig. 8 and Fig. 9 is about 3 m. The targets are at the distance about 1.5 m and marked with the crosses on both the images. The direct coupling signal is visible also in the synthesized image in Fig. 8. The images are created in a background removing mode when the background scattering is first remembered by the UWBR system and then subtracted from the current scattering pattern each time when a new image is generated. Thus, the system can operate in a change detector mode with tracking for dynamical objects only and ignoring stationary ones over scenes. For example, moving of the chest cage caused by human breathing is easy detectable for persons hidden behind walls, etc.
REFERENCES 1.
2. 3. 4.
Sostanovsky D. L. , Boryssenko A. O., An Experimental UWB Module-Based Sensing and Communication System // Proceedings of Ultra Wideband and Ultra Short Impulse Signals Workshop, Sevastopol, Ukraine, 2004, pp. 231-233. Radar Vision, Time Domain Corporation, http://www.radarvision.com. Sostanovsky D.L, Boryssenko A.O, Patent UA 65488 A, Submitted November 28, 2003, Published March 3, 2004, Bulletin #3. Berryman J. G., Lecture Notes on Nonlinear Inversion and Tomography // LLNL Report UCRL-LR-10558, 1990.
3.2. SMALL BASE ARRAY IMAGING This radar system has a small interferometer base measured between centres of the receiver antennas equals about to 21 cm. This constraint is dictated by some design requirements, e.g. the system might be used as a handheld sensor. The small array base causes some difficulties to form a focused image. The raw images when the equalization and correlation procedures are merely applied are wide spread in the angular direction (cross-range) and only wellcompressed in the lateral range. The explanation is because of the small measurement base that makes the registered scattered signals a bit mutually shifted in the receiver channels, Fig. 7. In turn, the small time shift leads to poor focusing in the cross range, viz. versus the angle, Fig. 8 and Fig. 9. However, these images can be further improved through focusing provided by the next level of processing algorithms based on a number of short-base sensing/imaging techniques with the help of Gabor transform, low-base tomography, Berryman (1990), etc. but at the cost of extra computational resources required to perform such additional signal processing. This issue is under our ongoing efforts.
Fig.8.Synthesized (simulated) radar image.
Fig.9.Measured and computed radar image.