Synoptic Display Studio. Widgets. Sven Wende, Kai Meyer. C1 WPS GmbH. Vogt
-Kölln-Straße 30. D-22527 Hamburg. [sven.wende|kai.meyer]@c1-wps.de.
Synoptic Display Studio Widgets
Sven Wende, Kai Meyer C1 WPS GmbH Vogt-Kölln-Straße 30 D-22527 Hamburg [sven.wende|kai.meyer]@c1-wps.de
Page - 1 -
Table of Contents Sven Wende, Kai Meyer ........................................................................................ 1 1.
SDS Widgets.............................................................................................. 4 1.1.
Common Widget Properties ...................................................................... 4
1.2.
Passive Widgets ...................................................................................... 5
Rectangle
and Ellipse
Bargraph Label
.............................................................................. 5
................................................................................................... 6
........................................................................................................ 8
Polyline Arc
and Polygon
............................................................................... 9
......................................................................................................... 10
Waveform
and Strip Chart
..................................................................... 10
Switch
.................................................................................................... 13
Image
..................................................................................................... 13
Sixteen Binary Bar
.................................................................................... 14
GroupingContainer
.................................................................................... 15
LinkingContainer
...................................................................................... 16
Meter (experimental) 1.3.
................................................................................ 17
Active Widgets...................................................................................... 18
TextInput
................................................................................................ 18
Simple Slider
........................................................................................... 19
Advanced Slider ActionButton MenuButton Thumb Wheel Timer
....................................................................................... 20 ............................................................................................ 21
.............................................................................................. 22 ........................................................................................... 23
...................................................................................................... 24
Page - 2 -
Document History Document version
Author
Comments
0.8 (20.10.2008)
C1 WPS
Initial version
0.9 (27.10.2008)
C1 WPS
0.10 (06.11.2008)
DESY/Jörg Rathlev
Added documentation for 16 Bit Bar, Thumb Wheel and Meter.
Page - 3 -
1. SDS Widgets All SDS-widgets consists of three parts: a model, a controller (editpart) and a view (figure). How these parts are constructed and how they work together is described in the SDS-Developers Guide. Most of the models of the SDS widgets are store in the package org.csstudio.sds.components.model, the controllers in org.csstudio.sds.components.ui.internal.editparts and the figures in org.csstudio.sds.components.ui.internal.figures. If some parts are contained in different packages, then the specific package is appended. The next section describes the properties, which are contained by most of the SDS widgets. Afterwards the passive and active widgets are described. The values in the column “Type” refer to the available property types described in “Synoptic Display Studio: Widget-Properties”.
1.1. Common Widget Properties Because of the internal structure for the model of a widget, every widget of the SDS has a set of properties by default. That set can be enhanced or reduced for a specific widget. The following table shows the common properties. “Min” and “Max” refer to the minimal rather the maximal possible value for Integer and Double properties. Category
Name
Type
Values
Description
Position
X-Coordinate
Integer
Min – Max
The x coordinate of the widget
Position
Y-Coordinate
Integer
Min – Max
The y coordinate of the widget
Position
Width
Integer
1 – Max
The width of the widget
Position
Height
Integer
1 – Max
The height of the widget
Display
Background Color
Color
The background color of the widget
Display
Foreground Color
Color
The foreground color of the widget
Display
Name
String
The name of the widget
Display
Cursor
Option
The default mouse cursor for the widget
Display
Tooltip
ParameterString
The Tooltip, which is able to display the current values of other properties
Behaviour
Visibility
Boolean
Behaviour
Alias
StringMap
True, False
The visibility of the widget All known aliases for the widget. An alias is a name, which refers to a PV or a Page - 4 -
part of it. Behaviour
Enabled
Boolean
True, False
A not enabled widget can’t perform actions (e.g a slider won’t change the value)
Behaviour
Permission ID
String
The id for the authorization (isn’t fully supported yet)
Behaviour
Primary PV
String
The main PV associated with the widget. Can contain an alias
Behaviour
Action Data
ActionData
All configured actions, which can be accessed for example via the context menu
Border
Border Color
Color
The color of the border (only used by some border styles)
Border
Border Width
Integer
0 – Max
The width of the border (only used by some border styles)
Border
Border Style
Option
None, Line, Labelled, Raised, Lowered, Dot, Shape, Dash, Dash Dot, Dash Dot Dot
The currently selected style of the border
All those properties can be configured in a static way by entering a specific value, in a dynamically way using PV’s and they can be status depending (e.g. depending on the current status of the connection).
1.2. Passive Widgets Passive widgets are just visualizing the configured data. Because every widget has the “Action Data” property, it is possible to configure an action, which changes a value. But that is not really the behaviour of the widget. Passive widgets are not intended to change values.
Rectangle
and Ellipse
The Rectangle and the Ellipse are very simple widgets for the SDS. They are just a rectangle or an ellipse with a fill level. That level indicates how many percents of the content is painted in the foreground color, while the rest is painted in the background color. The orientation of the fill level is also configurable.
Page - 5 -
The custom properties are: Category
Name
Type
Values
Description
Behaviour
Value
Double
0,0 – 100,0
The fill level in percent
Behaviour
Horizontal Orientation
Boolean
True, False
If set to True, then the Rectangle is filled from left to right. If set to False it is filled from bottom to top
Display
Transparent Background
Boolean
True, False
If set to True, then the area, which isn’t painted as filled, is hidden.
The classes responsible for the Rectangle are: •
Model: RectangleModel
•
Controller: RectangleEditPart
•
Figure: RefreshableRectangleFigure
The classes responsible for the Ellipse are: •
Model: EllipseModel
•
Controller: EllipseEditPart
•
Figure: RefreshableEllipseFigure
Bargraph The Bargraph is in basics like the Rectangle. It also has a fill level and an orientation, but additionally levels for the four states “LoLo”, “Lo”, “Hi” and “HiHi”. With a rule attached to the “Fill Color” property it is possible to change the color of the “filled” area corresponding to the passed state. Furthermore a scale can be shown and it is configurable whether only the fill level should be marked or if the complete area until the fill level should be painted in the corresponding color.
The custom properties are: Category
Name
Type
Values
Description
Behaviour
Value
Double
Min – Max
The fill level
Behaviour
Horizontal
Boolean
True, False
If set to True, then the Rectangle is filled from Page - 6 -
Orientation
left to right, otherwise it is filled from bottom to top
Behaviour
Minimum
Double
Min – Max
The smallest possible value
Behaviour
LoLo
Double
Min – Max
The “LoLo” level. “NaN” means no level
Behaviour
Lo
Double
Min – Max
The “Lo” level. “NaN” means no level
Behaviour
Hi
Double
Min – Max
The “Hi” level. “NaN” means no level
Behaviour
HiHi
Double
Min – Max
The “HiHi” level. “NaN” means no level
Behaviour
Maximum
Double
Min – Max
The greatest possible value
Display
Transparent Background
Boolean
True, False
If set to True, then the area, which isn’t painted as filled, is hidden.
Display
Fill Color
Color
Color for the “filled” area
Display
Color Fillbackground
Color
Color for the not “filled” area
Display
Show values
Boolean
If set to True, then the configured values for the scale are shown.
Display
Tickmarks
Option
None, Bottom / Right, Top / Left
If the value is not “None”, then the marks for the four levels are shown at the corresponding side of the Bargraph
Display
Scale
Option
None, Bottom / Right, Top / Left
If the value is not “None”, then a scale is shown at the corresponding side of the Bargraph
Display
SectionCount
Integer
1 – Max
Number of sections for the scale
Display
Show only value
Boolean
True, False
If set to true, then only the current value is marked, not the complete area.
Page - 7 -
“NaN” is the shortcut for “Not a Number”. It is the result if a number is divided by 0, for example The classes responsible for the Bargraph are: •
Model: BargraphModel
•
Controller: BargraphEditPart
•
Figure: RefreshableBargraphFigure
Label The main task of the Label is to display some text. That can be: a text or a number entered in the “Text value”-property, the current value of a PV or the PV contained by the “Primary PV”-property. To show the PV the “Primary PV” has to be set and “Value Type” has to be “Alias”.
The custom properties are: Category
Name
Type
Values
Description
Behaviour
Value Type
Option
Text, Double, Alias, Hex
Determines what kind of input is shown. Affects the way the value is displayed.
Behaviour
Decimal Places
Integer
0 - 10
The count of decimal places (only used when the value type is “Double”).
Display
Font
Font
Display
Text Alignment
Option
Center, Top, Bottom, Left, Right
The Alignment of the text relative to the widget
Display
Transparent Background
Boolea n
True, False
If set to True, then only the text is displayed.
Display
Text Rotation Angle
Double
0,0 – 360,0
Rotation angle of the text relative to the widget
Display
X-Offset
Integer
Min – Max
Adjustment of the x coordinate of the text
Display
Y-Offset
Integer
Min – Max
Adjustment of the y coordinate of the text
Display
Text Value
String
The font for the text.
Text to display
The classes responsible for the Label are: •
Model: org.csstudio.sds.model.LabelModel Page - 8 -
•
Controller: LabelEditPart
•
Figure: RefreshableLabelFigure
Polyline
and Polygon
The Polyline and the Polygon can be used to create figures with a more complex shape. Their shape is determined by a list of points accessible through the “Points”-property. Changing those points affects the width and/or the height of the widget and vice versa. Both widgets have a fill level like the Rectangle or the Ellipse. The Polygon and the Polyline are (besides the Switch) the only widgets, which are fully rotatable.
The custom properties for both widgets are: Category
Name
Type
Values
Description
Position
Points
Point
Behaviour
Value
Double
0,0 – 100,0
The fill level in percent
Display
Rotation Angle
Double
0,0 – 360,0
The angle to rotate the widget
The corner points of the widget
The custom properties for Polyline are: Category
Name
Type
Values
Description
Display
Line Width
Integer
1 – 100
The width of the drawn line
Display
Line Style
Option
Solid, Dot, Dash, DashDot, DashDotDot
The Alignment of the text relative to the widget
The classes responsible for the Polyline are: •
Model: PolylineModel
•
Controller: PolylineEditPart
•
Figure: RefreshablePolylineFigure
The classes responsible for the Polygon are: •
Model: PolygonModel
•
Controller: PolygonEditPart
•
Figure: RefreshablePolygonFigure
Page - 9 -
Arc The Arc allows the user to draw arcs and segments of circles. The arc starts at an angle of “Start Angle” beginning at the middle of the right side of the widget and runs contraclockwise with the angle of the “Angle” property.
The custom properties are: Category
Name
Type
Values
Description
Display
Transparent Background
Boolean
True, False
If set to True, then only the arc or the segment of a circle is drawn.
Display
Line Width
Integer
Min – Max
The width of the drawn line
Display
Start Angle
Integer
0 – 360
The start angle of the widget
Display
Angle
Integer
0 – 360
The angle of the widget
Display
Fill Color
Color
Display
Filled
Boolean
Color for the “filled” area True, False
If set to true, then segment of the circle is drawn in the “Fill Color”
The classes responsible for the Arc are: •
Model: ArcModel
•
Controller: ArcEditPart
•
Figure: RefreshableArcFigure
Waveform
and Strip Chart
The Waveform and the Strip Chart are representing some data of the control system as a graph. Both widgets display every value as a single spot in the coordinate system. The Waveform is able to display four unbound lists of number at the same time. Every value of the four lists is displayed in the graph. So with every refresh the graphs are completely redrawn, without regard to the former values. The Strip Chart has eight different input values. With a rate specified by the “Update interval (seconds)” property the current values of the input properties are appended on the right side of the representation. That way the Strip Chart is able to display the history of the eight input values. If no PV is connected to an input value, then the value won’t change and the representation within the Strip Chart is a flat line.
Page - 10 -
The custom properties for both widgets are: Category
Name
Type
Values
Description
Display
Show Axes
Option
None, XAxes, YAxes, Both
Determines which axes should be displayed
Display
Grid Lines
Option
None, XAxes, YAxes, Both
Determines which grid lines should be displayed
Display
Line Chart
Boolean
True, False
If set to true, then the single points of a function are connected
Display
Plot Color #
Color
The color for the corresponding input data
Display
Grid Line Color
Color
The color for the grid lines
Display
Minimum
Double
Min – Max
The smallest possible value
Display
Maximum
Double
Min – Max
The greatest possible value
Display
Automatic Scaling
Boolean
True, False
If set to True, then Minimum and Maximum are adjusted o the smallest and greatest value in the input lists
Display
Labelled Ticks
Boolean
True, False
If set to True, then value of a tick is also displayed
Display
Graph Line Width
Integer
1 – 100
The width function
Display
Transparent Background
Boolean
True, False
If set to True, then only functions the axes and the grid lines are drawn.
Display
Data Point Drawing Style
Option
Single pixel, Small plus sign, Small square, Diamond
The style how the points of the functions are drawn
of
one
Page - 11 -
Display
Y-Axes scaling
Option
Linear, Logarithmic
Determines the scaling behaviour of the Y-axis
Display
Label
String
The label widget
Display
X-Axis Label
String
The label for X-axis
Display
Y-Axis Label
String
The label for Y-axis
for
the
The custom properties for the Waveform are: Category
Name
Type
Values
Behaviour
Data #
DoubleArray
Description The four input lists of numbers
The custom properties for the Strip Chart are: Category
Name
Type
Values
Description
Behaviour
Value #
Double
Behaviour
X-axis timespan (seconds)
Double
1,0 – Max
Specifies the range of the X axis
Behaviour
Update interval (seconds)
Double
0,1 – 60,0
Specifies the rate for updating the representation
Display
Enable plot #
Boolean
True, False
If set to True the corresponding plot is displayed
The eight input values
The classes responsible for the Waveform are: •
Model: WaveformModel
•
Controller: WaveformEditPart
•
Figure: WaveformFigure
The classes responsible for the Strip Chart are: •
Model: StripChartModel
•
Controller: StripChartEditPart
•
Figure: StripChartFigure
Page - 12 -
Switch This widget is just a graphical representation of a switch. It is not possible to trigger the real switch with this widget. The Switch provides six different representations by the “Switch Type” property and it is fully rotatable.
The custom properties are: Category
Name
Type
Values
Description
Behaviour
Switch Type
Option
Lasttrennschalter, Erdtrenner, Leistungsschalter, Leistungstrennsch alter, Schaltertrennstelle , Trennschalter
The available switch representations
Display
Transparent Background
Boolean
True, False
If set to True, then only functions the axes and the grid lines are drawn.
Display
Switch State
Integer
Min – Max
The state of the switch
Display
Rotation
Integer
0 – 360
The rotation angle
Display
Line Width
Integer
Min – Max
The width of the lines
The classes responsible for the Switch are: •
Model: ImageModel
•
Controller: ImageEditPart
•
Figure: RefreshableImageFigure
Image This widget is able to display a picture stored in a .jpg, .jpeg, .png, .bmp or .gif file. With the “Crop …” properties you can crop the picture at the corresponding side.
Page - 13 -
The custom properties are: Category
Name
Type
Values
Description
Image
File
Resource
Every .jpg, .jpeg, .bmp, .png, .gif file
The file of the picture
Image
Crop Top
Integer
Min – Max
The smallest possible value
Image
Crop Bottom
Integer
Min – Max
The greatest possible value
Image
Crop Left
Integer
Min – Max
The step size
Image
Crop Right
Integer
Min – Max
The count of decimal places
Image
Stretch to fit
Boolean
True, False
If set to true, then the picture will be resized to fit the width and height of the widget
The classes responsible for the Image are: •
Model: ImageModel
•
Controller: ImageEditPart
•
Figure: RefreshableImageFigure
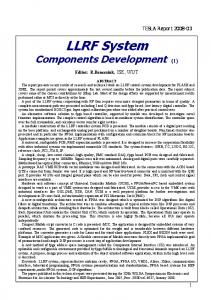
Sixteen Binary Bar This widget graphically displays the individual bits of a numerical value. For each bit of the value, one box is drawn in either the “on” color if the corresponding bit is zero or the “off” color if the corresponding bit is one. The least significant bit of the value is shown on the left of the widget, the most significant bit on the right. The widget can display up to 32 bits.
The custom properties are: Category
Name
Type
Values
Description
Behaviour
Value
Integer
Min – Max
The current value
Behaviour
Bit range
Integer
0 – 31
The index of the least significant bit that is Page - 14 -
(from)
displayed.
Behaviour
Bit range (to)
Integer
0 – 31
The index of the most significant bit that is displayed.
Display
Horizontal Orientation
Boolean
True, False
If set to True, then the bar is filled from left to right. If set to False it is filled from top to bottom.
Display
Show labels
Boolean
True, False
If set to True, the index of the bits is shown in each box.
Display
Label fonts
Font
Display
Internal frame thickness
Integer
Display
On Color
Color
The color used for drawing a box for an “on” bit.
Display
Off Color
Color
The color used for drawing a box for an “off” bit.
Display
Label text color
Color
Color for the text of the labels
Display
Internal Frame Color
Color
Color for the border of every section
The font for the labels Min – Max
The width of the frame drawn around each box.
The classes responsible for the Sixteen Binary Bar are: •
Model: SixteenBinaryBarModel
•
Controller: SixteenBinaryBarEditPart
•
Figure: RefreshableSixteenBinaryBarFigure
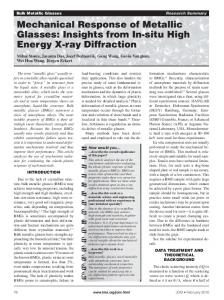
GroupingContainer A GroupingContainer can be used to combine several Widgets to a group. When the GroupingContainer is moved all contained Widgets are moved in the same way. So the widgets within a GroupingContainer don’t change their position relative to the other widgets of the container. If a WidgetAction is defined for the GroupingContainer, then all of its children will also have this action. When the “Rotation Angle”-property is changed, the children will be rotated relating to the middle of the GroupingContainer, instead of rotating the GroupingContainer itself. If a child is rotatable (Polyline, Polygon, Switch and GroupingContainer) the widget will be rotated to.
Page - 15 -
There are two ways to create a GroupingContainer. Like every other widget, you can choose a GroupingContainer from the palette and create such a widget on the display. After that you can drag or paste widgets into the container to become the children of it. Or you can select several widgets, click with the right mouse button on one of them and then choose “Create a Group” from the menu. A new GroupingContainer will be created and all selected Widgets become the children of the container.
The custom properties are: Category
Name
Type
Values
Description
Display
Transparent Background
Boolean
True, False
If set to True, then only the text is displayed.
Display
Rotation Angle
Double
0,0 – 360,0
The angle to rotate the children of the container
The classes responsible for the GroupingContainer are: •
Model: org.csstudio.sds.model.GroupingContainerModel
•
Controller: org.csstudio.sds.ui.editparts.GroupingContainerEditPart
•
Figure: org.csstudio.sds.ui.figures.GroupingContainerFigure
LinkingContainer The LinkingContainer is able to contain a complete SDS display. Which display can be configured via the “Resource” property. All aliases configured for this widget are passed to the contained display.
The custom properties are: Category
Name
Type
Values
Description
Behaviour
Resource
Resource
Every .csssds file
The SDS display to show
Display
Automatic Zoom
Boolean
True, False
If set to true, then the contained display will be resized to fit into the Page - 16 -
bounds of the LinkinContainer
The classes responsible for the LinkingContainer are: •
Model: org.csstudio.sds.model.LinkingContainerModel
•
Controller: org.csstudio.sds.ui.editparts.LinkingContainerEditPart
•
Figure: org.csstudio.sds.ui.figures.LinkingContainerFigure
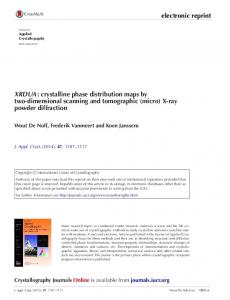
Meter (experimental) The meter widget displays a value within a given range on a radial scale. Similar to the bargraph, the HIHI, HI, LO and LOLO boundaries can be displayed in the widget. The current value is indicated by the position of the needle within the widget, and is also displayed below the scale. Note that the meter widget is currently experimental. There are several known problems with this widget.
The custom properties are: Category
Name
Type
Values
Description
Behaviour
Boundary HI, HIHI, LO, LOLO, M
Double
Min–Max
The value boundaries.
Behaviour
Decimal places
Integer
0–5
The maximum number of decimal places shown.
Behaviour
Major scale step
Double
Min–Max
The distance of the major tick marks shown on the scale.
Behaviour
Maximum value
Double
Min–Max
The greatest value that can be displayed on the scale.
Behaviour
Minimum value
Double
Min–Max
The lowest value that can be displayed on the scale.
Behaviour
Minor scale step
Double
Min–Max
The distance of the minor tick marks shown on the scale. Page - 17 -
Behaviour
Value
Double
Min–Max
The current value.
Display
Channel Font
Font
The font that is used to display the channel name (on the top of the widget).
Display
Color HI, HIHI, LO, LOLO, M
Color
The color of the respective sections of the scale.
Display
Display angle
Integer
1–359
The angle of the scale.
Display
Inner angle
Integer
1–359
The angle of the scale that is actually used. (??)
Display
Needle color
Color
The color of the needle.
Display
Scale color
Color
The color of the scale.
Display
Scale radius
Double
0–1
Does strange things.
Display
Scale text radius
Double
0–1
Does strange things.
Display
Scale width
Integer
Min–Max
The width of the lines of the scale.
Display
Transparent background
Boolean
True, False
If set to True, the background of the widget is transparent.
Display
Values font
Font
Display
Visible radius
Double
The font used to display the values on the scale. 0–1
Does strange things.
The classes responsible for the Meter are: •
Model: org.csstudio.sds.components.model.MeterModel
•
Controller: org.csstudio.sds.components.ui.internal.editparts.MeterEditPart
•
Figure: org.csstudio.sds.components.ui.internal.figures.RefreshableMeterFigure
1.3. Active Widgets Active widgets allow the user to change data, without using the context menu of the widget, They provide some kind of buttons or sliders, so the user is able to click on one of those widgets to change the corresponding data.
TextInput Page - 18 -
The TextInput looks exactly like the Label, but it allows entering a text at runtime. The text can be passed to the underlying control system by attaching an output channel to the “input Text” property.
The custom properties are: Category
Name
Type
Values
Description
Behaviour
Input Text
String
Behaviour
Value Type
Option
Text, Double, Alias, Hex
Determines what kind of input is shown. Affects the way the value is displayed.
Behaviour
Decimal Places
Integer
0 - 10
The count of decimal places (only used when the value type is “Double”).
Display
Font
Font
Display
Text Alignment
Option
Center, Top, Bottom, Left, Right
The Alignment of the text relative to the widget
Display
Transparent Background
Boolean
True, False
If set to True, then only the text is displayed.
The entered text
The font for the text.
The classes responsible for the TextInput are: •
Model: TextInputModel
•
Controller: TextInputEditPart
•
Figure: RefreshableLabelFigure
Simple Slider The Simple Slider can display a Double or Integer value, but it can also changes the value. If the slider anchor is dragged or the buttons on the left and right side are pressed then the current value changes, if a corresponding input- and output channel is configured.
The custom properties are:
Page - 19 -
Category
Name
Type
Values
Description
Behaviour
Slider Value
Double
Min – Max
The current value of the slider
Behaviour
Min
Double
Min – Max
The smallest possible value
Behaviour
Max
Double
Min – Max
The greatest possible value
Behaviour
Increment
Double
Min – Max
The step size
Behaviour
Decimal Places
Integer
0-5
The count of decimal places
Display
Show value as text
Boolean
True, False
If set to true, then the current value will also be displayed as text above the slider
Display
Horizontal Orientation
Boolean
True, False
If set to True, then the slider is horizontal and vertical otherwise
Display
Slider wide
Integer
0 – Max
The width of the slider anchor
Display
Text Value
String
Text to display
The classes responsible for the Simple Slider are: •
Model: SimpleSliderModel
•
Controller: SimpleSliderEditPart
•
Figure: SimpleSliderFigure
Advanced Slider The Advanced Slider is in many cases identical to the Simple Slider. It differs in the graphical representation and its configuration.
The custom properties are: Category
Name
Type
Values
Description
Behaviour
Slider Value
Double
Min – Max
The current value of the slider
Behaviour
Min
Double
Min – Max
The smallest possible value
Behaviour
Max
Double
Min – Max
The greatest possible value
Behaviour
Increment
Double
0,001 – 1000,0
The step size
Behaviour
Decimal
Integer
0-5
The count of decimal places Page - 20 -
Places Display
Show value as text
Boolean
True, False
If set to true, then the current value will also be displayed as text above the slider
Display
Orientation
Option
Horizontal, Vertical
If set to Horizontal, then the slider is horizontal, vertical otherwise
The classes responsible for the Advanced Slider are: •
Model: AdvancedSliderModel
•
Controller: AdvancedSliderEditPart
•
Figure: AdvancedSliderFigure
ActionButton The ActionButton is able to execute an action when the user presses the button and when the button is released. To do this, the ActionButton contains three properties. One ActionData-Property and two indices one for pressed and one for released. The indices indicate which action from the ActionData should be executed. When an index is –1 no action is executed when the corresponding change of state occurs. E.g.: If the “pressed”index is –1 and the “released”-index is 0, than no action will be executed if the user presses the button and holds it down. When the button is released the first action from the ActionData will be performed. If just one WidgetAction is defined, than this action will be executed, except for the corresponding index is greater than –1. The ActionButton can be also used as a toggle button. To enable this behaviour, the “Toggle Button”-property must be checked. If the ActionButton is disabled, that’s when the “Enabled”-property is not checked, then the button couldn’t be pressed and no actions are executed.
The custom properties are: Category
Name
Type
Values
Description
Behaviour
Action Index (released)
Integer
-1 – Max
The index of the action, which should be executed when the button is released. -1 means no action
Behaviour
Action Index (pressed)
Integer
-1 – Max
The index of the action, which should be executed when the button is pressed. Page - 21 -
-1 means no action Behaviour
Toggle Button
Boolean
True, False
Display
Text Label
String
Text for the button
Display
Font
Font
The font for the text.
Display
Text Alignment
Option
Center, Top, Bottom, Left, Right
If set to true, the button has the behaviour of a toggle button
The Alignment of the text relative to the widget
The ActionButton has no border properties. The classes responsible for the ActionButton are: •
Model: ActionButtonModel
•
Controller: ActionButtonEditPart
•
Figure: RefreshableActionButtonFigure
MenuButton Like the ActionButton the MenuButton can execute actions. But instead of executing the action automatically when the user hits the button, a menu appears to allow the user to choose which action should be performed. If the MenuButton should display the latest sent value an input channel must be configured on the “Label Text”-property. The input channel must be the same as the output channel of the “Action Data”-property. In this way the MenuButton will display the current value and the label will be updated every time the data of the configured channel changes (e.g. when a COMMIT_VALUE-action of the MenuButton is executed). If the MenuButton is disabled the button couldn’t be pressed and the menu won’t appear.
The custom properties are: Category
Name
Type
Display
Font
Font
Display
Text Alignment
Option
Values
Description The font for the text.
Center, Top, Bottom, Left,
The Alignment of the text relative to the Page - 22 -
Right Display
Text Value
String
widget Text to display
The classes responsible for the MenuButton are: •
Model: MenuButtonModel
•
Controller: MenuButtonEditPart
•
Figure: RefreshableLabelFigure
Thumb Wheel The Thumb Wheel displays a decimal value. Each digit of the displayed value can be manipulated directly by using the up and down buttons displayed above and below each digit.
The custom properties are: Category
Name
Type
Values
Description
Behaviour
Value
Double
Min – Max
The current value
Behaviour
Min
Double
Min – Max
The lowest possible value
Behaviour
Max
Double
Min – Max
The greatest possible value
Behaviour
Integer Digits
Integer
Min – Max
Count of digits to the left of the decimal point
Behaviour
Decimal Digits
Integer
Min – Max
Count of digits to the right of the decimal point
Display
Wheel Fonts
Font
Font for the wheel
Display
Internal frame color
Color
Color of the separators for the digits
The classes responsible for the Thumb Wheel are: •
Model: ThumbWheelModel
•
Controller: ThumbWheelEditPart
•
Figure: RefreshableThumbWheelFigure
Page - 23 -
Timer The Timer is not really an “active” widget, because the user can’t trigger an action by the graphical representation. But the widget itself can execute a script (which can change data) specified in the “Script”-property every time the given delay has passed. That is the reason why the Timer is considered as an “active” widget. Because the widget just shows how long it takes until the configured script is executed again, it is configured as invisible in many cases. So the size-, the position- and the layer-properties of the Timer are removed. It starts, when the Timer is enabled, a script specified in the “Script”-property every time the given delay has passed.
The custom properties are: Category
Name
Type
Values
Description
Behaviour
Script
Resource
Every .csssdss file
The script to execute
Behaviour
Delay (in ms)
Integer
0 – Max
The delay for the script
Because the Timer is hidden in most cases, all Display properties (X-coordinate, Ycoordinate, Width, Height, Border, Visibility …) are removed. The classes responsible for the Timer are: •
Model: TimerModel
•
Controller: TimerEditPart
•
Figure: RefreshableTimerFigure
Page - 24 -