Heinrich Söbke, Senta Berner, Laura Weitze, 2014. Spreadsheet Software as Decision Supporting Tool in Engineering Disciplines Quality Requirements and Development Approach. In S. Klein, ed. Sustainable Resource Based Sanitation and Organic Waste Utilisation (Sano) in South Africa. Berlin: Spreadsheet Software as Decision Supporting Tool 87 Rhombos-Verlag Berlin, pp. 87–104, ISBN 978-3-944101-52-1.
V) Spreadsheet Software as Decision Supporting Tool in Engineering Disciplines - Quality Requirements and Development Approach Heinrich Söbke1, Senta Berner2 and Laura Weitze1 1
Bauhaus-Universität Weimar, Bauhaus-Institute for Infrastructure Solutions, Weimar, Germany {heinrich.soebke|
[email protected]} 2 North-West University, Potchefstroom, South Africa
[email protected]
Abstract
D
ra
ft
Decision-making processes in engineering disciplines can be enhanced by computer-based tools, so-called Decision Support Systems (DSS). In general, the development and usage of such tools requires a lot of resources in terms of time, money and knowledge. Spreadsheet software is established as a less resource-demanding flexible foundation for DSS. For this reason, spreadsheet software is the preferred choice in a lot of decisional settings. On the other hand, such solutions are error-prone, mainly due to lack of professional development processes. In our work, we examine how the quality of spreadsheet solutions can be increased. First, we identify those aspects of software quality that are relevant and critical in this context as defined in the relevant international standard (ISO/IEC 9126). Thereafter, we evaluate the outcome of a literature review regarding these identified aspects of quality. As a result, quality-enhancing approaches are discussed. These approaches can be divided into constructive and analytical methodologies. As a non-formal development process is typical for the implementation and usage of spreadsheet-based decision support systems, we suggest that automated and integrated tools as product-improving approaches are the most promising ones. Keywords: Decision Support System, End-User Software Engineering, ISO 9126, Software Quality Spreadsheet.
1
Introduction
Engineers have to make decisions in order to find fitting solutions for often complex and ill-structured problems. Mostly these decisions are backed up by data and calculations. Computer tools which ease the handling of data and
88
H. Söbke et al.
ra
ft
improve the decisions’ quality are so called Decision Support Systems (DSS). Power (1997) subsumes under the termn DSS any interactive computer-based system that helps to make decisions under the term DSS. There are several approaches to create a DSSs. The first possibility is the development of dedicated applications using formal processes of software engineering. This approach needs common development cycles with distinct roles of developers and users. It is exposed to all difficulties and challenges of traditional software development, like the risk to fail despite of many employed resources (Mysiak et al. 2005). So it shows the high failure rate of common software development projects (Ambler, 2010). Nevertheless, it is the method of choice for a lot of problem definitions. However a great many problems can be tackled by an alternative kind of software solution: by spreadsheet-based DSS (e.g. Buehlmann et al. 2000; Meensel et al. 2012). Compared to specialized applications spreadsheet-based DSSs show some advantages, among others their flexibility, their low resource requirements and their participatory development approach. Here, the roles of developer and user tend to coalesce. So the development process needs less communication effort, it becomes more informal and agile (Martin, 2002). The main drawback of this approach is the high error rate in created spreadsheets. One reason are the shortcomings of the development process; another reason are the errors accidentally introduced during use and maintenance of the spreadsheets.
D
The approach of end-users being the ones who actually develop the software is also known as End-User Software Engineering (EUSE) (Burnett et al. 2004). Ko et al. (2011) summarize “the key difference between professional software engineering and end-user software engineering is the amount of attention given to software quality concerns”. They give examples for areas of EUSE apart from spreadsheets: e-mail users (who write e-mail rules to sort their e-mail), website administrators (who use tools to generate content for their website) or architects (who use modelling tools)5. Given the quality problem of spreadsheet-based solutions our research question is how quality can be improved when end-users develop their own DSS. We tackle this problem by a discourse about the specifics and importance of spreadsheet software in section 0. As a reference we introduce a common model of software quality - the relevant international ISO standard 9126 (ISO/IEC 9126)6. In section 0 we introduce the aspects of this standard and identify those measures which are especially relevant in the context of
5
Related to EUSE are the research areas EUP (End-User Programming) and EUD (End-User Development) (Burnett and Scaffidi, 2013).
6
It has been superseded by the ISO/IEC 25000 international standard, nevertheless we regard the core model still as an appropriate frame (ISO/IEC 2005).
Spreadsheet Software as Decision Supporting Tool
89
spreadsheet software. Section 0 presents the result of a literature review regarding the quality of spreadsheets and discusses their impact on the characteristics of the quality model. Finally we analyse our findings and come to a conclusion in section 0.
2
Specifics of spreadsheet software
ra
ft
The first important characteristic is the target group: Commonly spreadsheet software is commonly used by end-users to solve their problems. The software has almost no entry hurdles – it does not require the knowledge of programmers. So the end-user is both, domain expert and information technology (IT) expert. This saves a lot of communication and development effort – compared to the development processes of dedicated DSS applications with additionally involved end-users (Meensel et al., 2012; Mysiak et al., 2005). The results of such spreadsheets generated by end-users often fulfil the needs and are accepted as state of the art solutions. Also, spreadsheet software serves as an alternative, preliminary solution in case of unavailable specialized applications (Kulesz, 2011). Years before – without spreadsheet software - the work of many programmers was needed to accomplish similar goals (Campbell-Kelly, 2007). So spreadsheets make it possible to solve problems even with low or no (formal) budgets.
D
Another important feature of spreadsheets is their flexibility. Spreadsheet software is not limited to a certain domain – it supports solutions for all calculation models which can be expressed by means of spreadsheet cells. Furthermore spreadsheet software allows solutions with different levels of technical requirements. Considering the case of MS Excel there is cell content with varying complexity: literals, simple formulas and sophisticated formulas. For advanced users a programming language – Visual Basic for Applications (VBA) – is provided for advanced users. Such a set of tools with different technical requirements gives the users a choice which fits their own capabilities and the demands of the problems to be solved. Buehlmann et al. (2000) present an example of a spreadsheet-based DSS for wood panel manufacturing which uses multiple levels of Excel’s technical sophistication – ranged from simple formulas to own graphical user interfaces implemented in VBA. One main aspect of the quality of spreadsheet software is its accessibility: both the software and its artifacts (spreadsheet files) are highly accessible to the user. Spreadsheet software is part of almost every personal computer – when there is no license of the commercial product MS Excel available it can be easily substituted by free, fully featured spreadsheet software via internet
90
H. Söbke et al.
download7. Spreadsheet files can either be created from scratch or by e-mail or on websites. Additionally, existing spreadsheet files can be used as a template: they can be modified to match the individual needs of the author. So there are no major setup times. The list of critical success factors for spreadsheet usage identified by Meensel et al. (2012) also mentions the features described above. It comprises flexibility, perceived usefulness, accessibility, credibility, intended users, and maintenance and adaptability.
ft
As a drawback of the development and adaptation by end-users, spreadsheets are often not sufficiently tested and show a relatively high fault rate8. Kruck and Sheetz (2001) give an overview of numerous spreadsheet error studies (cf. Panko and Sprague, 1998). This is even more important as spreadsheets are frequently used for mission-critical tasks, such as financial calculations (Robinson, 2013). Recent regulations of the financial sector (Sarbanes Oaxley, Basel II, Solvency II) impact the usage and life cycle of spreadsheets (Leon et al., 2012).
D
ra
On the one hand, spreadsheet software offers huge power to the end-user. Ronen et al. (1989) state “that one of the major advantages of spreadsheets is their ease of use. A decision-maker can develop a model quickly without waiting for completion of the steps required during traditional systems analysis and design”. On the other hand, this is done at the cost of a high susceptibility to errors. This overarching area of tension has led to the development of a community around the usage of spreadsheet software in professional contexts. Profit and non-profit organizations leverage the use of spreadsheets. An example is the European Spreadsheet Risks Interest Group (EuSpRiG), which hosts an annual conference about spreadsheet risk management9. Spreadsheet Controls is a web-based communication platform dealing with strategies to overcome problems of spreadsheet usage in companies10. Commercial software has been developed for the automated creation of a companywide inventory of spreadsheets and automated check for potential errors (Agrawal, 2010). Also the computer-based validation of spreadsheets is subject to scientific research (Kulesz and Zitzelsberger, 2012). Furthermore, the systematic use of spreadsheets is investigated in an academic context
7 8
9 10
Apache OpenOffice (http://www.openoffice.org/, last accessed July, 1th 2014) is such a wellknown spreadsheet software. Erroneous spreadsheet models are responsible for some high impact faults. A collection of ‘horror stories’ can be accessed on http://www.eusprig.org/horror-stories.htm or on http://www.eusprig.org/stories.htm , last accessed July, 1th 2014. http://www.eusprig.org/, last accessed July, 1th 2014 http://www.spreadsheetcontrols.org/, last accessed July, 1th 2014
Spreadsheet Software as Decision Supporting Tool
91
(Grossman, 2013) as well as it is the subject of formal education (Sidaoui, 2009).
3
Quality
D
ra
ft
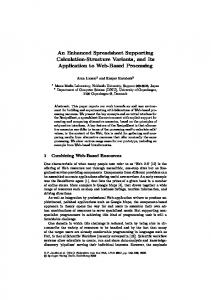
The ISO standard 9126 defines the quality of a software product. Software product quality is defined by means of six sub-categories: functionality, reliability, usability, efficiency, maintainability and portability (cf. Figure 1). We use the given quality model as a guideline for the evaluation of spreadsheet quality characteristics – as spreadsheets can be considered as a software that needs to accomplish certain quality goals.
Figure 1: Software Quality Model (Source: ISO/IEC 9126)
Functionality. Functionality is defined as the “capability [...] to provide functions which meet stated needs”. Spreadsheet software provides a frame in which one’s own calculation models can be developed – so it is able to cover a wide range of needs with the help of user-defined calculation models. Since main parts of the functionality are implemented in user-defined calculation models the user is directly responsible for this characteristic. Reliability. The definition for reliability is “the capability [...] to maintain a specified level of performance when used under specified conditions” (ISO/IEC, 2000). The level of performance cannot be perpetuated in the case of software errors. In general, the reliability of spreadsheet software itself can be considered as being excellent because of the high number of users – its maturity is high. Spreadsheet-implemented calculation models often do not have a large number of users. Thus, they are not as mature as the software itself. In general, reliability in the context of spreadsheet software can be defined as the absence of errors in the calculation model.
92
H. Söbke et al.
Usability. The category of usability is further defined by the terms of understandability, attractiveness and learnability. So the user interface is of special importance when considering the degree of usability. This is already a well-known topic in the field of software engineering (Shneiderman, 1998). Users of spreadsheets, who are usually domain experts, are not necessarily well-educated in the field of user interface usability. For this reason, guidelines for an appropriate structure of spreadsheets are needed. Efficiency. Efficiency is defined as the characteristic “to provide appropriate performance, relative to the amount of resources used.” Given a normal PC, the efficiency of spreadsheet software is not a problem often named nowadays – other kinds of software – e.g. video editing software – are known as more resource-consuming.
ft
Maintainability. One general aspect of maintainability is given by changeability: “the capability of a software product to enable a specified modification to be implemented” (ISO/IEC 1926). A major characteristic of spreadsheet software is the flexibility of the implemented calculation models. The high level of flexibility requires specific attention to design approaches to keep up long-term maintainability of spreadsheets.
D
ra
Portability. Portability is the capability of the software product to be transferred from one environment to another. Spreadsheet software belongs to the standard software inventory of a personal computer. There are spreadsheet software packages available for free. Data formats of spreadsheets are interchangeable to a certain degree11. Both facts together ensure a broad distribution of spreadsheet software. Therefore, the portability of spreadsheets can be considered as being existent..
4
Enhancing Quality
4.1
Software quality model with regard to spreadsheets
The Software Quality Model is a generic model created for a broad range of software. For each type of software the fulfilment of the named subcharacteristics means something different. In the previous section we identified maintainability, reliability and usability as the sub-characteristics with the highest impact on the quality of spreadsheets. In this section we focus on strategies and measures, which we have found in literature, to improve those characteristics.
11
Interchangeability of spreadsheet data formats may be restricted when macros and code has been supplied or when non-standard formatting has been applied.
Spreadsheet Software as Decision Supporting Tool
93
Many of the mentioned experiments are performed with the help of so-called corpora: well-defined collections of spreadsheets. Among them is the EUSES Spreadsheet Corpus (Fisher II and Rothermel, 2005). These “real world” Excel sheets have been collected by using Google. Panko (2000) describes the Galumpke Corpus and the Wall Corpus – two collections of spreadsheets – each stemming from an experimental attempt to create a calculation model and containing the errors that were originally made. These corpora serve as a normative measurement of the tools that ought to improve the dependability of spreadsheets.
4.2
Learnability and understandability
ra
ft
Learnability and understandability are traits of the sub-characteristic usability. They are of great importance because every spreadsheet needs to be studied and understood before it can be operated by a user – if the user has not designed the spreadsheet himself. So spreadsheets should be designed in a way that encourages easy and fast transfer of the spreadsheet calculation model into a mental model of the user. This becomes much more important as spreadsheets often have to be operated by persons who have not created them: They may receive them by their colleagues or by former colleagues who are not available for training any longer (Kulesz and Zitzelsberger, 2012). One approach to improve understandability of a spreadsheet is to classify the data.
D
Table 1. Types of data Data type
Description
Input
Content which has to be supplied by the user in order to achieve a proper result.
Input parameter
Constant values for calculations which should not be changed by the end-user, but which are used in formulas and which ease adoption of the spreadsheet.
Output textual
Results of the calculations in textual representation
Output graphical
Spreadsheet values in graphical representation, allows visual linkage of input and output values.
Table 1 shows a possible categorization12. The category of each piece of information determines its presentation, formatting and location in the
12
Hermans et al. (2011) use another classification for automated spreadsheet analysis: Data, Formula, Label or Empty.
94
H. Söbke et al.
spreadsheet. For example output data should be protected against mistaken change. Input data should clearly be marked. So it becomes clear on first sight, which information has to be provided by the user – if each input field is formatted accordingly. Such a clear distinction of data types allows the establishment of a straight Input-Process-Output (IPO) model, as it is demonstrated for example by the use case of Buehlmann et al. (2000).
4.3
Maintainability
ft
Several attempts have been made to visualize the structure of a spreadsheet in order to increase its understandability. Hermans et al. (2011) created a tool that transforms a spreadsheet into dataflow diagrams. They observed that these diagrams where helpful when users explained the functionality of a spreadsheet to colleagues. Mittermeir and Clermont (2002) developed a visualization of larger structures – they defined logical areas and semantic classes – in spreadsheets. With such a representation the user should get a better understanding of a spreadsheet’s structure.
ra
In general, maintenance of a spreadsheet also requires the learnability and understandability of its content as discussed in the previous section. While learnability and understandability rather refer to the application of a spreadsheet, maintainability is connected to the design and development of a spreadsheet.
4.4
D
One way to create a spreadsheet is to copy a template and make necessary adjustments. So the characteristic maintainability is an important aspect of a spreadsheet: a spreadsheet needs to be adaptable to different requirements.
Complexity
Complexity of spreadsheets is an important variable for maintainability. The technical capabilities of users and their experience with spreadsheet software differ highly according to the high flexibility of this software (Lawson et al., 2009). What relevant experience the person needs who has to do maintenance on the spreadsheet depends on the complexity of the respective spreadsheet. Also, the detection rate of errors during inspections decreases with increasing formula complexity (Panko, 1999).These facts lead to the question of how the complexity of spreadsheets can be measured. Bregar (2004) gives an overview of complexity metrics for spreadsheets. An example for such a metric is Formula size: the numbers of operators and operands are counted. The metric Formula structure determines the average nesting level within a formula. The greater the values of these metrics are in a
Spreadsheet Software as Decision Supporting Tool
95
cell formula, the more error-prone this formula is. Additionally, “auditability, modifiability, reliability and comprehensibility are hindered”. Kruck (2006) states that high formula complexity decreases correctness. Hermans et al. (2012b) regard understandability as a main factor of the successful maintenance of spreadsheets: changes to a spreadsheet will very probably introduce new errors if the user does not understand the spreadsheet model well. As a result they found that complexity and placement of formulae have a measurable impact on the understandability and therefore influence the maintainability of spreadsheets.
4.5
Reliability
D
ra
ft
As defined above, reliability in the context of spreadsheets is mainly the absence of errors. Therefore, it is worth to have a closer look at errors and their causes as well as taxonomies. Janvrin and Morrison (2000) identify factors which contribute to errors in spreadsheets: “developer inexperience, poor design approaches, application types, problem complexity, time pressure and [...] absence of review procedures”. Panko and Sprague (1998) use the metric Cell Error Rate (CER) – the relation of the number of cells with errors and the total number of cells. The value of the CER was 2% in their experiment. They have compiled a list of studies concerning spreadsheet errors: the lowest percentage of models with errors - another metric they have used - was 11% with an average of 47% (n=12). This high error rate is caused by cascaded cells - a characteristic of spreadsheet calculation models: values of a cell depending on the values of other cells. This structure results in high probabilities of socalled bottom-line errors. Panko and Sprague (1998) also define a taxonomy of errors: mechanical errors (caused e.g. by entering wrong symbols), logic errors (e.g. using a wrong algorithm) and omission errors (the calculation model is missing a relevant part). Other taxonomies of errors have been reviewed by Powell et al. (2008). They state a lack of a commonly valid taxonomy of spreadsheet errors and postulate that a taxonomy always needs a context for which it has been created. Panko and Aurigemma (2010) revised the earlier Panko & Halverson taxonomy of spreadsheet errors (Panko and Halverson, 1996) with special regard to qualitative errors: quantitative errors result in incorrect values due to wrong calculation, whereas qualitative errors are problems in the design of the spreadsheet, which might increase the difficulty of maintenance and therefore lead to quantitative errors. An example of a qualitative error is the usage of a constant instead of a cell reference in a formula. Panko and Aurigemma assign the main direction of future research to qualitative errors as quantitative errors are accepted and well-known.
96
4.6
H. Söbke et al.
Attempts to improve reliability
The standard ISO 9126 distinguishes between process quality and product quality. The quality of the development process influences the quality of the resulting product. For this reason, measures to improve reliability can be divided in process-improving and product-improving ones. Product-improving measures are commonly statically and measure the absence or presence of defects. Both types of measures may be partially supported by tools. Product. Powell et al. (2008) distinguish between measures which prevent errors and those which detect errors. Error detection can be supported by tools which check spreadsheets for potential errors. There exist both commercial tools and solutions derived from an academic context. Examples from the broad range of commercial spreadsheet auditing tools are Spreadsheet Professional (SpreadsheetInnovations, 2013), XLAudit (CIMCON, 2013) and XLAnalyst (Codematic, 2013).
D
ra
ft
Kulesz and Zitzelsberger (2012) developed the Spreadsheet Inspection Framework (SIF), an open source project started for research purposes. Blayney (2008) created a VBA module to analyse hard coded constants. He hypothesises that the usage of hard coded constants impedes spreadsheet maintainability: the number of errors increases with the advancing lifetime of the spreadsheet, because if the constants are adjusted it will be hard to find and change all constants that have the same meaning. According to Teo and Tan (1997), hard coded constants are significantly correlated to a higher error rate. During their experiment they asked their subjects to execute ‘what-if’ analyses, so that they could immediately measure the influence of hard coded constants (Teo and Tan, 1999). Hermans et al. (2012a) describe the software Breviz: commonly recognized code smells13 in spreadsheets are detected and visualized – so the user gets an impression of potentially errorprone designs. A theoretical background for measuring the quality of spreadsheets is given by Cunha et al. (2012). They also employ the ISO 9126 standard of quality as a frame for determining metrics for all attributes of quality. Those given metrics are measured automatically. Process. A lot of the discovered measures refer to the software development process itself. Testing is a common approach of software engineering to enhance the reliability of software. This testing methodology has also been
13
Code smell is a term in software engineering and stands for a design weakness which is currently not an error, but may lead to an error during maintenance. An example is duplicated code, which requires the same maintenance work twice. The spreadsheet analogue is hard coded constants or formula which have been copied.
Spreadsheet Software as Decision Supporting Tool
97
applied to spreadsheets. Fisher II et al. (2006) experimented with methods of the generation of automated tests. Their approach has not reached the stage of practical application yet. Debugging is also a technique to track and eliminate errors in traditional software engineering. Abraham and Erwig (2007) introduce GoalDebug – a debugger for spreadsheet software targeted on end-users.
D
ra
ft
Panko and Sprague (1998) suggest having an eye not only on the product, but also on the process. The development process itself can lead to a higher reliability of the product. One process feature which leads to an improved quality is code inspection. Brown and Gould (1987) state that during the design of a spreadsheet only little time was spent on planning and systematic debugging. Janvrin and Morrison (2000) found that structured design methodologies decreased error rates. Panko and Halverson (1997) also revealed that groups of people (in their experiment: 2 and 3 people) had considerably better results in identifying errors compared to a single person14. Establishing an error detection process seems even more important as Teo and Tan (1997) found during an experiment that the corrections of errors introduces new errors. The consequence was that the absolute number of current errors in the sheet did not decrease. Ronen et al. (1989) suggest a Spreadsheet Development Life Cycle which consists of the phases Problem Identification, Model Definition, Model Construction, Spreadsheet Test, Documentation, Audit of Models and Structure, Manual Preparation, Training and Installation. They also propose a Spreadsheet Structure and Data Flow Symbols. Lawson et al. (2009) developed a seven-stage model: this model contains designing, testing, documenting, using, modifying, sharing, and archiving as phases of the life cycle. Isakowitz et al. (1995) developed a methodology for a generic and unifying model description that is independent from specific spreadsheet software. Powell et al. (2008) mention “background education, in-house training or spreadsheet standards” as approaches to improve the development process. Kruck and Sheetz (2001) propose three measures to enhance the accuracy of spreadsheets: first, a planning and design phase is needed. This approach reduces the design of trial-and-error and therefore the errors introduced by maintenance. Second, formula complexity has to be kept low. Low complexity allows a better understanding in the case of maintenance15. The last measure is
14
These results are consistent with methodologies propagated in professional software development a few years later. An example is the concept of Pair Programming – a part of the methodology of Extreme Programming (Beck and Andres, 2004).
15
This is a prerequisite for impact reduction of a phenomenon called Software Aging (Parnas, 1994): software changes complicate the model of the software because the
98
H. Söbke et al.
a testing phase. If the originator of a spreadsheet spends time on reducing errors the need for error-prone maintenance by other users is reduced. Positive impacts of these measures on spreadsheet reliability has been acknowledged in a later study (Kruck, 2006).
4.7
Best Practices
ft
Although the term ‘best practice’ is controversial (Ambler, 2012), we use it as a synonym for a proven and accepted set of rules to tackle a given problem. Best practices can be applied to support all quality aspects we have named. Kulesz and Zitzelsberger (2012) state that there is also no common understanding of best practices for the development of spreadsheets16. Nevertheless, they investigated the influence of three exemplary design rules: “Do not put constants in formulae”, “Keep formulae complexity low”, and “Refer to the left and above”. The experiment could not find a relation between the development of spreadsheets according to this given set of design rules and the correctness of those sheets. However, maintainability was eased when those best practice rules had been followed during the design process. Lawson et al. (2009) point out the often missing empirical evidence for those few best practices given in literature.
ra
Kruck (2006) used best practices belonging to those areas which have been identified as being relevant to reliability by Kruck and Sheetz (2001). In an experiment they tested the impact of following best practices. As a result, an error reduction of 30% was measured.
4.8
D
The above mentioned software SIF is one component in a semi-automatic approach to detect and ensure best practices (Kulesz 2011).
Regulations
Leon et al. (2012) conducted an investigation about internal regulations for the usage of spreadsheets for the purpose of financial reporting in companies. Those companies were subjected to the Sarbanes Oxley Act (U.S.Congress, 2002) which regulates financial reporting. Although this bill imposes strict regulations on the reporting process, the survey of Leon et al.
developer does not understand the model completely. This makes the resulting model even more complex, till the software cannot be maintained any longer. For spreadsheets, this phenomenon may exist only in a less distinctive form – but in general, complex models make maintenance more difficult. 16
As an important difference between best practices and design patterns (Gamma et al. 1995) – prevalent in professional software development – they state that descriptions of best practices usually emphasize only their positive impact. Design pattern descriptions contain also disadvantages and weaknesses.
Spreadsheet Software as Decision Supporting Tool
99
shows that controls are not established thoroughly in the field. For example “effective controls for change management, access, and version management are seriously deficient. [...] Companies need more information about how to create policies that outline a cohesive, effective, and efficient set of controls”. Here, regulations should ensure correct figures and therefore reliability since economic transactions like tax payments and stock exchange prices depend on these numbers.
5
Discussion and conclusion
D
ra
ft
It is unquestioned that spreadsheet software is an appropriate foundation for DSS. So Buehlmann et al. (2000) conclude that “spreadsheet-based DSS developed using VBA in Excel offers a viable means for enabling better decision-making in business”. On the other hand, the high adaptability of spreadsheet software can lead to a coalescence of the roles of developer and user of the software. This results in a higher rate of software faults and therefore a reduced reliability of spreadsheet-based software solutions, as nonprofessional development practices are prevalent. There are different kinds of measures to ensure software quality: (constructive) methodologies to improve the software development process and (testing) measures to determine the current status of the product. In the case of spreadsheet-based DSS we value reliability as the most critical criterion for quality. There should be attempts to introduce common software development methodologies to spreadsheet development. But this approach seems to contradict the typical context of spreadsheet software applications: having to observe long-winded development processes disagrees with the original intention of using spreadsheet software and would strip the usage of spreadsheets of its main advantages. Although available spreadsheet software adopts to different development methodologies (Ronen et al., 1989), a structured development approach seems not to be in coherence with the prevalent paradigm of the usage of fast and instant solutions. Instead of improving the process, we suggest automated audits of spreadsheets as measures to ensure quality: for this purpose, a great many tools have been created; we used some of them during our work. These tools are able to perform complexity analyses and can identify hot spots and high-risk cells (Powell et al., 2008) as well as software smells. If users deal with the results of such tools and are being alerted to factual errors and potential design weaknesses, they will learn to avoid such shortcomings. That way, automated audits might contribute to the education of the users. Auditing tools should be integrated into the spreadsheet software – as add-ons or, preferably, as adaptive parts of the software as supplied by the manufacturer.
100
6
H. Söbke et al.
References
Abraham, R., & Erwig, M. (2007). GoalDebug: A Spreadsheet Debugger for End Users. In Proceedings of the 29th international conference on Software Engineering (pp. 251–260). Washington, DC, USA: IEEE Computer Society. doi:10.1109/ICSE.2007.39. Agrawal, S. (Cimcon) (2010). The need for spreadsheet controls. Financial Services Technology, 4, 76–77. Ambler, S. W. (2010). 2010 IT Project Success Rates. Dr.Dobbs. Retrieved May 10, 2012, URL:http://www.drdobbs.com/architecture-and-design/2010-itproject-success-rates/226500046#. Ambler, S. W. (2012). Questioning “ Best Practices ” for Software Development. Ambysoft. Retrieved August 21, 2013, URL:http://www.ambysoft.com/essays/bestPractices.html.
ft
Beck, K., & Andres, C. (2004). Extreme Programming Explained: Embrace Change (2nd editio., p. 224). Addison-Wesley.
ra
Blayney, P. J. (2008). An Investigation of the Incidence and Effect of Spreadsheet Errors Caused by the Hard Coding of Input Data Values into Formulas. arXiv Preprint arXiv:0803.0169, 221–230.
D
Bregar, A. (2004). Complexity metrics for spreadsheet models. In Proceedings of EuSpRIG 2004 Conference Risk Reduction in End User Computing: Best practice for spreadsheet users in the new Europe (pp. 1–9). doi:ISBN: 1 902724 94 1. Brown, P. S., & Gould, J. D. (1987). An experimental study of people creating spreadsheets. ACM Trans. Inf. Syst., 5(3), 258–272. doi:10.1145/27641.28058. Buehlmann, U., Ragsdale, C., & Gfeller, B. (2000). A spreadsheet-based decision support system for wood panel manufacturing. Decision Support Systems, 29(3), 207–227. doi:10.1016/S0167-9236(00)00072-5. Burnett, M. M., Cook, C., & Rothermel, G. (2004). End-user software engineering. Communications of the ACM, 47(9), 53–58. doi:10.1145/1015864.1015889. Burnett, M. M., & Scaffidi, C. (2013). End-User Development. (M. Soegaard & R. F. Dam, Eds.)The Encyclopedia of Human-Computer Interaction. Aarhus, Denmark: The Interaction Design Foundation. Retrieved August 22, 2013, from http://www.interaction-design.org/encyclopedia/enduser_development.html.
Spreadsheet Software as Decision Supporting Tool
101
Campbell-Kelly, M. (2007). Number Crunching without Programming: The Evolution of Spreadsheet Usability. IEEE Annals of the History of Computing, 29(3), 6–19. doi:10.1109/MAHC.2007.43. CIMCON. (2013). XLAudit Spreadsheet Audit Tool. Retrieved August 30, 2013, from http://www.sarbox-solutions.com/main/product-xlaudit.asp. Codematic. (2013). XLAnalyst - Proactive Spreadsheet Risk Management. Retrieved August 30, 2013, from http://www.spreadsheethell.com/xlanalyst/default.htm. Cunha, J., Fernandes, J. P., Peixoto, C., & Saraiva, J. (2012). A Quality Model for Spreadsheets. 2012 Eighth International Conference on the Quality of Information and Communications Technology, 231–236. doi:10.1109/QUATIC.2012.16.
ft
Fisher II, M., & Rothermel, G. (2005). The EUSES spreadsheet corpus: a shared resource for supporting experimentation with spreadsheet dependability mechanisms. SIGSOFT Softw. Eng. Notes, 30(4), 1–5. doi:10.1145/1082983.1083242.
ra
Fisher II, M., Rothermel, G., Brown, D., Cao, M., Cook, C., & Burnett, M. M. (2006). Integrating automated test generation into the WYSIWYT spreadsheet testing methodology. ACM Trans. Softw. Eng. Methodol., 15(2), 150–194. doi:10.1145/1131421.1131423.
D
Gamma, E., Helm, R., Johnson, R., & Vlissides, J. (1995). Design Patterns. (A.W. P. Co, Ed.)Elements (Vol. 47, pp. 1–429). Addison Wesley. doi:10.1016/j.artmed.2009.05.004. Grossman, T. A. (2013). Spreadsheet Analytics. Retrieved July 29, 2013, from http://www.usfca.edu/management/spreadsheet-analytics. Hermans, F., Pinzger, M., & Deursen, A. Van. (2011). Supporting professional spreadsheet users by generating leveled dataflow diagrams. In ICSE ’11 Proceedings of the 33rd International Conference on Software Engineering (p. 451460). ACM New York, NY, USA. doi:10.1145/1985793.1985855. Hermans, F., Pinzger, M., & Deursen, A. van. (2012a). Detecting and visualizing inter-worksheet smells in spreadsheets. In Proceedings of the 2012 International Conference on Software Engineering (pp. 441–451). Piscataway, NJ, USA: IEEE Press. Hermans, F., Pinzger, M., & Deursen, A. Van. (2012b). Measuring spreadsheet formula understandability. In arXiv preprint arXiv:1209.3517 (pp. 1–12).
102
H. Söbke et al.
Isakowitz, T., Schocken, S., & Lucas, H. C. J. (1995). Toward a logical/physical theory of spreadsheet modeling. ACM Transactions on Information Systems (TOIS), 13(1), 1–37. doi:10.1145/195705.195708. ISO/IEC. (2000). Information technology - Software product quality — Part 1: Quality model. In International Standard ISO/IEC FDIS 9126-1 (Vol. 2000, p. 36). ISO/IEC. ISO/IEC. (2005). Software engineering — Software product Quality Requirements and Evaluation (SQuaRE) — Guide to SQuaRE. In International Standard ISO/IEC 25000. Janvrin, D., & Morrison, J. (2000). Using a structured design approach to reduce risks in end user spreadsheet development. Information & Management, 37(1), 1–12. doi:10.1016/S0378-7206(99)00029-4.
ft
Ko, A. J., Abraham, R., Beckwith, L., Blackwell, A., Burnett, M. , Erwig, M., … Wiedenbeck, S. (2011). The state of the art in end-user software engineering. ACM Comput. Surv., 43(3), 21:1–21:44. doi:10.1145/1922649.1922658.
ra
Kruck, S. E. (2006). Testing spreadsheet accuracy theory. Information and Software Technology, 48(3), 204–213. doi:http://dx.doi.org/10.1016/j.infsof.2005.04.005. Kruck, S. E., & Sheetz, S. D. (2001). Spreadsheet accuracy theory. Journal of Information Systems Education, 12(2), 93–108.
D
Kulesz, D. (2011). From Good Practices to Effective Policies for Preventing Errors in Spreadsheets. arXiv Preprint arXiv:1111.6878. Kulesz, D., & Zitzelsberger, S. (2012). Investigating Effects of Common Spreadsheet Design Practices on Correctness and Maintainability. arXiv Preprint arXiv:1211.7104, 1–16. Lawson, B., Baker, K., Powell, S., & Fosterjohnson, L. (2009). A comparison of spreadsheet users with different levels of experience. Omega - The International Journal of Management Science, 37(3), 579–590. doi:10.1016/j.omega.2007.12.004. Leon, L., Kalbers, L., Coster, N., & Abraham, D. (2012). A spreadsheet life cycle analysis and the impact of Sarbanes-Oxley. Decision Support Systems, 54, 452–460. doi:10.1016/j.dss.2012.06.006. Martin, R. C. (2002). Agile Software Development, Principles, Patterns, and Practices. Prentice Hall.
Spreadsheet Software as Decision Supporting Tool
103
Meensel, J. Van, Lauwers, L., Kempen, I., Dessein, J., & Huylenbroeck, G. van. (2012). Effect of a participatory approach on the successful development of agricultural decision support systems: The case of Pigs2win. Decision Support Systems, 54(1), 164–172. doi:10.1016/j.dss.2012.05.002. Mittermeir, R., & Clermont, M. (2002). Finding high-level structures in spreadsheet programs. In Ninth Working Conference on Reverse Engineering (pp. 221–232). IEEE Comput. Soc. doi:10.1109/WCRE.2002.1173080. Mysiak, J., Giupponi, C., & Rosato, P. (2005). Towards the development of a decision support system for water resource management. Environmental Modelling & Software, 20(2), 203–214. doi:10.1016/j.envsoft.2003. 12.019. Panko, R. R. (1999). Applying code inspection to spreadsheet testing. Journal of Management Information Systems, 16(2), 159–176.
ft
Panko, R. R. (2000). Two corpuses of spreadsheet errors. In System Sciences, 2000. Proceedings of the 33rd Annual Hawaii International Conference on. (Vol. 00, p. 8).
ra
Panko, R. R., & Aurigemma, S. (2010). Revising the Panko-Halverson taxonomy of spreadsheet errors. Decision Support Systems, 49(2), 235–244. doi:10.1016/j.dss.2010.02.009.
D
Panko, R. R., & Halverson, R. P. J. (1996). Spreadsheets on trial: a survey of research on spreadsheet risks. Proceedings of HICSS-29: 29th Hawaii International Conference on System Sciences, 2, 326–335. doi:10.1109/HICSS.1996.495416. Panko, R. R., & Halverson, R. P. J. (1997). Are Two Heads Better than One?(At Reducing Errors in Spreadsheet Modeling). Office Systems Research Journal, 15(1), 21–32. Panko, R. R., & Sprague, R. H. J. (1998). Hitting the wall: errors in developing and code inspecting a `simple’ spreadsheet model. Decision Support Systems, 22(4), 337–353. doi:http://dx.doi.org/10.1016/S01679236(97)00038-9. Parnas, D. L. (1994). Software Aging. In Proceedings of the 16th international conference on Software engineering (Vol. 81, pp. 279–287). IEEE Computer Society Press. doi:10.1109/ICSE.1994.296790. Powell, S. G., Baker, K. R., & Lawson, B. (2008). A critical review of the literature on spreadsheet errors. Decision Support Systems, 46(1), 128– 138. doi:http://dx.doi.org/10.1016/j.dss.2008.06.001.
104
H. Söbke et al.
Power, D. J. (1997). WHAT IS A DSS? DS* - The On-Line Executive Journal for Data-Intensive Decision Support, 1(3), 1. Robinson, D. (2013). Finance groups lack spreadsheet controls. The Financial Times. Retrieved July 23, 2013, from http://www.ft.com/ cms/s/0/60cea058-778b-11e2-9e6e-00144feabdc0.html#axzz2ZsrziZVf. Ronen, B., Palley, M. A., & Lucas, H. C. J. (1989). Spreadsheet analysis and design. Communications of the ACM, 31(1). Shneiderman, B. (1998). Designing the User Interface: Strategies for Effective Human-Computer Interaction. Chapter (Vol. 3rd, p. 639). Addison-Wesley. doi:10.1016/0166-3615(93)90066-A. Sidaoui, M. (2009). Spreadsheet Modeling for Managerial Insight MBA 6107 (Syllabus). Retrieved July 29, 2013, from http://www.usfca.edu/facstaff/sidaoui/USF MBA/09 Fall MBA 6107 Syllabus Sidaoui.pdf.
ft
SpreadsheetInnovations (2013). Spreadsheet Professional. Retrieved August 30, 2013, from http://www.spreadsheetinnovations.com.
ra
Teo, T. S. H., & Tan, M. (1997). Quantitative and qualitative errors in spreadsheet development. In System Sciences, 1997, Proceedings of the Thirtieth Hawaii International Conference on (Vol. 3, pp. 149–155 vol.3). doi:10.1109/HICSS.1997.661583.
D
Teo, T. S. H., & Tan, M. (1999). Spreadsheet development and “what-if” analysis: quantitative versus qualitative errors. Accounting, Management and Information Technologies, 9(3), 141–160. doi:http://dx.doi.org/10.1016/S0959-8022(99)00006-5. U.S.Congress. Sarbanes Oxley Act of 2002 (2002).