has the potential to describe also crystal cracking during mechanical treatment of ... [2] A.C. van der Steen, H.J. Verbeek, J.J. Meulenbrugge, "Influence of RDX.
SIMULATION OF GRAIN BEHAVIOUR FOR EXPLOSIVE FORMULATIONS J.-A. Ferrez, L. Pournin, Th. Liebling EPFL, Ecole Polytechnique Fédérale de Lausanne Mathematics Institute CH-1015 Lausanne
J. Mathieu, P. Folly, H.R. Bircher Swiss Defence Procurement Agency Weapons Systems and Munition Test Center (FA 26) Feuerwerkerstrasse 39 CH-3602 Thun
ABSTRACT For production of high quality PBX charges, it is essential to have low viscosity formulations available during the casting process. As generally known, for a certain filling grade, casting viscosity depends strongly on particle size distribution and on particle shape. We have shown in previous work, that a high tap density of the solid energetic material is one strong requirement to get low viscosities after being mixed with corresponding binder ingredients. So far, the use of particle size distributions in formulation work was based on empirical or semi-empirical approaches, but there was, up to now, no theoretical background to understand in more detail the behaviour of solid energetic material in view of optimised density or flowability. In this paper we present a tool, which enables to perform simulations of packing densities and grain flowability based on a certain particle size distribution. The model used therefore consists of a distinct element method (DEM), observing each particle until its final position in the ensemble is reached. Considering a realistic particle size distribution, spanning several orders of magnitude and reasonable geometric conditions, which allow to neglect vessel border effects, at least several hundred thousands of particles have to be taken into account for a simulation. Therefore a very efficient algorithm to detect particle contacts, based on 3-dimensional Delaunay triangulation had to be established. But to simulate particles behaviour during a pouring or a vibrating process, this contact model had to be combined with an appropriate physical model to describe energy dissipation. Considering the influence of tapping frequency on average movement and segregation of particles we can show our first simulation results. Furthermore we are able to show the influence of different particle distribution on flowability.
1. INTRODUCTION The quality requirements of modern plastic bonded explosives (PBX) can only be achieved if the particle size distribution as well as the particle shape of the corresponding filler material is carefully controlled. As already shown in several studies, there exist close relationships between particle shape and sensitivity as well as between particle size distributions and achievable densities [1, 2, 3], which are closely linked to the performance of a high explosive. All these parameters do depend in some way from each other, so that in reality a systematic investigation of the influence on sensitivity or performance by varying only one of these parameters is impossible.
Binder System Energetic Material
Mechanical Properties Thermal Stability
Filler Content
Intrinsic Properties
Binder Adhesion Particle Size Porosity Particle Shape
Performance
SDT
DDT
Sensitivity
Figure 1-1: Complexity of relationships between different explosive specific parameters
Also the experimental determination of a particle size distribution can be linked to a series of uncertainties. As soon as the shape of the investigated particles doesn't correspond to a perfect sphere, the measured particle size distribution depends either on experimental conditions (in case of sieving) or on the applied data processing model (in case of laser diffraction analysis). Moreover, it can be quite challenging to measure a particle size distribution over four orders of magnitude, because many measuring techniques do not cover such a large range. Between a supplier and his clients these types of problems can be circumvented by defining the experimental method and corresponding parameters. This enables to make the comparison between different batches on a relative base.
But such an approach does not help to develop a more detailed understanding of relationships between particle properties and processing or charge parameters. As we have shown in a previous investigation [4], the casting viscosity of a curable PBX depends, among other parameters, strongly on tap density. This means, that a high tap density value is an important prerequisite to achieve low processing viscosities. On the other hand, a high tap density gives no guarantee for low viscosities, because the viscosity can also be influenced by other parameters, such as particle shapes. But nevertheless, for a batch of energetic material with a certain particle size distribution, tap density seems to be a good parameter to assess the potential for low processing viscosities. From our experience, tri-modal distributions with a size ratio of approximately 35:5:1 and a weight ratio of 70:20:10 have to be used to get high tap densities or low processing viscosities. It has to be mentioned, that not only the particle size ratio, but also the particle size distributions of the individual fractions, labelled as "coarse", "medium" and "small", play an important role. A nearly discrete tri-modal distribution results in bad viscosity values, whereas quite broad distributions lead to much more favourable results. It has further to be pointed out, that in view of ideal processing viscosities, the empirically optimised weight ratio of coarse, medium and small fractions do not correspond to the theory published by R.J. Farries [5], where based on a filling grade of 88% a blend ratio of 58:28:14 is predicted. Our investigation also revealed, that the effects of particle shape on tap density or processing viscosity are more pronounced, if the coarse particle fraction is affected. This means, that the most straight forward way to optimise the rheological behaviour of a cast curable formulation, is to use a coarse particle fraction with spherical shapes. There exist several technical approaches to optimise the shape of particles, such as ultrasonic treatment or partial dissolution [6]. Due to the complexity of relationships between different particle phenomena and due to the fact, that there is no way to investigate particle associated parameters independently, we decided to start a program with the objective to develop a simulation tool, where such kind of parameter studies are possible. In a first step particles have been assumed as to be perfect spheres. Later on the simulation tool was extended to consider also non-spherical particles. We have focused this kind of simulations on two main applications. First, we tried to model the tap
density experiment. As already described above, the control of tap density is one of the key parameters to get low processing viscosities for cast curable PBX's. The second application was the hour glass experiment. This experiment gives us the information how quickly or how easily an ensemble of particles can pass a funnel, an important parameter for feeding systems. 2. MATHEMATICAL AND PHYSICAL MODELS Numerical simulation is increasingly being used to understand and predict the behaviour of granular materials. Their highly discontinuous nature calls for specialized simulation methods and tools. The Distinct Element Method (DEM) is well suited. By tracking the evolution of each element, particle or grain separately, it allows to take into account their local behaviour while providing global measures. However, DEM simulations require very large number of elements in order to accurately reproduce the global behaviour of the material. High performance computing facilities as well as very elaborate data structures and algorithms are mandatory not only for the actual computation but also for post-processing and especially visualization of the results. We will focus here on the mathematical bases of an efficient DEM implementation, as well as on the physical laws that ensure the realism of the mathematical model and the correctness of the conclusions drawn from the simulations. THE DISTINCT ELEMENT METHOD The DEM scheme tracks every particle in the system: position, velocity, acceleration, orientation and spin are maintained and updated whenever the particle interacts with external elements (gravitation, contact with walls...) or with other particles. It is not our intent to go into the details of the DEM here, but rather just point out the two crucial issues that arise in this context: find where the interactions occur and apply a suitable numerical model. The interested reader will find a more complete coverage of the DEM in [7,8]. CONTACT DETECTION Localizing contact points among large sets of grains is a non-trivial task. Some sort of neighbourhood must be defined for each grain in order to reduce the number of potential contacts to be tested. In the much-simplified case where all
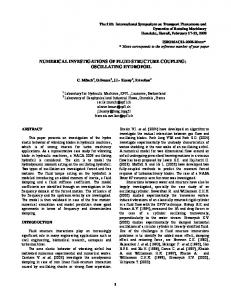
grains are spherical, a dynamic weighted Delaunay triangulation built on the centres of the grains has proven to be highly efficient, robust and versatile. An example of such a triangulation in two dimensions is shown in Figure 2-1.
Figure 2-1: The triangulation used to detect collisions, shown here in 2D. Contacts may only occur along an edge of the triangulation, thus the neighbourhood of each grain is given by the adjacency defined by the triangulation.
This collision detection scheme works by enclosing each sphere in its own convex polyhedral cell, thus forming a spatial decomposition known as the Power Diagram. Its dual structure, the regular (or weighted Delaunay) triangulation [9] provides an efficient way to monitor adjacency of the cells. Since spherical grains may collide only if their respective cells are adjacent, collision detection is reduced to a simple traversal of the edges of the Delaunay triangulation. A detailed discussion of this method can be found in [10], but the principle is illustrated in Figure 2-2. Figure 2-2: Four grains G1, G2, G3 and G4 in a 2-dimensional space. Left: the grains Gi and their Laguerre cells Li. Right: the grains Gi, their Laguerre cells Li (thin lines), and the weighted Delaunay triangulation (thick lines) on the centre of the grains.
Given four grains G1, G2, G3, G4 in a 2-dimensional space, we define the Laguerre cell of each grain as the set of points closer to that grain than to any other grain, yet using the power distance to a sphere. This extension of the wellknown Voronoi diagram allows to take into account the different sizes of the grains. Under mild hypotheses, detecting collisions or overlaps among the grains can be reduced to detecting adjacent Laguerre cells. Detecting adjacent Laguerre cells can in turn be performed efficiently by considering the dual structure, called the Delaunay triangulation. This triangulation can be constructed for almost any distribution of grains. However, its construction is almost as expensive as a straightforward method for detecting collisions, therefore the key
benefit of this approach lies in the fact that an existing Delaunay triangulation can be updated quickly to reflect the motion of the grains. The computational implementation of this collision detection scheme relies on elaborate two- or three-dimensional data structures to store the triangulation and all related adjacency information, and on special care regarding the numerical precision of the floating-point computations. It is relatively easy to produce parallel versions of these algorithms to further reduce the computation times. NUMERICAL CONTACT MODELS Soft-body contact models are based on the discretisation of time into very short intervals (10-5s to 10-7s). During those intervals, the grains are allowed to slightly overlap, and the characteristics of the overlap are used to model the contact. Forces acting on the grains at each contact point are decomposed into a normal and a tangential component, both of which were traditionally expressed as the sum of an elastic term (which ensures repulsion between the grains) and a viscous term (which provides energy dissipation): F = k x + c x’ where k and c are linear coefficients for elastic and viscous part, and x is the size of overlap caused by the contact. This is roughly equivalent to a double spring and dashpot system [11], as shown in Figure 2-3. Figure 2-3: The viscoelastic contact model of Cundall. The normal and tangential components of the contact force are computed as the sum of an elastic (spring) and viscous (dashpot) term. Both components are linked by Coulombian friction. The parameters of the model can be set from known physical quantities.
However, such simple models are usually hard to fine tune, because they rely on parameters (k and c) that are difficult to link with the physical contact models. If a grain is in contact with more than one other grain (which is the dominant case in packed materials) the overlaps may become much too large, up to the size of the grains themselves!
Newer numerical models are being designed that address those issues. Elastic and viscous components of the force are not linear anymore, and the history of the contact is accounted for in order to replicate more accurately the reloading mechanism of the contacts (hysteresis) [12]. One general consequence of those new models is an increased amount of computation required to obtain a more precise result. THE DEM ALGORITHM We present here the details of the algorithm for DEM simulations of spherical grains in 3D using soft-body contact models. The use of the dynamic Delaunay triangulation as neighbourhood function implies some changes in the general scheme of a distinct element simulation algorithm: steps 1 and 4 would not appear in a straightforward method, while step 2 would require another way to find the collisions. 1. Construct the initial Delaunay triangulation DT. This is the start-up overhead, incurred only once. 2. Apply the numerical contact model at every collision. Along each edge (i,j) of DT, if spheres i and j overlap, then apply the numerical contact model. This is where the use of the triangulation shows its strength, as the number of tests to be performed is low. 3. Add external factors and update the trajectories. All forces are known, it is possible to integrate the equations of motion to obtain the new particle positions. 4. Update the triangulation DT. The triangulation DT must be updated to account for the new particle positions. 5. Go back to 2. The iteration duration must be chosen carefully. Small values will require many more iterations for the same result, but too large values might introduce inconsistencies in the triangulation (step 4) and a loss of accuracy in the model behaviour (step 2). The triangulation remains valid for a certain amount of time, so step 4 is only performed every 50 to 200 iterations depending on the material.
3. TAP DENSITY SIMULATIONS Considering the problem of achieving high densities for energetic material, we have simulated the mixing of three different powder fractions in a cylindrical recipient on a tapping apparatus. The general objective is to determine the optimal quantities of each type of powder (grains) that result in the densest packaging. As the elaborated mathematical model assumes spherical grains, the simulations were performed with spheres having three different diameters. The grains are distinguished by their size and classified as fine, medium and coarse. The average diameters correspond to the experimental optimum we determined for real energetic material. The size of the grains is not the only key parameter for the simulations. The initial conditions, the vibration parameters of the tapping process (frequency and amplitude), the diameter ratio between the grains and the cylindrical container (bounding conditions) and the grain number are also considered as important parameters. The simulations are performed in a vertical cylinder closed at the bottom and open at the top. The positions of the grains at the beginning of the simulation constitute the initial conditions. For a good reproducibility, the grains are poured in the cylinder, subjected to gravitation. These conditions simulate the preparation of a mixture in a separated vessel, which is finally poured in the cast recipient. The vibration process would improve the density of grains packaging by temporarily creating space around the grains, allowing the particles to rearrange themselves in an optimal configuration. The parameters of the vibrations have to be correctly determined to avoid segregation. The amplitude and the shape of the vibration wave are similar to the parameters of the tap machine from the Energetic Material Lab of Swiss Defence Procurement Agency. The vibrations are generated by the eccentric rotation of a non-symmetric plate, yielding a typical tapping movement with an amplitude of 3mm and a frequency of 4Hz. Since 1900, it was commonly assumed that the face-centered cubic packaging achieves the highest density. The mathematical proof of this conjecture was brought in 1998 by Hales [13] who used very elaborate modelling and largescale linear programs to show that the highest density, which can be achieved by
spheres packaging in infinite space is equal to π ≈0.74048. The face-centered 18
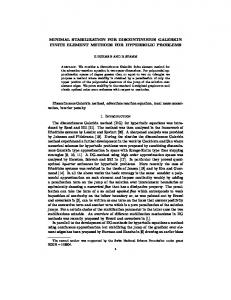
cubic packaging is optimal in an unbounded container. It is expected that the loss of density due to boundary effects decreases when the ratio between the grain size and the container size increases. This has been verified by observing the density reached by packing spheres of radius 1 in a cylinder of diameter D and height H, for various values of D and H. The results are shown in Figure 3-1.
Figure Densities tained by wing the meter of cylindrical tainer.
3-1: obgrodiathe con-
Growing diameter
To check the stability of the program, the first simulations were performed with only a small number of grains, that means about 1'000. Improvements of the simulation method and the use of new computers, allow to work now with approximately 100'000 grains. SIMULATION RESULTS This simulation method gives us the possibility of studying many parameters. Not only the final density, but also many other important parameters during the whole tapping process. These parameters are the average density and its variations, the maximal velocity of the particles and the density per layer. A typical report for a simulation is illustrated in Figure 3-2.
Figure 3-2: A typical simulation results report obtained for the simulation of a mixture constituted with three different spheres (approximately 400 grains) in a cylinder with a 36mm diameter.
The most recent results are summarized in Table 3-1. This simulation method gives us the possibility to vary many parameters independently (grain size(s), number of grains, vibration, …). Very interesting information is obtained due to the snapshots taken during the simulations. For the case 2 (see Table 3-1), for example, at t=1.30s, some small grains are finding their way lower in the assembly, as indicated by the light grey colour, illustrating that the grains are moving among other immobile grains (see Figure 3-3 (left)). For the cases 3 and 4, at t=1.95s, the building of arches is clearly visible (see Figure 3-3 (right)).
Table 3-1:
Summery of the last simulation results Case 1
Case 2
Case 3
Case 4
Case 5
Grain diameter(s) [mm]
2±0.4
2-6 *
4
4
1,4,7
Cylinder diameter [mm]
100
100
100
100
36
Vibration
yes
yes
yes
yes
no
Number of grains
≈90K
≈34K
≈14K
≈10K
8597
Final density [%]
64.02
64.34
60.91
62.70
65.25
* random sizes between 2mm and 6mm
Figure 3-3: Left: case 2 showing how particles are finding their way lower in the assembly. Right: building of arches in simulations Case 3 and Case 4.
4. PARTICLE SHAPES A recent development allows generating non-spherical grains. As the elaborated mathematical model is valid only for spheres, this improvement is achieved by gluing together identical spheres, generating clusters (see Figure 4-1). Cohesive forces, based on a Lennard-Jones potential, enables to keep the cluster together and to introduce a correct compression and shear behaviour. In a near future, it will be possible to perform simulations with such clusters.
Figure 4-1: Some non-spherical grains obtained by gluing together spheres.
5. HOURGLASS EXPERIMENTS The hourglass experiment helps to examine several key phenomena of granular material, such as •
movements and rearrangements of grains in the
upper part as they get closer to the slot •
accumulation of the grains in the lower part, in
particular their rearrangement into a pile. Figure 5-1: Geometry of hourglass
Simulations using different grain sizes, different hourglass shape and grains of two different sizes have been performed. If the slot diameter to grain size ratio is bigger than five (Figure 5-1), then the flow through the slot is regular and nearly independent from time. This important property is crucial for using the hourglass to measure time as used to be the case. If particles of different sizes are used to perform the hourglass experiment the flow becomes much more chaotic (Figure 5-2).
Figure 5-2: Regular and chaotic slot flow velocity according to uniform or bi-modal particle size distribution
Steeper hourglass walls lead to faster slot flow velocities and flatter hourglass walls result in a decreased slot passing velocity. The horizontal interaction forces start to dominate and the probability that some large grains will block the slot increases. But as shown with further hour glass experiments the probability to block the slot is not only dependent on the ratio between particle size and slot diameter but also on initial conditions: A very fast reversal of an hour glass
results with a higher probability in blocking the slot, than creating the initial conditions by a slow reversal.
Figure 5-3: Blocking of hourglass slot due low speed (left) or due to corresponding arrangement of particles (right).
6. CONCLUSIONS A tool for simulation of powder behaviour is available, which is able to handle up to 100'000 grains with a size dispersion of over two orders of magnitude. Grains of different shapes can be considered by gluing spherical shapes together. The attractive forces are described with a Lennard-Jones potential. This approach has the potential to describe also crystal cracking during mechanical treatment of grains, such as vibrating or pouring. The distinct element method (DEM) has the unambiguous advantage that parameters, such as position, velocities and interaction forces can be assessed to each individual particle. This opens the way to describe phenomena like pouring or segregation. On the other hand, parameters, which describe the physical state of an ensemble of grains, such as bulk or tap densities can also be described, if appropriate even layer by layer. Tap density simulations with up to 100'000 particles and with different particle size distributions could be performed. Considering the non-ideal grain size ratios used for these trials, the densities achieved are reasonable. As we could show, the algorithm remains stable for particle sizes over two orders of magnitude. But to conduct tap density experiments with such a wide grain size dispersion, the number of particles needs to be increased again at least by a factor of 150, up to 10'000'000 grains. With aid of hourglass simulations we could show the flow behaviour of bi-modal grain ensembles as being more chaotic than in case of powders with uniform
particles. The probability to block the slot increases, if the passing velocity or the ratio between slot diameter and particle size decreases. It was also shown, that the blocking probability is dependent on conditions how the flow was initialised.
7. LITERATURE [1] [2]
[3]
[4]
[5] [6] [7]
[8]
[9]
[10] [11] [12]
[13]
H. Ritter, S. Braun, M. Schäfer, H.R. Aerni, H.R. Bircher, B. Berger, J. Mathieu, A. Gupta, 32nd Int. Ann. Conf. of ICT, P91 (2001) A.C. van der Steen, H.J. Verbeek, J.J. Meulenbrugge, "Influence of RDX Crystal Shape on the Shock Sensitivity of PBXes", TNO Prins Maurits Laboratory, Rijswijk (NL) J. Meulenbrugge, A. van der Steen, A. van der Heyden, "Crystallisation of energetic materials; the effect on stability, sensitivity and processing properties", TNO Prins Maurits Laboratory, Rijswijk (NL) J. Mathieu, P. Folly, H.R. Bircher, "New Preparation Method for Rounded Compact Crystals", NDIA Insensitive Munitions and Energetic Materials Technology Symposium, 442 (2001) R.J. Farries, Trans. Soc. Rheol. 12, 281 (1968) Y. Jeanfavre, diploma report, Ingenieurschule Wallis (1997) G. C. Barker, Computer simulations of granular materials. In A. Mehta, editor, Granular Matter: An interdisciplinary approach. Springer-Verlag (1994) J.-A., Ferrez, D., Müller, and T. M., Liebling, Dynamic triangulations for granular media simulations. In Mecke, K. R. and Stoyan, D., editors, Statistical Physics and Spatial Statistics, Lecture Notes in Physics. Springer (2000) J.-D., Boissonnat and M., Yvinec, Géométrie Algorithmique. Ediscience (1995). Published in english as Algorithmic Geometry, Cambridge University Press (1998) J.-A., Ferrez, Dynamic Triangulations For Efficient 3D Simulation Of Granular Materials. Thèse N°2432, EPFL (2001) P. A., Cundall and O. D. L., Strack, A discrete numerical model for granular assemblies. Géotechnique, 29(1) (1979) L. Pournin, Th. M. Liebling, and A. Mocellin. A new molecular dynamics force model for better control of energy dissipation in DEM simulations of dense granular media. Phys. Rev. E, 65(1), 11302 (2001) T. C. Hales, the Kepler conjecture. Web page with an overview of the proof and related papers, http://www.math.lsa.umich.edu/~hales/countdowwn/