1953; Spalding, 1958; Zwietering, 1959 was introduced, the concept of local average residence time has been thoroughly. Ž . treated Sandberg, 1981; Sandberg ...
FLUID MECHANICS AND TRANSPORT PHENOMENA
Validating a Prediction Method of Mean Residence Time Spatial Distributions Jean-Noel ¨ Baleo ´ and Pierre Le Cloirec
´ ´ Departement Systemes Energetiques et Environment, Ecole des Mines de Nantes, La Chantrerie, 4 rue Alfred ´ ` ´ Kastler, BP 20722, 44307 Nantes Cedex 3, France Determining residence time is of major interest in the characterization, design or modeling of most chemical engineering processes, where a proper and homogeneous fluid distribution is often essential. A numerical method was used to obtain theoretical predictions of residence time spatial distributions and was ®alidated by comparing with experiments. It was simulated first by sol®ing continuity and momentum conser®ation equations, coupled with turbulence quantity transport equations, using the finite ®olume method. After calculating the flow configuration, the simulation was done by sol®ing the transport equation of a passi®e scalar, the local mean age of the fluid or local mean residence time, which is the a®erage time of a fluid particle to reach any point of the domain from a supply inlet. The result obtained is a spatial distribution of the local mean age of the fluid, which may be displayed as isocontours in the space domain considered. It was compared with measurements of mean residence times of tracers in a reactor to concretely assess the rele®ance of this method.
Introduction The determination of residence-time distributions is of major interest in the design and characterization of most physicochemical and biochemical processes in chemical and environmental engineering, where a proper and homogeneous fluid distribution is often essential. For example, in the domain of wastewater treatment, it is known that the performance of ponds may be affected by problems directly related to the residence time and arising from the hydrodynamic flow pattern, such as short circuiting or dead spaces ŽPolprasert and Bhattarai, 1995.. A good knowledge Žincluding the determination of residence-time distributions . of the flow through a lagoon, an activated sludge basin or a filter, allows to optimize the mass transfer or the degradation of pollution. More generally, in many different processes, the determination of the residence-time distribution is required in order to design the optimal geometry of the reactor or to calculate the yield of the reactions with kinetic parameters ŽWen and Fan, 1975; Levenspiel, 1999.. This concerns most chemical and environmental engineering applications, such as petro-
Correspondence concerning this article should be addressed to J.-N. Baleo. ´
AIChE Journal
leum engineering, mineral processing, and water treatment ŽThereska, 1998., but also food, biological, or pharmaceutical engineering applications. The objective of this article is to present a modeling approach which provides information about the spatial distribution of the mean residence time, and to assess if the predictions of this model are relevant by comparing numerical and experimental results. Solving conservation Žmass and momentum. and possibly coupled transport equations linked to the turbulent nature of the flow provides, using classical computational fluid dynamics ŽCFD. techniques such as the finite volume method, the spatial distribution of relevant variables which describe the basic flow. Once these variables have been determined, a decoupled approach may be used in order to determine the spatial distribution of the mean residence time. This approach consists of solving the steady transport equation of a passive scalar, the local mean age of the fluid, or local mean residence time, which is the average time that a fluid particle takes to reach any point of the domain from a supply inlet. This scalar incorporates the time linked to the movement due to laminar and possibly turbulent diffusion.
April 2000 Vol. 46, No. 4
675
The result obtained is a spatial distribution of the local mean age of the fluid, which may be displayed as isocontours in the space domain considered. The determination of zones wherein the mean residence time is greater than in the vicinity enables modifications in the design of the geometry to be made in order to reduce the dispersion of the residence time. Different simulations of mean residence time spatial distributions have been already performed in complex geometries using the finite volume method ŽDavidson and Olsson, 1987; Matsumoto and Kato, 1992. and the finite-element method ŽBeaudoing and Berne, 1998.. For Davidson and Olsson Ž1987., as well as for Matsumoto and Kato Ž1992., the results are in approximate agreement with experimental values, and the discrepancy is expected to be caused by the error in the velocity field determination. For Beaudoing and Berne Ž1995., the simulations were not considered to be predictive. In this article, a comparison to measurements of mean residence times of tracers in a bidimensional geometry using a pulse experiment is finally given in order to assess and establish the practical relevance of this method.
Physical Model The fluid mechanics core model basically consists of steady-state mass ŽEq. 1. and momentum ŽEq. 2. conservation equations for an incompressible fluid
ui xi r
xj
Ž u i u j . sy
p xi
q
t i j xj
s0
Ž1.
q r g i q Fi q
xj
Ž ruXi uXj .
Ž2.
and possibly turbulence quantity transport equations if the flow is not laminar, that is, if the last term on the righthand side of Eq. 2 is not equal to zero. In turbulent flows, the velocity at a point is assumed as the sum of the mean Žtime-averaged. and fluctuating components: u i s u i q uXi . In Eq. 2, the overbar stands for a timeaveraged process and it has been dropped on the mean velocity components u i in order to avoid the heaviness of the mathematical expressions, as is usually done. In Eqs. 1 and 2 r is the fluid density, u i is the velocity component in the x i direction, p is the pressure, t i j is the viscous stress tensor, g i is the gravitational acceleration in the i direction, and Fi is a possible body force component in the i direction. If the flow is not laminar, the introduction of the term ruXi uXj, the time averaged product of the fluctuating velocity components, which represents the so-called Reynolds stresses, related to the mean flow by the so-called Boussinesq hypothesis
ui u j 2 ui 2 ruXi uXjs r k d i j y m t q q mt d 3 x j xi 3 xi i j
ž
/
Ž3.
necessitates the determination of additional turbulence quantities, which, when using a second-order closure model, for instance, the classical k y e model, are respectively, the tur676
bulent kinetic energy k and the dissipation rate e
r
xi
Ž ui k . s
xi
ž
uq
mt
k
/
sk
xi
q mt
r
xi
Ž ui e . s
xi
ž
mq
mt se
/
ž
ui xj
e xi q
uj
q
xi e
mt
qC1 e
k
uj
uj
xi
/
xi
/ ž
uj xi
y re
Ž4.
ui xj
yC2 e r
e2 k
Ž5.
The turbulent viscosity m t , related to k and e , is given by
m t s r Cm
k2
Ž6.
e
In Eq. 3, d i j is the Kronecker symbol. The coefficients C1 e , C2 e , Cm , s k and se are empirically determined constants Žsee, for example, Patel et al., 1985. C1 e s1.44; C2 e s1.92; Cm s 0.09; s k s1; se s1.3. For a laminar motion, Eqs. 1 and 2 only with ruXi uXjs 0 define the deterministic system to be solved, while, for a turbulent motion, the closed system to be solved consists of Eqs. 1 to 6. Since the concept of the average age of fluid ŽDanckwerts, 1953; Spalding, 1958; Zwietering, 1959. was introduced, the concept of local average residence time has been thoroughly treated ŽSandberg, 1981; Sandberg and Sjoberg, 1983.. ¨ This variable represents physically at a given point the time that has elapsed on average since the particle of fluid, which is located at this point, entered the domain at one of its inlets. It can be measured experimentally at any point of the domain, for example, by injecting a pulse of tracer gas into the inlet at time t s 0 and by recording continuously the concentration of the tracer gas at the point under consideration. Its distribution function ft is defined by ft s
CŽ™ x, t .
Ž7.
H0`C Ž ™ x, t . dt
where C Ž ™ x, t . is the concentration of a tracer injected into a domain inlet at a point ™ x at time t. The local average residence time t is the first moment of ft and can be defined as
t Ž™ x.s
H0`C Ž ™ x, t . tdt
Ž8.
H0`C Ž ™ x, t . dt
A steady-state solution of this variable may be obtained directly from a transport equation derived by Sandberg Ž1981., and may be rewritten as
r
April 2000 Vol. 46, No. 4
xi
Ž u it . s
xi
ž
DA A q
mt st
/
t xi
qr
Ž9.
AIChE Journal
where DA A qŽ m tr t . is an estimation of the local actual diffusivity, wherein DA A is the self-diffusivity of the fluid, which is the diffusivity of the fluid in itself, and which may be expressed by the ratio mrs , where s is the laminar Schmidt number and st is the turbulent Schmidt number. The ratio m trst equals zero in the absence of turbulence. This last transport equation is written using a formalism which is very similar to that of Eqs. 4 or 5, that is, the lefthand side stands for the convection term, the first term on the righthand side stands for the diffusion term, and the last term stands for the source of the variable under consideration. Consequently, a similar resolution method may be used. The relationships derived in this section only hold exactly if the following conditions are fulfilled: v The flow is steady and the fluid is incompressible; v There is no diffusion against the convective flow in the inlet section, therefore, the residence time in a point upstream of the injection is zero; the inlet section is small compared to the characteristic dimensions of the geometry; and v The flow is ‘‘deterministic’’ in the sense that there is no random process at a large space or time scale, such as the unsteady creation of vortices. Nevertheless, rapid random processes due to turbulence, and steady in average, may be considered as ‘‘quasi-deterministic’’ and do not constitute a limitation to the application of the model. These conditions also constitute requirements for the validity of the analysis of the pulse experiment, which is conducted for the assessment of the simulation results. In the analysis leading to Eq. 9, the movement of the tracer from which the scalar t can be calculated incorporates necessarily both diffusion and convection. Hence, thanks to the diffusion term, this scalar remains bounded in the domain. The theory underlying this equation supposes that the streamline passing at a point is open, that is, it is connected to an inlet and an outlet. In the case of flows without inlets, the average residence time is undetermined or unbounded and has no meaning. In the case of flows with an inlet and an outlet, but with recirculation regions, the average residence time incorporates the duration of the movement across the streamlines. These actually are not closed, since diffusive transport is always allowed. However, in complex flows, it is not possible to separate the value of the mean residence time at a point as the sum of the two contributions of convection and diffusion. One may just expect that, in general, the convective contribution will be dominant while diffusive transport of t should only be detected at wall boundaries and possibly at the center of recirculation regions. Different methods of simulation of mean residence time spatial distributions have been already used elsewhere in complex tridimensional geometries using the finite volume method ŽDavidson and Olsson, 1987; Matsumoto and Kato 1992. or the finite-element method ŽBeaudoing and Berne, 1998., but the results were not generally considered to be satisfactorily predictive, especially for Beaudoing and Berne. For Davidson and Olsson Ž1987. as well as for Matsumoto and Kato Ž1992., the discrepancy between simulations and experiments was expected to be essentially caused by the error in the velocity field determination. Boundary conditions for t are needed in order to solve Eq. 9. The frame of this partial differential equation does not provide any clear guideline for the setting of appropriate AIChE Journal
boundary conditions at walls. In the case of plug flow in the x direction with a constant velocity U, that is, if the diffusion of the scalar t and of the momentum equals zero, then t Ž x . s xrU and tr y s 0, even at walls. This last expression is, thus, in this case a suitable boundary condition. The case for which the diffusion coefficient would be equal to zero while the viscosity would not be Žthat is, an infinite Schmidt number. is physically meaningless, and leads to unbounded values for t at the walls. In the case of mixed flows, for which dispersion and momentum diffusion may not be neglected, the velocity vanishes at solid boundaries, but the mean residence time t remains bounded because of the presence of the diffusion term in Eq. 9. For the cases considered in this study, the flow is rather close to plug flow, in the sense that the transport of t is expected to be rather dominated by convection. Hence, in the absence of clear boundary conditions at the walls, the plug-flow boundary condition tr y s 0 is assumed to be the more suitable, and is imposed at wall boundaries. The same condition is used by all the authors cited in the previous paragraph. Nevertheless, it is clear that this boundary condition limits the interpretation of t on the solid boundary, which becomes a limit for the minimum value of the very local residence time, rather than the mean residence time itself. The influence of this boundary condition on the value of t on the boundary is investigated numerically in the following section as a function of the value of the diffusion coefficient.
Numerical Method The set of partial differential equations is solved using the finite volume discretization method, which is appropriate for solving sets of conservation equations written using the following formalism = Ž r™ ®F . s= Ž G=F . q SF
Ž 10 .
where F is the scalar under consideration, G is the diffusion coefficient, ™ ® is the velocity vector, = is the gradient operator, and SF is a source or sink term. Use is made of the Fluent commercial software package, which is based on the SIMPLE algorithm ŽPatankar, 1980. with interpolation on cell faces Župwind scheme for density; momentum weighted for pressure and linear for velocity.. The classical power law scheme ŽPatankar, 1980. is used as the differentiating scheme. A multigrid algorithm accelerates convergence for the calculation of pressure and the resolution of the transport equation of the mean residence time. Both a laminar plug flow and a simple shear Poiseuille laminar flow in a tube have been simulated in two dimensions in order to validate the implementation of the calculation of the transport of the mean residence time in the CFD software. In these two test cases, the flow is unidirectional Žno radial velocity component.. In the first case, numerical results were in perfect agreement with the expected theoretical solution: t Ž z . s zrU, where U is the mean flow velocity and z is the axial space coordinate. Considering the second test case, the velocity field is given by uŽ r . s 2U w1yŽ rrR . 2 x, where u is the axial velocity component, R is the tube radius, and r is the radial space coordinate. In the absence of lami-
April 2000 Vol. 46, No. 4
677
pears anyway as the most suitable, even if it limits very locally Žat walls only. the interpretation of the signification of the scalar t .
Numerical Simulation of a Test Case
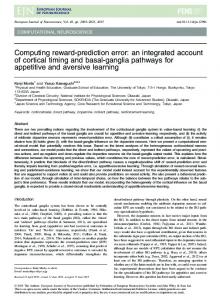
Figure 1. Mean residence time as a function of the space coordinate r in the simple shear flow test case.
nar diffusion, the theoretical residence time is given by the following analytical relation: t Ž r, z . s zruŽ r . s R 2 zr w2U Ž R 2 y r 2 .x. This case is physically meaningless since it involves a fluid with an infinite Schmidt number, but its analysis provides an interesting insight as to the link between the scalar t and the actual residence time at walls. This theoretical profile indicates that t Ž r, z . should go to infinity as the wall is approached Ž r ™ R .. The computation of this analytical curve Žtruncated near the wall. and of calculated profiles of t Ž r . are given in Figure 1 for different values of DA A Žthere is no turbulent diffusion.. The tube radius R equals 1, the mean flow velocity U equals 1, and the profiles are displayed for z s 5. The theoretical expression for t is thus t Ž r . s 5rw2Ž1y r 2 .x. Three cases have been computed: DA A s1.866=10y5 m2 ? sy1 , which is the actual self-diffusivity of air Žsee the next section., DA A s10y2 m2 ? sy1 , and DA A s1 m2 ? sy1. The grid contains 402=42 cells. In Figure 1, the radial coordinate varies from zero Žcenter of the tube. to 1 Žradius of the tube.. When diffusion is weak, the effect of the boundary condition is obviously to bound artificially the value of t at the wall. In such a case, the value of t at the wall is not actually equal to the mean residence time, but rather to a limit of its minimum. When, on the contrary, the diffusion effects are important, t remains naturally bounded at the walls and the zero flux condition appears as the appropriate boundary condition Žsee the numerical profile for DA A s1 in Figure 1.. Hence, this condition appears as being the most suitable condition for both kinds of limit flows: the plug flow Žno diffusion. and the diffusion dominated flow. In intermediate flows Žsee, for instance, the real DA A and DA A s10y2 m2 ? sy1 profiles in Figure 1., this boundary condition is quite artificial, but ap-
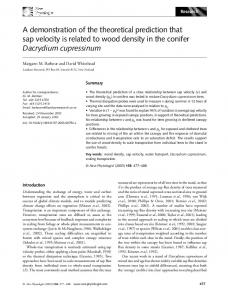
Figure 2. Outline of the simulation domain. 678
The test case geometry is a bidimensional axisymmetric duct. The outline of the geometry is displayed in Figure 2, wherein the whole duct is represented even though the numerical domain considers, of course, only half of the geometry, which is bounded by a symmetry axis. The fluid enters the domain on the lefthand side and exits on the righthand side. The pipe contains in its middle three annular obstacles Žsee Figure 2 and the detailed view in Figure 3., which create four toroidal recirculations upstream and downstream. This specific geometry was designed in order to generate a complex flow with important streamline curvature and toroidal recirculation zones, wherein the local mean residence time should present a significant gradient. The design is a compromise between simplicity Žneeded both of the numerical prediction of the flow field, as well as for the experimental measurements to be as accurate as possible. and the need for the presence of zones wherein the velocity magnitude vanishes in order for the transport of the scalar t to the essentially diffusive therein. Such a bidimensional geometry with these obstacles meets all these requirements. The objective of this article is to assess the validity of a method of prediction. This had to be performed in a particular and appropriate geometry. Once validated, this method may be used in real three-dimensional complex industrial geometries such as stirred tanks Žprovided however that the CFD prediction of the flow is accurately calculated .. The maximum physical dimensions are 2.696 m for the length of the duct and 20=10y3 m for its radius. The corresponding grid contains 623=42 cells. The inlet diameter Din equals 15.4=10y3 m. The fluid considered is the air. The volumetric flow rate is equal to 0.5 m3 per hour Ž1.389 =10y4 m3 ? sy1 .. The Reynolds number, based on the reference length Din and velocity Uin at the inlet ŽUin s 0.74565 m ? sy1 ., equals 864, and the flow is considered as moderately turbulent. Use is made of the RNG based k y e engineering turbulence model ŽYakhot and Orszag, 1986., which is supposed to be more appropriate than the basic k y e model in the case of weakly turbulent flows and flows with streamline curvature Žsince low-Reynolds number effects are included in the RNG theory.. Indeed, the assessment of the relevance of the calculation of the transport of t is appropriate only if the
Figure 3. Zone containing the annular obstacles.
April 2000 Vol. 46, No. 4
AIChE Journal
Figure 4. Streamlines.
flow field is properly calculated first. In this particular geometry, the RNG based k - E turbulence model is expected to provide a more accurate prediction of the flow field and that is why it is used instead of the basic k - E model. The flow is steady and isothermal and the fluid is incompressible. The boundary conditions applied to the domain are the following: At the flow inlet, the axial velocity V,, equals 0.74565 m-s-', the turbulence intensity I equals 596, and the mean residence time is set to zero. The inlet boundary conditions for k and E are respectively kin = 3/2 (I&,)' and = Crkr/Din; At the flow outlet, the radial velocity component u, equals zero and the diffusion fluxes of T in the direction normal to the exit are assumed to be zero: On the centerline axis, a@/&- = 0 where r is the radial coordinate and Q, stands for the velocity components, turbulence quantities and mean residence time; On the walls, the velocity components and the flux of mean residence time are set to zero. Two-layer based nonequilibrium wall functions are used to derive boundary conditions for k and E on walls.
As expected and clearly shown in Figure 4, the flow is fully developed upstream of the first obstacle, and the three annular obstacles generate four toroidal recirculations. Only the main recirculations, situated into the zones confined by the obstacles, are visible in Figure 4,even though a small one is also located in the vicinity of the comer upstream of the first obstacle. The last recirculation, downstream of the last obstacle, is very long. The filled contours of the isovalues of the mean residence time are displayed in Figure 5. These values refer to the absolute time, that is, the average time that a fluid particle takes to reach the considered point of the domain from the supply inlet. The diffusion coefficient DAA+( p&,) of Eq. 9 contains a parameter a, which is the turbulent Schmidt number. As usual, its value is set to unity, that is, it is expected that the turbulent diffusion coefficient of momentum equals the turbulent coefficient of mass diffusion. Therefore, the model does not contain any adjustable parameter, since DAA or a or DAB are measurable fluid or tracer physical properties, and since a, is fixed in the following to be equal to unity. These parameters are to be seen as intrinsic properties of the system investigated, and the purpose is not to calculate them in order to optimize the accuracy of the CFD computation. In the case of turbulent flows, the magnitude and the distribution of the local mean residence time is controlled rather by the mechanism of turbulent diffusion than by the term corresponding to the molecular self-diffusion or to the tracer diffusion into the gas. Two cases have been simulated. The first one considers the molecular diffusion of the fluid in itself (using the coefficient of self-diffusion DAA= 1.866X lo-' m2-s-'), while the second one considers the diffusion of a tracer into the fluid (using the classical coefficient of diffusion DAB= 9.185 X mzs - ' of the component A in the fluid B, see the next section).
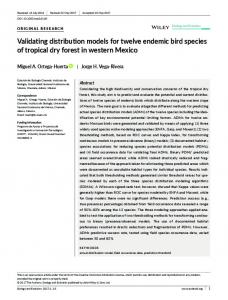
Figure 5. Calculated spatial distribution of the mean residence time.
AIChE Journal
April 2000 Vol. 46, No. 4
679
The objective of the method is to evaluate the spatial distribution of the mean residence time in the case of a single fluid flow, even if it can be naturally extended to two fluids. Since a tracer is needed in the experiments to evaluate t , one must replace DA A by DA B , which is the diffusivity of the tracer into the fluid Žthat is, the diffusivity of butane in air in this case., in Eq. 9. These values are physical properties of the fluids under consideration ŽReid et al., 1987. and must not be considered as parameters of the model that could be arbitrarily chosen. The use of these two coefficients reflects physical phenomena Žself-diffusion of air in itself and diffusion of butane in air. and is not to be related to an investigation of the influence of the diffusion coefficient in the transport mechanism of the scalar t . In Figure 5, which refers to the transport of the tracer in the gas, the mean residence time ranges from 10.16 s Ždark blue. to 19.81 s Žred.. The maximum is obtained at the right corner of the last obstacle, while the minimum is naturally situated at the centerline upstream point. In the simulations of the spatial distribution of the pure fluid itself, these values range from 10.27 s Ždark blue. to 19.52 s. The difference in the spatial distributions is very weak. The turbulent transport of the mean residence time is practically identical. The scalar is transported both by convection and diffusion. Convection is the dominant mechanism of advection in the vicinity of the centerline, while turbulent diffusion controls the transport of the mean residence time near and into the flow recirculations, wherein the velocity magnitude vanishes. Transport by convection is naturally much more efficient than transport by diffusion. The radial transport of the scalar used to derive the mean residence time is essentially diffusive, and, thus, important radial gradients of this scalar are obtained in the vicinity of the corners in the expansion areas of the flow. Consequently, the magnitude of the scalar t increases considerably locally and reaches its maximum value in these zones, wherein the transport by diffusion dominates.
Assessment by Comparison with Experiments An experimental device corresponding exactly to the geometry and flow conditions used in the previous simulations was designed in order to assess and validate the numerical method of prediction of the mean residence time. An instantaneous tracer injection method Žduring two seconds. was used in order to determine the local mean age of the gas, which is air, using the so-called pulse experiment ŽLevenspiel, 1999.. An arbitrary closed pulse signal is used. The shape of the pulse is not critical as long as it starts from zero at time zero and assumes finite values for a finite length of time, and returns to zero. The general approach is to purposely excite the flow in the reactor, which is considered as a system ŽDanckwerts, 1953., and to extract information on the residence time distribution by appropriate concentration measurements. The tracer is injected into the system in a pulse manner and the response, at a point of the domain, also appears as a pulse. The methods of analysis of this experiment are extensively described in Wen and Fan Ž1975. and in Levenspiel Ž1999.. A tracer gas, butane, was injected from a 2,000 ppm gas vessel at the entrance of the domain. The diffusion coeffi680
Figure 6. Experimental device geometry.
cient of butane in air at ambient temperature equals 9.185= 10y6 m2 ? sy1 ŽReid et al., 1987.. The experimental apparatus is described in Figure 6. The concentration of the tracer gas was measured simultaneously at a point situated on the centerline upstream of the zone of measurements and at another point in the zone of measurements, corresponding to a profile ranging from 1 to 20 Žsee Figure 6.. This method Žsimultaneous measurements . was initially developed by Aris Žsee, for instance, Aris, 1969.. The number of measurement points per profile equals 5 when the inner radius equals 20 mm Žpoints situated respectively at a radius of 0, 5, 10, 15 and 19 mm from the centerline. or equals 3 when the inner radius equals 8 mm Žpoints situated, respectively, at a radius of 0, 5 and 7 mm from the centerline .. The mean residence time tr obtained for a measurement point is relative in the sense that it is the difference between the absolute mean residence times of the different downstream and the upstream measurement points. It is given by Žsee, for instance, Wen and Fan, 1975; Levenspiel, 1999.
tr s
H0`tCup dt H0` Cup dt
y
H0`tCdown dt H0` Cdown dt
Ž 11.
where Cup and Cdown are, respectively, the instantaneous concentrations at time t at the upstream and at one of the downstream measurement points. The concentration measurements were performed continuously using a flame ionization detector ŽCambustion HFR 400 FFID. at the downstream and the upstream points with a record every second. For this experiment, a calculation of the so-called vessel dispersion number DA ArŽ2UR . ŽLevenspiel, 1999., where R is the tube radius, shows that it is smaller than 0.01, and, thus, that convective transport globally dominates. In such a case, the influence of the boundary condition at the point under consideration during the measurements, that is, its actual difference from the closed vessel boundary condition, is expected to be small ŽLevenspiel, 1999.. For the conditions fulfilled by this experiment, therefore, the first moment of
April 2000 Vol. 46, No. 4
AIChE Journal
Figure 7. Reproducibility of mean residence time measurements.
the quantity, which is actually a response time, is expected to be equal to the mean residence time. It is rather the second moment Žthe variance. of the residence time distribution that is affected by the presence of mixed boundary conditions Žclosed boundary condition at the inlet and open boundary condition at the point under consideration .. Nevertheless, the validity of the method vanishes when the vessel dispersion number is greater than one ŽLevenspiel, 1999.. In the present case, this condition is fulfilled in zones wherein the velocity magnitude is smaller than 2.3=10y4 m ? sy1. These zones, which have been determined by CFD for the example under consideration, are composed of points Žcenter of recirculations. and segments Žthe very thin boundary layers.. The criterion DA ArŽ2UR . -1 can thus be considered as fulfilled in the entire domain. The measurements are satisfactorily reproducible. See, for example, the four independent records corresponding to the 12th profile displayed in Figure 7. The experimental preci-
Figure 8. Comparison of calculated and measured mean residence times in the vicinity of the wall. AIChE Journal
Figure 9. Measured and calculated mean residence times as a function of the tube radius.
April 2000 Vol. 46, No. 4
681
Figure 10. Measured spatial distributionof the mean residence time.
sion of the device, obtained from repeated mcasurcmcnt of the point of maximum mean residence time, was cvaluatcd as 5%. Finally, the turbulent nature of the flow was checked on the experimental device using a Laser Dopplcr anemometer. The numerical prediction is assessed by: Comparing the profiles obtained ncar the inner radius boundary (Figure 8) Comparing four typical radial profiles (Figure 9), the first and last (profiles 1 and 201, the 7th radial profile (into the expansion), and the 12th profile (downstream of the last corner, where the maximum value is obtained) Comparing the numerical predictions (Figure 5 ) and experimental measurements (Figure 10) of the spatial distribution of the mean residence time. The profiles (Figures 8 and 9) are given in relative mean residence time, while the spatial distributions (Figures 5 and 10) refer to the absolute mean residence time. The maximum discrepancy obtained in the whole geometry between predicted and measured values is for the inner radius boundary point on the last profile, and is observable in Figure 8, wherein it is the last point on the righthand side (the difference in absolute value equals 0.88 s). The prcdiction of the mean residence time in the flow expansions and at the entrance and exhaust corners are extremely accurate. However, the prediction is slightly less precise for the points distant from these two corners, especially in the area of the downstream recirculation, but this is more probably due to a lack of accuracy in the determination of the actual flow configuration by the turbulence model, which is more perceptible in zones wherein the transport of the scalar T is mainly governed by diffusion. The radial profiles of mean residence time can be classified according to the magnitude of the gradient. This gradient is due both to the radial gradient of axial velocity (the scalar is convected at a velocity that decreases going from the centerline to the wall boundary) and to a mechanism of diffusion. In the first profile, the gradient of mean residence time essentially follows the gradient of axial velocity. For the 7th profile, particularly the 12th profile, and slightly less for the last profile, the contribution of the velocity to the transport of the scalar vanishes far from the centerline. The transport becomes locally essentially diffusive and, consequently, the radial gradient of mean residence time increases. The simulations perfectly predict this phenomenon (see the last three points of profiles 7 and 12). 682
The predicted and measured spatial distributions (Figures 5 and 10) are very close. In Figure 10, the relative mean residence time ranges from 0.843 s (in dark blue) to 10.706 s (in red). These values, when corrected by the addition of the absolute mean residence time of the upstream measurement point, correspond to absolute values ranging from 9.985 s and 19.847 s. The calculations lead to absolute values ranging from 10.16 s to 19.81 s. It is obvious that the predicted and measured extreme values are very close. The spatial distribution is globally very similar. The discrepancies are attributable rather by the weak number of measurement points preventing a smooth interpolation of the experimental isovalues than by the actual differences. For instance, the tiny zones appearing in Figure 10 in dark blue and situated on the righthand side corners between the obstacles do not correspond to actual measured values, but appear artificially in such a color because the number of discretization points is locally insufficient. These tiny zones must not be considered in the comparison. The location of the zone situated at the corner of the last expansion wherein the mean residence time transported by diffusion is maximum, is perfectly predicted.
Conclusions A transport of the conservation equation of the mean residence time was solved with the finite volume method and using a computational fluid dynamics (CFD) commercial software (Fluent) that was modified and recompiled. The spatial distribution of the mean residence time was predicted in a complex turbulent axisymmetric flow containing expansions and contractions, and was compared with experimental measurements obtained with a pulse injection method using butane as tracer gas. It was found that, provided the turbulence model enables a good estimation of the velocity field to be obtained, the model of determination of the mean residence time and its simulations predict the experimental results very well, even though the only parameter of the model, the turbulent Schmidt number, was not optimized in order for the experimental and numerical values to coincide, but was set at unity. Therefore, it is possible that the discrepancies obtained by several authors are more attributable to a lack of precision in the simulation of the flow itself than to the calculation of the passive scalar. The feasibility of accurately predicting the spatial distribution of such a variable, considering its importance in the field ’ of chemical, pharmaceutical, food and environmental engi-
April 2000 Vol. 46, No. 4
AIChE Journal
neering, is of great potential, and should be considered in the design of installations and vessels where a homogeneous fluid distribution is essential. This method of simulation provides the instantaneous determination of the geometric characteristics of a flow boundary that contribute to the dispersion of the mean residence time, and its appropriate use should prevent undesirable phenomena, such as short circuiting and dead spaces.
Acknowledgments The author would like to thank Mr. Philippe Humeau for his valuable contribution to the experimental measurements and Mr. Yvan Gouriou for the construction of the experimental device.
Literature Cited Aris, R., Elementary Chemical Reactor Analysis, Prentice Hall, Englewood Cliffs, NJ Ž1969.. ´ Beaudoing, G., and Ph. Berne, ‘‘Caracterisation d’Ecoulement dans ´ un Melangeur par Trac¸ages et Modelisation,’’ Recents Progres ´ ´ ´ ` en Genie ´ des Procedes, ´ ´ 12, 225 Ž1998.. Danckwerts, P. V., ‘‘Continuous Flow Systems. Distributions of Residence Times,’’ Chem. Eng. Sci., 2, 1 Ž1953.. Davidson, L., and E. Olsson, ‘‘Calculation of Age and Local Purging Flow Rate in Rooms,’’ Bldg. En®ir., 22, 111 Ž1987.. Levenspiel, O., Chemical Reaction Engineering, 3rd ed., Wiley, NewYork Ž1999..
AIChE Journal
Matsumoto, H., and M. Kato, ‘‘A Numerical Method for Predicting Age of Air in Rooms,’’ Proc. of Int. Symp. on Room Air Con®ection and Ventilation Effecti®eness, University of Tokyo, 339 ŽJuly 22-24, 1992.. Patankar, S. V., Numerical Heat Transfer and Fluid Flow, Hemisphere Publishing Corp., Washington, DC Ž1980.. Patel, C., W. Rodi, and G. Sheuerer, ‘‘Turbulence Models for Near Wall and Low Reynolds Number Flows: a Review,’’ AAIA J., 23, 1308 Ž1985.. Polprasert, C., and K. K. Bhattarai, ‘‘Dispersion Model for Waste Stabilization Ponds,’’ J. En®iron. Eng. Di®., 111, EE1, 45 Ž1995.. Reid, R. C., J. M. Prausnitz, and B. E. Poling, The Properties of Gases and Liquids, 4th ed., McGraw Hill, New York Ž1987.. Sandberg, M., ‘‘What is Ventilation Efficiency?,’’ Bldg. En®ir., 16, 123 Ž1981.. Sandberg, M., and M. Sjoberg, ‘‘The Use of Moments for Assessing ¨ Air Quality, Bldg. En®ir., 18, 181 Ž1983.. Spalding, D. B., ‘‘A Note on Mean Residence-Times in Steady Flows of Arbitrary Complexity,’’ Chem. Eng. Sci., 9, 74 Ž1958.. Thereska, J., ‘‘L’Application des Radiotraceurs dans les Unites ´ Industrielles. Bilan et Perspective,’’ Recents Progres ´ ` en Genie ´ des Procedes, ´ ´ 12, 1 Ž1998.. Wen, C. Y., and L. T. Fan, Models for Flow Systems and Chemical Reactors, Marcel Dekker, New York Ž1975.. Yakhot, V., and A. Orszag, ‘‘Renormalisation Group Analysis of Turbulence. I. Basic Theory,’’ J. Scientific Comp., 1, 3 Ž1986.. Zwietering, T. N., ‘‘The Degree of Mixing in Continuous Flow Systems,’’ Chem. Eng. Sci., 11, 1 Ž1959.. Manuscript recei®ed June 29, 1999, and re®ision recei®ed No®. 15, 1999.
April 2000 Vol. 46, No. 4
683