doi:10.1017/S1368980012001243
Public Health Nutrition: page 1 of 9
Validation and extension of a simple questionnaire to assess physical activity in pre-school children Otmar Bayer1,*, Marc Jarczok2, Joachim Fischer2, Ru¨diger von Kries1 and Freia De Bock2,3 1
Institute for Social Paediatrics and Adolescent Medicine, Ludwig-Maximilians University of Munich, Heiglhofstrasse 63, D-81377 Munich, Germany: 2Mannheim Institute of Public Health, Social and Preventive Medicine, Medical Faculty Mannheim, Heidelberg University, Mannheim, Germany: 3Children’s Hospital, University Medicine Mannheim, Medical Faculty Mannheim, Heidelberg University, Mannheim, Germany
Public Health Nutrition
Submitted 3 June 2011: Final revision received 7 February 2012: Accepted 24 February 2012
Abstract Objective: To (i) validate a recently proposed questionnaire tool for the simple assessment of physical activity (PA) in pre-school children by comparison with accelerometry and heart-rate recordings; and (ii) extend the tool by adding more questions to improve validity and to refine the classification from two to three categories (PA low, medium, high). Setting: Baseline data of an intervention evaluation study. Subjects: Pre-school children. Design: Children were categorized as either physically active or non-active, based on their parents’ answers to the five-item questionnaire. Activity and heart rate were recorded for 6 d (Actiheart device; CamNtech, Cambridge, UK). Nightly sleeping periods were removed and mean accelerometry counts (MACT), time spent in moderate-to-vigorous intensity physical activity (MVPA) and time spent in sedentary behaviour (SB) were computed. In a second step, additional questions that improved validity were added, resulting in an extended seven-item questionnaire. Results: For 748 (90?4 %) of the participating children aged 2?3–6?7 years, the questionnaires were filled out sufficiently for classification. Children classified as physically active showed 9?6 % higher MACT (P , 0?0003), spent more time in MVPA and insignificantly less time in SB. Using the extended questionnaire, children with PA classified as medium (reference: low) showed 11?0 % more MACT, spent 11?8 % more time in MVPA and 4?8 % less time in SB. Children with PA classified as high showed 16?9 % more MACT, spent 20?2 % more time in MVPA and 7?2 % less time in SB. Conclusions: With validated PA questionnaires for pre-school children lacking, the proposed questionnaire might be a reasonable option to include for PA assessment in epidemiological studies where more elaborate measurements are unavailable.
With increasing prevalences of childhood and adolescent obesity, physical activity (PA) and sedentary behaviour (SB) at an early age have gained scientific attention. Evidence suggests that inactivity and low levels of habitual PA in young childhood are linked to several health outcomes(1), such as overweight(2–4), metabolic risk factors for CVD(5,6) and bone health(7), in both older childhood and adolescence. As accurate measurement of PA in children still represents a major challenge, documentation of the frequency and distribution of PA in defined population groups like young children remains difficult, despite being a key factor of lifestyle evaluation and control. Guidelines for 3- to 5-year-old children recommend a minimum of 2–3 h of PA daily (ranging from light to moderate-to-vigorous intensity PA (MVPA) and consisting of structured and unstructured activities), whereas for children aged *Corresponding author: Email
[email protected]
Keywords Accelerometer Heart-rate recording Actiheart Sleep period Moderate-to-vigorous intensity physical activity Sedentary behaviour
between 5 and 12 years, recommendations change to at least 60 min of MVPA/d(8,9). PA in young children can be measured by either indirect methods (such as questionnaires and diaries for parents) or direct methods (like direct observation or direct monitoring of the children’s movements, e.g. using accelerometers). In recent years, objective measurement of PA using accelerometers(10) has revealed high validity and reliability under both laboratory and field conditions(11–13), and represents an easy-to-use method particularly for assessing PA in free-living individuals. Most accelerometers are piezoelectric sensors that detect acceleration in one to three orthogonal planes(14), providing information on the frequency, intensity and duration of PA and only minimally interfering with children’s PA behaviour(15). Some recently developed instruments r The Authors 2012
Public Health Nutrition
2
combine accelerometry with monitoring of heart rate (a direct measure of PA itself) to increase accuracy of PA measurement(16). Although direct PA measures generally have higher reliability, they result in considerably more effort for data analysis and interpretation (also with respect to comparability of raw data between different accelerometry devices) than indirect methods. Accelerometer-based assessment of preschool children’s PA requires children’s continuous wearing compliance, researchers’ experience(17), and includes acquisition costs. In contrast, indirect PA measures are widely used and easy to administer in larger-scale (e.g. national) studies. While several PA surveys are available for adults and adolescents, only a few have been validated for preschool age. Most of them show low to moderate correlations with direct measures of PA in smaller convenience samples(18–20). With early childhood behaviours being key factors for later health outcomes, accurate, easy-toadminister and extensively available PA assessment tools for pre-school children would help to document risks and intervention success on a population level. There are different types of questionnaires: prospective diaries or recall, estimates of time spent outside or time and frequency in high PA, and lists of activities (e.g. sports). Generally, the accuracy of indirect measurement tools increases with children’s age and might be higher if based upon children’s own accounts than if based on proxy reports(21–23). However, scientific evidence suggests that self-reports are unreliable in early childhood years(24). Therefore, when focusing on young children, researchers have to rely on surrogate reports by parents, which in turn also suffer from limited validity(25). When establishing new survey instruments assessing young children’s PA, survey results therefore should be validated against direct and objective PA measurements serving as a reference method. In the present study, we compare the results of young children’s PA ratings based upon a survey instrument against combined accelerometry and heart-rate recordings. The survey instrument used is a recently proposed assessment tool which relies on parental proxy report and has been shown to correlate with overweight, obesity and motor test results in pre-school children(26). We additionally aim to elaborate and refine the existing questionnaire-based classification of PA by means of the objectively measured PA data.
Methods Setting and participants Our study used cross-sectional baseline data from a cluster-randomized trial set in the German federal state of Baden-Wu¨rttemberg evaluating a state-sponsored PA intervention (www.gesunde-kinder-bw.de). Pre-schools that were located in three distinct regions and had formally
O Bayer et al.
applied for participation in the state-sponsored programme were considered eligible. Sites were excluded if they had less than fifteen children participating or there was no external PA teacher available in the local area. For the present study, data from fifty-five pre-schools were available. Children between 3 and 6 years of age were eligible. Children with severe atopic dermatitis, any serious physical malformations or disabilities or a serious acute infectious disease (e.g. severe diarrhoea or obstructive bronchitis) were excluded from the measurements, as these included wearing an accelerometer affixed to the skin over 6 d. Written informed consent was obtained from each child’s parents. The Ethical Committee of Heidelberg University, Medical Faculty Mannheim approved the study. Directly measured physical activity PA was measured by accelerometry and heart-rate recording over six consecutive days over 24 h/d, including two weekend days. The data were obtained from the Actiheart device (CamNtech, Cambridge, UK), which combines one-dimensional accelerometry in the vertical plane with a two-channel electrocardiogram and was used in the longterm mode. The technical validity and reliability of the Actiheart has been described before(27). Acceleration counts and heart rate were recorded at an epoch setting of 15 s to enable detection of rapid changes in movement intensity and short bursts of MVPA as typically exhibited by young children(28,29). After programming the Actiheart monitor was securely affixed to the children’s substernal thorax(30) by two sticky electrodes and stayed there until 6 d later if not taken off before. Data analysis In our study, children’s PA was monitored 24 h/d. However, individual differences in PA during daytime, representing health-relevant PA behaviour, would be diluted by including PA during sleeping time. To detect and remove the sleeping periods, we therefore applied the following algorithm: raw accelerometry data (counts per 15 s, resulting in four samples per minute) were submitted to median filtering with a window size of forty-one samples, corresponding to 10 min 15 s. In the filtered signal those periods with an activity below a threshold of 5 counts/15 s for at least 30 min were marked as ‘probable sleeping periods’. To determine sleep onset, the onset of the latest ‘probable sleep period’ in a time window between 18.00 and 22.00 hours was searched. If no sleep onset was found between 18.00 and 22.00 hours, the time window was extended until 00.00 hours (midnight) with the search repeated. If this still yielded no result, sleep onset time was set to 22.00 hours. (Of a total of 6079 nights monitored, this happened 165 times in 100 children.) Wake-up time was set to the end of the last ‘possible sleep period’ that started between 00.00 and 06.00 hours. For further data cleaning, periods in which zero accelerometry counts were combined with zero heart rate for durations of 1 min or
Public Health Nutrition
Physical activity questionnaire validation
longer – indicating complete loss of contact – were removed from the data. This algorithm was monitored to produce reasonable results by graphical display of raw activity and heart-rate data with the cut-off periods marked. The remaining raw data were used to calculate the mean activity counts/15 s (MACT) for each child, a crude measure of overall activity of all intensities (similar to light-to-vigorous activity). The 15 s periods reflected by the samples were also classified as MVPA or SB(31), using sex-specific Actiheart cut-off points recently established for pre-school children(32) based upon the direct observation of PA using the Children’s Activity Rating Scale (CARS) as a reference method. Accordingly, MVPA classification was based upon activity counts and heart rate (after cutting out heart rates of 0 or .250 beats/min), while SB classification was based upon activity counts only. Finally, ratios for MVPA and SB were calculated by dividing the number of samples in MVPA and SB by the number of available samples with valid data for MVPA and SB, respectively. These ratios (3100) can be interpreted as percentage of daytime that the children spent in MVPA and SB, respectively. Indirectly measured physical activity Children’s PA was assessed using twelve items in a parental questionnaire, including five from a pre-existing PA assessment tool(26) and seven additional items capturing everyday PA of the children (see Table 1). The answers to most items were given on a 5-point ordinal rating scale providing an additional ‘do not know’ option. Two items were rated on a 4-point scale. When asked for habits, parents were instructed to think of the last typical week. The questionnaires were distributed to the parents by the pre-school teachers at the onset of accelerometer recording and were collected 6 d later. Extension of the questionnaire tool In addition to validating the original questionnaire, we tried to identify new items to further improve its validity. To this end we screened the answers to seven other PA-related questions (see Table 1) according to the following criteria: (i) association with the three objectively measured outcomes (MACT, MVPA and SB); and (ii) low correlation with the items of the existing questionnaire. The second criterion was set up to select items that provided new rather than duplicating existing information. The original questionnaire-based PA assessment tool applied a binary classification of children of being either physically active or not (2PA). We refined the categories to low, medium and high PA (3PA) after adding two of the seven new items screened. Answers to the single items on the 1–5 rating scale were defined as representing high or low levels of the respective activities based on their frequency distributions. The cut-off points for the original five items were kept. By adding up the number of activity questions rated as high and subtracting the number of
3
activity questions rated as low we developed a score ranging between 27 and 17 (when using seven items), indicating the number by which the activity questions rated as high exceed those rated as low. Finally, equidistant cut-off points were chosen to categorize a child’s PA as low (score 27 to 23), medium (score 22 to 12) or high (13 to 17) to produce a reasonable sample distribution: n (3PA 5 medium) . n (3PA 5 low) . n (3PA 5 high). Statistical analysis Due to right-skewed distribution the outcome variable MACT was transformed by taking the natural logarithm and modelled as a continuous outcome (linear regression). To analyse time spent in MVPA, the number of 15 s epochs in MVPA were modelled as count data (Poisson regression), adding ln(number of 15 s epochs available) as offset for each child to account for individual differences in measurement period and quality. The same procedure was applied to time spent in SB. All modelling was done using generalized estimation equation (GEE) models with ‘exchangeable’ as the correlation structure to account for the cluster structure of the study sample on the pre-school level. For bivariate comparisons of means, t tests for independent samples were performed on the transformed variables logarithmized MACT, square root of the proportion of time spent in MVPA and proportion of time spent in SB raised to the third power. For both 2PA and 3PA, Spearman’s rank order correlations with MACT, MVPA and SB were estimated. Results For seventy-nine (forty-four boys, thirty-five girls; mean age 4?95 (SD 0?71) years, mean BMI 15?47 (SD 1?81) kg/m2) of 827 (421 boys, 406 girls) participants the questionnaire was filled out insufficiently to compile the variable physically active, leaving 748 (90?4 %) for further analysis. These were aged between 28 and 80 months (mean 4?83 (SD 0?73) years) and had a mean BMI of 15?27 (SD 1?56) kg/m2. Mean accelerometry counts (MACT) The MACT per 15 s for children classified as physically active and not active based on the questionnaire were 21?69 and 19?78 (P , 0?0003), respectively. Multivariate regression analysis of the logarithmized MACT adjusted for age and sex revealed stable estimates for 2PA (Table 2), showing 8?6 % more counts per 15 s in children classified as physically active (P 5 0?004). There was no significant interaction between age and 2PA or sex and 2PA (data not shown), indicating equal strength of association between questionnaire rating and accelerometry counts for both sexes and all ages investigated. Girls’ MACT were 6?4 % lower than those of boys (adjusted for age but not for 2PA to avoid overadjustment, P 5 0?015).
4
O Bayer et al.
Table 1 Questionnaire items (English translation; original German version is available from the corresponding author upon request)
frequently
Answering options not at all
Question
How often do you spend time with your child outside? Do you or other persons take your child for swimming?
much less
How does your child usually go to y kindergarten? the playground? friends/relatives? leisure-time activities or similar?
& & & & & & & & & & Multiple-choice options for each item on foot, by bike, using a kid’s vehicle (e.g. kick scooter), by car, by public transport much more
3
326 times per week
every day
2, 3
ydoes your child climb on trees, wall bars or similar?
&
&
&
&
& &
2, 3
ydoes your child play with a ball?
&
&
&
&
& &
2, 3
ydoes your child play tag?
&
&
&
&
& &
2, 3
ydoes your child ride a bike or use a kick scooter?
&
&
&
&
& &
2, 3
ydoes your child skate (roller skates, inline skates)?
&
&
&
&
& &
regularly 2 h per week
regularly more than 2 h per week
3
Does your child attend a sports club or sports group?
&
&
&
&
& &
don’t know
don’t know
122 times per week
& &
regularly 1h per week
& &
less than once per week
& &
yes, 2 times per month
& &
&
never
frequently
&
sometimes
&
rarely
&
no
Public Health Nutrition
My child is physically inactive/slow. My child likes to romp with other children. How ofteny
&
never
Compared with other children, how much physical activity does your child need? What do you think of your child?
First column indicates items contained in 2PA (2), contained in 3PA (3) or just screened but not included. Cut-off points to dichotomize the activities as frequent or not frequent are indicated by vertical grey lines (which are omitted in the questionnaire to preclude bias). 2PA: 2PA is set to ‘yes’ if at least three activities are rated as frequent. Conversely, if at least three categories are rated as not frequent, 2PA is set to ‘no’. 3PA: the number of activities rated as frequent minus the number of those rated as not frequent is scored and the result categorised into ‘low’, ‘medium’ or ‘high’ as described in Methods – extension of the questionnaire tool.
Moderate-to-vigorous intensity physical activity (MVPA) and sedentary behaviour (SB) Children classified as physically active v. not physically active spent 5?3 v. 4?9 % (P , 0?02) of their time in MVPA. Expressed as a relative difference adjusted for age and
sex, this translates into 11?0 % more time spent in MVPA. As for MACT, there was again no significant interaction between age or sex and 2PA (data not shown). Girls spent 9?5 % less time in MVPA than boys (adjusted for age, P 5 0?009).
Physical activity questionnaire validation
5
Public Health Nutrition
Table 2 Linear regression results for the log-transformed outcome variable mean accelerometry counts per 15 s (MACT), and Poisson regression results for the outcome variables ‘time spent in moderate-to-vigorous intensity physical activity’ (MVPA) and ‘time spent in sedentary behaviour’ (SB). Classification of physically active by the original questionnaire tool 2PA; pre-school children aged 3–6 years, Germany Estimate
SE
P value
ln(MACT) Intercept Physically active Age in years Sex female
2?9495 0?0826 0?0024 20?0612
(n 724) 0?0854 0?0288 0?0171 0?0297
,0?0001 0?0042 0?8861 0?0393
15 s epochs in MVPA Intercept Physically active Age in years Sex female
22?9156 0?1048 20?0296 20?0887
(n 746) 0?1213 0?0372 0?0238 0?0393
,0?0001 0?0049 0?2136 0?0240
15 s epochs in SB Intercept Physically active Age in years Sex female
20?3107 20?0210 0?0097 20?1293
(n 748) 0?0271 0?0095 0?0057 0?0107
,0?0001 0?0266 0?0875 ,0?0001
Children classified as physically active spent 71?1 % of their time in SB compared with 72?1 % (P 5 0?087) in those classified as not physically active. Adjusting for age and sex revealed a statistically significant (Table 2) but nevertheless small difference. Extension of the questionnaire tool (from 2PA to 3PA) After screening seven PA-related questions not yet contained in the 2PA classification according to the criteria described in the Methods section, two items were selected to build the extended form of the questionnaire 3PA. Adjusted for age and sex, children with PA classified as medium showed 11?0 (95 % CI 4?8, 17?6) % more MACT, 13?3 (95 % CI 5?9, 21?3) % more time in MVPA and 3?2 (95 % CI 1?2, 5?1) % less time in SB. Those classified as high showed 16?9 (95 % CI 8?6, 25?8) % more MACT, 23?6 (95 % CI 13?8, 34?2) % more time in MVPA and 4?4 (95 % CI 2?1, 6?7) % less time in SB v. those with PA classified as low (computed from the GEE modelling estimates in Table 3). Assuming usual times of 36 min (5 %) in MVPA and 504 min (70 %) in SB for children who are awake 12 h/d and whose PA is classified as medium or high, this translates into 1236030?0530?133 5 4?8 or 8?5 more min in MVPA and 16?1 or 22?2 less min in SB, respectively. Correlations as measured by Spearman’s rank correlation coefficient of 2PA with MACT, percentage of time spent in MVPA and percentage of time spent in SB were 0?133, 0?111 and 20?044 (the latter being not significant, with P 5 0?23), respectively. Correlations of 3PA with MACT, percentage of time spent in MVPA and percentage of time spent in SB were 0?197, 0?151 and 20?123, respectively. The distributions of children as classified by 2PA and 3PA are given in Table 4.
Table 3 Linear regression results for the log-transformed outcome variable mean accelerometry counts per 15 s (MACT), and Poisson regression results for the outcome variables ‘time spent in moderate-to-vigorous intensity physical activity’ (MVPA) and ‘time spent in sedentary behaviour’ (SB). Classification of physical activity (PA) by the extended questionnaire tool (3PA) with low PA as the reference; pre-school children aged 3–6 years, Germany Estimate
SE
P value
ln(MACT) Intercept PA medium PA high Age in years Sex female
2?9517 0?1044 0?1562 20?0085 20?0587
(n 724) 0?0889 0?0296 0?0376 0?0178 0?0297
,0?0001 0?0004 ,0?0001 0?6313 0?0483
15 s epochs in MVPA Intercept PA medium PA high Age in years Sex female
22?9059 0?1250 0?2117 20?0441 20?0919
(n 721) 0?1196 0?0346 0?0420 0?0236 0?0379
,0?0001 0?0003 ,0?0001 0?0153 0?0110
15 s epochs in SB Intercept PA medium PA high Age in years Sex female
20?3115 20?0325 20?0450 0?0134 20?1305
(n 723) 0?0290 0?0103 0?0123 0?0058 0?0106
,0?0001 0?0016 0?0003 0?0204 ,0?0001
Table 4 Distribution of the children as classified by 2PA and 3PA; pre-school children aged 3–6 years, Germany 2PA
No
Yes
Boys Girls Sum
242 259 501
135 112 247
3PA
Low
Medium
High
Boys Girls Sum
116 118 234
163 172 335
85 70 155
Discussion In the present study, the existing and previously published tool (2PA) to assess PA in pre-school children based on a parental questionnaire showed significant associations with direct measures of PA derived from accelerometry and heart-rate recordings. The suggested extensions by incorporating two more questions and refinement from two to three categories (3PA) led to a substantially improved classification. This shows that, by means of objective continuous PA measures, improvement of a questionnairebased classification is possible. To ensure backward compatibility, all items and their respective cut-off points from the original 2PA questionnaire were included in 3PA. Thereby, the results from a study using the items of 3PA can be made comparable to those produced by a study that used the ‘old’ version of the questionnaire by recalculating 2PA according to the original algorithm(26).
6
O Bayer et al.
Public Health Nutrition
(26)
Confirming the results of the previous study , the PA questionnaire items were filled out sufficiently to compile the classification variables 2PA and 3PA for most of the participants, indicating that parents had no difficulties in answering the questions. Furthermore, completion of the PA items was independent of age, sex, BMI and MACT. Thus there is no indication of a selection bias introduced by the questionnaire. We performed additional analyses using maternal education classified according to the International Standard Classification of Education (ISCED) into low (levels 1 to 3, n 136), medium (level 4, n 464), and high (levels 5 and 6, n 163) as a proxy for parental education. The percentages of questionnaires completed sufficiently to compute 2PA were 96?3 %, 94?6 % and 93?9 % by parents with low, medium and high education (P 5 0?62). The corresponding percentages for 3PA were 94?1 %, 91?6 % and 90?8 % (P 5 0?54). The correlations with mean accelerometer counts were quite low – with a Spearman’s r of 0?133 for 2PA and 0?197 for 3PA – and compare with validation results of other questionnaires reported in the literature (although it has to be noted that other instruments validated in older children show substantially higher correlations). While the International Physical Activity Questionnaire (IPAQ) showed relatively good validity in adults and adolescents aged 15–18 years, the correlations for children below that age were unsatisfactorily low(21,33,34). The Children’s Leisure Activities Study Survey (CLASS) was developed to assess PA behaviour in large-scale population studies and contains a list of thirty activities. Validation of the proxy version (parental questionnaire) in fifty-eight Australian children aged 5–6 years against accelerometry-based estimates of time spent in moderate and vigorous PA revealed r values of about 0?05 (not significant), while better correlations – up to 0?24 – were obtained for children aged 10–12 years(23). A Chinese version CLASS-C showed different correlations for boys (r 5 0?27, NS, n 33) and girls (r 5 0?48, P , 0?05, n 66) aged 9–12 years when validated against time spent in MVPA as measured by accelerometers(35). The correlations of the 3PA classification found in the current study of about 0?2 for children with a mean age of below 5 years thus range among the best results of proxybased PA estimations reported for this age, estimated from a large sample of children from fifty-five pre-schools located in different areas. Compared with other questionnaires, one advantage of 3PA is its simplicity. Being based upon only seven items, 3PA can be easily adopted as part of a larger survey and thus, for example, might enable studies among children of pre-school age to account for PA as a confounder. Another quite short PA assessment tool is the Fels Physical Activity Questionnaire. It employs three ‘open’ and five ‘closed’ items and has been tested for a wide variety of ages from 7 to 19 years(22). The correlation between the resulting score and accelerometer counts was 0?34 in the group of seventy elementary-school
children (presumable mean age 8 years). However, this high correlation was achieved only in older children who reported PA themselves at two occasions under supervision of research personnel, which likely might have biased the reported validity towards higher values. In young children, scientific evidence increasingly raises the importance of all intensities of PA (see Australian and National Association for Sport and Physical Education recommendations(8,9)). In children older than 5 years however, higher-level activities seem to be more relevant for health outcomes(36,37). In our study with children aged on average 4?9 years, we therefore chose to include three outcomes covering the whole spectrum of PA intensity: MACT as an average measure of PA (including all PA intensity levels averaged over the whole recording period, excluding sleeping time), MVPA and SB. We could show that the classification of children’s PA by the instruments was significantly associated with time spent in MVPA and MACT. For SB, this association was weaker, yet still significant. These results suggest that by our instruments both differences in overall PA as well as higher PA levels may be detected in children of pre-school age, with the 3PA classification allowing higher differentiation. In addition, the 3PA classification results indicate similarly sized differences in MVPA between children whose activity was rated low v. medium (113?3 % MVPA) and medium v. high (110?3 % MVPA). As already outlined in the article introducing the original questionnaire(26), the instrument was designed to measure physical activity rather than inactivity (all seven items concern PA behaviour, not sedentary behaviour). This focus on PA is reflected by the stronger association of our classification with MACT and MVPA than SB. Because the entities of SB and PA are different and not just the opposite of each other, significant associations of the 3PA and 2PA scores with all measures of PA as well as SB are, however, plausible: a child can engage a lot in SB but concurrently spend more time in MVPA than other children as well. Our finding of significant associations with all outcomes might even underline the validity and importance of the items in measuring pre-school children’s movement behaviour. However, we would recommend using 3PA primarily for measuring and screening PA – and not SB – in pre-school children. When used in studies that assess behaviour change over time it has to be noted that even 3PA is still a rough measure with only three outcome categories. Changes due e.g. to an intervention can only expected to be detectable if there is enough follow-up time, and the intervention effect is substantial. According to our results, the effect of classifying a child as active v. inactive (2PA) is as big as the effect of sex in explaining time spent in MVPA. Our results suggesting significantly higher MVPA and MACT in boys compared with girls are in line with many studies showing sex differences in PA in both pre-school(38–42) and school-aged children(43–45). Interestingly, girls spent
Physical activity questionnaire validation
7 0.5
4.5
4.0
0.8
0.4 0.6
3.0
0.3
0.2
*
*
(% Time spent in SB)3
% Time spent in MVPA
In(MACT)
3.5
0.4
*
*
2.5
Public Health Nutrition
2.0
0.2
0.1
1.5 0.0 No
Yes
Physically active
No
Yes
Physically active
No
Yes
Physically active
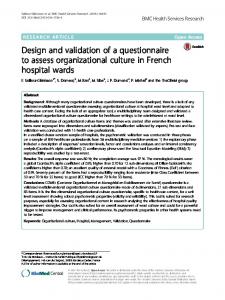
Fig. 1 Box-and-whisker plots of transformed outcome measures for German pre-school children aged 3–6 years classified as physically active or not based on the questionnaire. The * represent the mean, the thick solid lines the median, the boxes the interquartile range. The whiskers extend to the most extreme data point which is no more than 1?5 times the interquartile range from the box. Data points beyond this limit are shown as J (MACT, mean accelerometry counts per 15 s; MVPA, moderate-tovigorous physical activity; SB, sedentary behaviour)
less time in MVPA but also less time in SB. The effects of these two findings might partially balance out and result in a smaller percentage difference in MACT between the sexes than observed for time in MVPA. A few limitations to our study have to be noted. The seven-item questionnaire (3PA) was tested in preschool children only. The validity in higher ages remains to be investigated. Since the pre-schools voluntarily signed up to participate in the trial, our sample is not representative of German pre-school children. However, the association between questionnaire and PA may depend less critically on representativeness than a prevalence study. Participation was high on both pre-school level (82 % of the eligible pre-schools) and child level (79 % of the eligible children). Some 7?2 % and 1?9 % of the children were overweight and obese, respectively, compared with prevalences of 9?0 % and 2?9 % among children aged 3–6 years in the German Health Interview and Examination Survey for Children and Adolescents (KiGGS)(46). These differences can be likely explained by the origin of our sample, as south Germany generally can be assumed to have a lower rate of child overweight due to higher socio-economic status.
All questions were answered on a 5-point ordinal rating scale. For the question ‘How often do you or other persons take your child for swimming’ only the first (‘never’) and fifth (‘frequently’) multiple-choice option were labelled. Providing specific frequencies for each option might have resulted in more precise measurement. We were not able to assess retest reliability, as we have no repeated measurements within a short period of time. The removal of sleep periods relies on a data-driven algorithm. There are no established algorithms to determine sleep. The validity of our algorithm is not known, yet it produced plausible values. Other methods that require the participants to mark sleep periods by pressing a button (e.g. when using the Actigraph monitor) also might introduce some error into the measurement. Since we tested the association of the questionnairebased classification against three different outcomes (MACT, MVPA and SB) multiple testing might be an issue. However, correction of the P values according to Hochberg’s method(47) for testing three hypotheses did not change significance on the a , 0?05 level. While including three different outcomes (MACT as an average measure of PA, MVPA and SB), we did not
Public Health Nutrition
8
explicitly include light-intensity PA as an outcome. Nevertheless, light-intensity PA is indirectly included, as it is the missing category between SB and MVPA as defined by cut-offs at both extremes of accelerometry and heart-rate data scales. Using multivariable regression allowed us to adjust for potential confounding by age and sex as well as their interaction with the classification result of the questionnaires. The latter is of interest, since a significant interaction of e.g. age and 2PA would indicate different validity in different ages. As reported in the Results, this was not found. The use of GEE models accounted for the cluster structure of the sample on the level of pre-schools. For the bivariate comparisons, the selection of the natural logarithm and the square root function as transformation for the variables MACT and percentage of time spent in MVPA, respectively, are not surprising since their distributions can be expected to be right-skewed. The same is true for the cubic function in the case of the left-skewed variable percentage of time spent in SB (Fig. 1). As a sensitivity analysis we repeated bivariate testing of the untransformed outcomes using the non-parametric Mann–Whitney U test, which confirmed the differences between the children classified as physically active and inactive. Conclusions The present validation study of the 2PA and also the extended 3PA questionnaire revealed correlations with direct measures of PA that stand up to comparison with those of longer or more complex questionnaire tools. However, correlations for children of pre-school age generally have been found to be quite low when compared with those in older children. 3PA should be tested in other populations of pre-school and elementary-school children, and be translated into other languages with subsequent validation. The classification by the 3PA questionnaire significantly correlates with mean accelerometry counts, MVPA and SB, suggesting that it reflects differences in all PA intensities important for the pre-school age. Acknowledgements This work was supported by a grant from the Landsstiftung Baden-Wu¨rttemberg. O.B. is supported by LMUinnovativ research priority project MCHealth (subproject II). F.D.B. is supported by the European Social Fund and by the Ministry of Science, Research and the Arts Baden-Wu¨rttemberg. There are no conflicts of interest to disclose for any of the authors. Authors’ contributions were as follows: O.B., study design, data analysis (including development of the sleep removal algorithm), statistical analysis, writing; M.J., data management, revision of manuscript; J.F., revision of manuscript, funding; R.V.K., revision of manuscript,
O Bayer et al.
funding; F.D.B. study design, writing, review of literature regarding PA outcomes. The authors thank the parents, children, families and pre-schools for their cooperation.
References 1. Biddle SJH, Gorely T & Stensel DJ (2004) Health-enhancing physical activity and sedentary behaviour in children and adolescents. J Sports Sci 22, 679–701. 2. Moore LL, Nguyen US, Rothman KJ et al. (1995) Preschool physical activity level and change in body fatness in young children. The Framingham Children’s Study. Am J Epidemiol 142, 982–988. 3. Must A & Tybor DJ (2005) Physical activity and sedentary behavior: a review of longitudinal studies of weight and adiposity in youth. Int J Obes (Lond) 29, Suppl. 2, S84–S96. 4. Janz KF, Kwon S, Letuchy EM et al. (2009) Sustained effect of early physical activity on body fat mass in older children. Am J Prev Med 37, 35–40. 5. Brage S, Wedderkopp N, Ekelund U et al. (2004) Features of the metabolic syndrome are associated with objectively measured physical activity and fitness in Danish children: the European Youth Heart Study (EYHS). Diabetes Care 27, 2141–2148. 6. Sa¨a¨kslahti A, Numminen P, Varstala V et al. (2004) Physical activity as a preventive measure for coronary heart disease risk factors in early childhood. Scand J Med Sci Sports 14, 143–149. 7. Janz K, Letuchy E, Gilmore JE et al. (2010) Early physical activity provides sustained bone health benefits later in childhood. Med Sci Sports Exerc 42, 1072–1078. 8. Commonwealth of Australia, Department of Health and Ageing (2010) National Australian Physical Activity Recommendations for Children 0–5 Years. http://www.health.gov. au/internet/main/publishing.nsf/content/CB94BC879F76C211 CA2577AE007F78FC/$File/PA%20Rec%200-5%20yo%20-%20 Q&A.pdf 9. National Association for Sport and Physical Education (2009) Active Start: A Statement of Physical Activity Guidelines for Children Birth to Age 5 and Physical Activity for Children: A Statement of Guidelines for Children 5–12, 2nd Edition. http://www.aahperd.org/naspe/standards/nationalGuidelines/ PAguidelines.cfm 10. Welk GJ, Corbin CB & Dale D (2000) Measurement issues in the assessment of physical activity in children. Res Q Exerc Sport 71, 2 Suppl., S59–S73. 11. Pate RR, Almeida MJ, McIver KL et al. (2006) Validation and calibration of an accelerometer in preschool children. Obesity (Silver Spring) 14, 2000–2006. 12. Puyau MR, Adolph AL, Vohra FA et al. (2004) Prediction of activity energy expenditure using accelerometers in children. Med Sci Sports Exerc 36, 1625–1631. 13. Freedson P, Pober D & Janz KF (2005) Calibration of accelerometer output for children. Med Sci Sports Exerc 37, 11 Suppl., S523–S530. 14. Chen KY & Bassett DR Jr (2005) The technology of accelerometry-based activity monitors: current and future. Med Sci Sports Exerc 37, 11 Suppl., S490–S500. 15. Freedson PS & Miller K (2000) Objective monitoring of physical activity using motion sensors and heart rate. Res Q Exerc Sport 71, 2 Suppl., S21–S29. 16. Corder K, Brage S, Wareham NJ et al. (2005) Comparison of PAEE from combined and separate heart rate and movement models in children. Med Sci Sports Exerc 37, 1761–1767. 17. Ward DS, Evenson KR, Vaughn A et al. (2005) Accelerometer use in physical activity: best practices and research recommendations. Med Sci Sports Exerc 37, 11 Suppl., S582–S588.
Public Health Nutrition
Physical activity questionnaire validation 18. Burdette HL, Whitaker RC & Daniels SR (2004) Parental report of outdoor playtime as a measure of physical activity in preschool-aged children. Arch Pediatr Adolesc Med 158, 353–357. 19. Janz KF, Broffitt B & Levy SM (2005) Validation evidence for the Netherlands physical activity questionnaire for young children: the Iowa bone development study. Res Q Exerc Sport 76, 363–369. 20. Corder K, van Sluijs EMF, Wright A et al. (2009) Is it possible to assess free-living physical activity and energy expenditure in young people by self-report? Am J Clin Nutr 89, 862–870. 21. Hagstro¨mer M, Bergman P, Bourdeaudhuij ID et al. (2008) Concurrent validity of a modified version of the International Physical Activity Questionnaire (IPAQ-A) in European adolescents: The HELENA Study. Int J Obes (Lond) 32, Suppl. 5, S42–S48. 22. Treuth MS, Hou N, Young DR et al. (2005) Validity and reliability of the Fels physical activity questionnaire for children. Med Sci Sports Exerc 37, 488–495. 23. Telford A, Salmon J, Jolley D et al. (2004) Reliability and validity of physical activity questionnaires for children: The Children’s Leisure Activities Study Survey (CLASS). Pediatr Exerc Sci 16, 64–78. 24. Kohl HW & Fulton JCC (2000) Assessment of physical activity among children and adolescents: a review and synthesis. Prev Med 31, 54–76. 25. Sallis JF & Saelens BE (2000) Assessment of physical activity by self-report: status, limitations, and future directions. Res Q Exerc Sport 71, 2 Suppl., S1–S14. 26. Bayer O, Bolte G, Morlock G et al. (2009) A simple assessment of physical activity is associated with obesity and motor fitness in pre-school children. Public Health Nutr 12, 1242–1247, corrigendum 1308. 27. Brage S, Brage N, Franks PW et al. (2005) Reliability and validity of the combined heart rate and movement sensor Actiheart. Eur J Clin Nutr 59, 561–570. 28. Trost SG, McIver KL & Pate RR (2005) Conducting accelerometer-based activity assessments in field-based research. Med Sci Sports Exerc 37, 11 Suppl., S531–S543. 29. Rowlands AV, Eston RG & Ingledew DK (1997) Measurement of physical activity in children with particular reference to the use of heart rate and pedometry. Sports Med 24, 258–272. 30. Brage S, Brage N, Ekelund U et al. (2006) Effect of combined movement and heart rate monitor placement on physical activity estimates during treadmill locomotion and free-living. Eur J Appl Physiol 96, 517–524. 31. Puhl J, Greaves K, Hoyt M et al. (1990) Children’s Activity Rating Scale (CARS): description and calibration. Res Q Exerc Sport 61, 26–36. 32. De Bock F, Menze J, Becker S et al. (2010) Combining accelerometry and heart rate for assessing preschoolers’ physical activity. Med Sci Sports Exerc 42, 2237–2243.
9 33. Craig CL, Marshall AL, Sjo¨stro¨m M et al. (2003) International physical activity questionnaire: 12-country reliability and validity. Med Sci Sports Exerc 35, 1381–1395. 34. Kurtze N, Rangul V & Hustvedt B-E (2008) Reliability and validity of the international physical activity questionnaire in the Nord-Trøndelag health study (HUNT) population of men. BMC Med Res Methodol 8, 63. 35. Huang YJ, Wong SHS & Salmon J (2009) Reliability and validity of the modified Chinese version of the Children’s Leisure Activities Study Survey (CLASS) questionnaire in assessing physical activity among Hong Kong children. Pediatr Exerc Sci 21, 339–353. 36. Cavill NA, Biddle S & Sallis JF (2001) Health enhancing physical activity for young people: statement of the United Kingdom Expert Consensus Conference. Pediatr Exerc Sci 13, 12–25. 37. Strong WB, Malina RM, Blimkie CJR et al. (2005) Evidence based physical activity for school-age youth. J Pediatr 146, 732–737. 38. Hinkley T, Crawford D, Salmon J et al. (2008) Preschool children and physical activity: a review of correlates. Am J Prev Med 34, 435–441. 39. Baranowski T, Thompson WO, DuRant RH et al. (1993) Observations on physical activity in physical locations: age, gender, ethnicity, and month effects. Res Q Exerc Sport 64, 127–133. 40. Pate RR, McIver K, Dowda M et al. (2008) Directly observed physical activity levels in preschool children. J Sch Health 78, 438–444. 41. Jackson DM, Reilly JJ, Kelly LA et al. (2003) Objectively measured physical activity in a representative sample of 3- to 4-year-old children. Obes Res 11, 420–425. 42. Grontved A, Pedersen GS, Andersen LB et al. (2009) Personal characteristics and demographic factors associated with objectively measured physical activity in children attending preschool. Pediatr Exerc Sci 21, 209–219. 43. Lopes VP, Vasques CMS, Maia JAR et al. (2007) Habitual physical activity levels in childhood and adolescence assessed with accelerometry. J Sports Med Phys Fitness 47, 217–222. 44. Santos P, Guerra S, Ribeiro JC et al. (2003) Age and genderrelated physical activity. A descriptive study in children using accelerometry. J Sports Med Phys Fitness 43, 85–89. 45. Steele RM, van Sluijs EM, Sharp SJ et al. (2010) An investigation of patterns of children’s sedentary and vigorous physical activity throughout the week. Int J Behav Nutr Phys Act 7, 88. 46. Kurth B-M & Rosario AS (2007) The prevalence of overweight and obese children and adolescents living in Germany. Results of the German Health Interview and Examination Survey for Children and Adolescents (KiGGS). Bundesgesundheitsblatt Gesundheitsforschung Gesundheitsschutz 50, 736–743. 47. Hochberg Y (1988) A sharper Bonferroni procedure for multiple tests of significance. Biometrika 75, 800–802.