ED: SNR
Op: gopal/raj
CEJ:
lww_cej_2002-244 Research Paper 1
Validation of a questionnaire to evaluate the attitude towards primary prevention advice from the European Code against Cancer. Ma L Lo´pez1, E Garcı´a-Cueto2, J Manuel Ferna´ndez3, S Lo´pez4, Ma del O Del Valle1 and A Cueto1 Educative interventions to promote primary prevention of cancer (PPC) should be based on psychosocial models and be tailored to attitude. Attitude is a difficult variable to measure. The aim of this study was to draw up a questionnaire to evaluate the attitude to PPC of relatives of patients affected by cancer. An interview of 48 patients, who answered open questions, allowed 67 items to be drawn up. Three hundred and fifty-five people answered the self-administered questionnaire of 67 items (69 of them did it twice, with an interval of 2 weeks). The factorial analysis revealed five factors that explain the 36% total and the 115% common estimated variance. The Cronbach’s a oscillated between 0.80 and 0.93. The intraclass correlation coefficient was 0.7721 (95% CI (confidence interval) 0.6311–0.8592, P < 0.0001). The analysis based on Samejima’s model ordered the items according to their discriminating power and the difficulty/ease with which people agree with the most preventive option. The average scores obtained in both surveys of 69 people did not show significant statistical differences (P = 0.195). The definitive
questionnaire obtained has 63 items that measure attitude to PPC behaviour in a reliable and stable way. European c 2003 LippinJournal of Cancer Prevention 12:000–000 cott Williams & Wilkins.
Introduction
Theoretical models exist that can make the application of the said strategies easier. One of them is the ASE model (Attitude, Social Influence and Self-Efficacy) of psychosocial factors associated with human behaviour (Van Assema et al., 1993; Brug et al., 1995; Bolman and De Vries, 1998). This model is based on the Fishbein and Ajzen (1975) theories, establishes that attitude is associated with behaviour, and precedes it. The attitude towards cancer prevention will depend on the advantages and disadvantages perceived in adopting a given preventive behaviour. Health workers can motivate their patients to follow preventive behaviour, emphasizing its advantages, and searching for alternatives to its disadvantages, when they exist.
The 2000 Report by the Spanish Public Health and Sanitary Administration Society (Rodrı´guez and Gutie´rrez-Fisac, 2000) warns that in Spain not only have the ‘Health for All 2000’ programme objectives for cancer prevention not been reached, but that we are going in the opposite direction. It seems that the primary prevention advice in the European Code against Cancer (ECC) (Veronesi et al., 2000) has not been followed sufficiently by the Spanish population. A study carried out in our region (Lo´pez et al., 1994; Del Valle et al., 1999) revealed insufficient knowledge and practice of the ECC. Recent orientations in cancer prevention strategy (Weston, 1999) establish that: ‘motivation is a determining factor in whether people attend, take up and follow through positive health behaviour, and motivation needs to be defined by the target population’; ‘the most rigorously designed interventions will have little effect on the uptake of cancer preventive measures if we do not understand what individuals or populations think, feel or believe’. c 2003 Lippincott Williams & Wilkins 0959-8278
European Journal of Cancer Prevention 2003, 12:000–000 Key words: Attitude, attitude to health, factor analysis, methods, neoplasms, prevention and control, primary prevention, questionnaires, risk-taking and behaviour, statistical, statistics and numerical data 1 University of Oviedo, Faculty of Medicine, Department of Preventive Medicine, IUOPA (Instituto Universitario Oncolo´gico del Principado de Asturias), Julia´n Claverı´a s/n, 33006 Oviedo, Spain, 2University of Oviedo, Faculty of Psychology, Department of Methodology of Behaviour Sciences, Spain, 3Research Department, Hospital San Agustı´n of Avile´s, Spain and 4University of Cantabria, Nursing School, Spain.
Correspondence to: M L Lo´pez. Fax: ( + 34) 98 510 3545. E-mail:
[email protected] Received 16 June 2002 accepted 29 November 2002
The evaluation of people’s attitude to cancer prevention is also a sine qua non condition for making educative interventions tailor-made for their needs. In this sense, Prochaska (1991, 1992) established that pre-contemplative and contemplative patients need educative interventions that achieve positive attitudes to healthy behaviour, that is to say, motivating interventions. In more advanced stages of the behaviour change process, DOI: 10.1097/01.cej.0000062788.86004.64
2 European Journal of Cancer Prevention 2003, Vol 12 No 00
the educative interventions should be focused more on providing them with skills and helping them to eliminate barriers, than on attitude. The attitude to one or various cancer prevention behaviours is a subjective and complex variable and, consequently difficult to measure. Qualitative research, which pays attention to the speech of the target groups, helps to find out which advantages and disadvantages the patients perceive on adopting the preventive advice, not those perceived by their doctors or nurses. Qualitative research also provides information to construct scales for measuring attitude that are valid, reliable and adapted to the population. This type of research is very useful (McKinlay, 1992; Harding and Gantley, 1998; Mays and Pope, 2000), as apart from studying social reality, it provides suitable categorizations for subjective variables associated with behaviour (Miles and Huberman, 1984), adapts the vocabulary of the questionnaire to the target group’s own language, and discovers how the patient sees the problem (Krueger, 1994). Although several authors have tried to explore the attitude of different populations to cancer prevention in general and to some of its risk factors in particular (Wardle et al., 1995; Willoughby and Edens, 1996; Howell et al., 1998; Etter et al., 2000; Hailey et al., 2000; Smith et al., 2000), the transcultural adaptation of the measuring scales is not always easy, nor are suitable for the aim or design of a given research project. We have not found an ideal questionnaire in the scientific literature to classify the patients according to the points obtained in the ‘attitude to primary prevention of cancer’ variable. Such a questionnaire would help to carry out tailor-made educative interventions, and to evaluate the effect of the said interventions on the patient’s attitude. The aim of our study was to create and validate a questionnaire designed to evaluate people’s attitude to the primary prevention behaviours advised in the ECC. These persons should be primary care patients, who attend for any reason, and have relatives affected by cancer. This target group has been chosen because autobiographical experience of cancer, especially that of relatives, plays a significant role in determining attitude to cancer prevention (Kristeller et al., 1996; Audrain et al., 1999; Ryan and Skinner, 1999; Weston, 1999).
Materials and methods Qualitative and quantitative methods have been used in this study in a complementary way: the qualitative one to adapt the items of the attitude questionnaire to the perception and the oral expression of the target population; the quantitative one to validate the attitude scale thus constructed.
Qualitative research
A convenience sample of 48 patients between 15 and 50 years old, with relatives affected by cancer, was chosen in three regions of the north of Spain, when they asked for attention in primary care. Patients were selected sequentially and voluntarily included in the study. People with an insufficient psychological capacity to answer the questions, due to dementia, drug addiction, etc. were excluded. Trained doctors interviewed them with a questionnaire of open questions designed to find out the advantages and disadvantages perceived by the patients, both for their health and life, arising from following the ECC primary prevention advice. This is a general scheme of the style of the questions: ‘What advantages/disadvantages for your health/life do you think the following have: not smoking/drinking alcohol in moderation/eating lots of fruit and vegetables/eating little fat/watching your weight/protecting yourself from the sun/protecting yourself at work?’ As an aid, a poster was used during the interviews showing the ECC primary prevention advice. Two independent researchers analysed the thematic content of the answers obtained, classified them into categories and ordered them according to frequency, using the Burnard (1991) method. In the few discrepancies that arose during this process, the decision was taken by consensus. Quantitative research
Three hundred and fifty-five patients, with the same profile as the participants in the qualitative research, were surveyed with a self-administered questionnaire that contained 67 attitude items, constructed with the 5– 6 most frequent answers given to each open question in the qualitative research. The selection of the sample and the criteria for inclusion in the study were identical to those in the qualitative investigation. The degree of agreement/disagreement with the items was measured by means of a five-point Likert scale. Each answer was scored from 1 to 5, the highest score being given to the option that expressed the most favourable attitude to the prevention behaviour. Table 1 shows the items and the way in which they were scored. To study the ‘construct validity’ an exploratory multivariate analysis was carried out by means of factor analysis. The best fit of the data to the model was obtained using the principal component method with oblique rotation so as not to hide the existing empirical relationship among the factors found (Yela, 1997). The item-test correlation coefficient for each of the said factors was calculated, and the items with corrected correlations lower than 0.20 were eliminated (Garcı´aCueto, 1993), to achieve a more congruous structure. The factor analysis was repeated with the remaining items.
Attitude to primary prevention of cancer Lo´pez et al. 3
Table 1
Attitude items to the preventive advice of the European Code against Cancer, in the quantitative questionnaire
1. Smoking raises the risk of getting lung cancer CA = 5 2. Smoking lessens my ability to take physical exercisea 3. Smoking gives me great pleasure CA = 1 4. Smoking relaxes me CA = 1 5. Smoking is a way to waste money CA = 5 6. Tobacco smoke annoys non-smokers CA = 5 7. Thanks to tobacco I can bear stress CA = 1
35. Food with a lot of fat is tastier CA = 1 36. Fatty diets raise the cholesterol in the blood CA = 5 37. Meals with fat are more satisfying CA = 1 38. Meals with a lot of fat are more difficult to digest CA = 5 39. Fat is one of the greatest gastronomic pleasures CA = 1 40. A diet rich in fat raises the arterial blood pressure CA = 5 41. Thanks to a diet rich in fat it is possible to do work requiring great physical effort CA = 1 8. I would sleep badly without tobacco CA = 1 42. Diets with a lot of fat are more expensive *** 9. The smell that smokers have is unpleasant CA = 5 43. The best ending for a good meal is a high-fat dessert CA = 1 10. If I can’t smoke I get into a bad mood CA = 1 44. Maintaining a suitable weight prevents a lot of illnesses CA = 5 11. Drinking alcohol in excess raises blood pressure CA = 5 45. The sacrifice necessary to watch weight is too great CA = 1 12. Drinking alcohol helps me to mix with other people CA = 1 46. Having a suitable weight helps you to get certain jobs CA = 5 13. People who drink alcohol can harm their liver CA = 5 47. Worrying about not putting on weight can be more dangerous for your health than being overweight CA = 1 14. Drinking alcohol gives me great pleasure CA = 1 48. Society accepts thin people more readily than fat ones CA = 5 15. If I don’t drink when I go out with friends they don’t like it MA = 1 49. The discipline necessary to be thin prevents you from being happy. CA = 1 16. Drinkers have more family problems CA = 5 50. Thin people find clothes more easily CA = 5 17. When I drink alcohol I feel happier CA = 1 51. Thin people pick up partners more easily than fat people CA = 5 18. Alcohol is the main cause of traffic accidents CA = 5 52. Watching my weight so as not to get fat puts me in a bad mood CA = 1 19. Drinking alcohol relaxes me CA = 1 53. You are better- looking with your normal weight than when you are overweight CA = 5 20. Alcohol makes it difficult to control yourself CA = 5 54. The sun is the most important cause of skin cancer CA = 5 21. Thanks to alcohol I lose my inhibitions CA = 1 55. Products that protect you from the sun (creams, lotions, etc.) are unpleasant CA = 1 22. Fresh vegetables have a lot of vitamins CA = 5 56. The sun helps to make wrinkles appear in the skin CA = 5 23. I find the taste of vegetables unpleasant CA = 1 57. Sun creams are expensive CA = 1 24. Fresh fruit is a very healthy food CA = 5 58. The sun produces lots of blemishes on the skin CA = 5 25. Eating vegetables prevents you having a varied diet CA = 1 59. Using sun creams it is difficult to get a tan CA = 1 26. When I eat vegetables I still feel hungry CA = 1 60. Many cancers would be avoided if workers protected themselves against toxic substances CA = 5 27. Some of the people who live with me do not like vegetables CA = 1 61. The protection that it is necessary to use at work ((masks, gloves, goggles, etc) are uncomfortable *** 28. Eating vegetables helps you not to put on weight CA = 5 62. If all the workers at risk protected themselves, the country would save a lot of money CA = 5 29. It is difficult to cook vegetables in such a way as to make them appetizing 63. When the worker uses protection he works worse CA = 1 CA = 1 64. You feel better about yourself when you work with protection CA = 5 30. A diet rich in vegetables helps you to save moneya 31. Diets with vegetables are not very enjoyable CA = 1 65. Using protection at work wastes a lot of time CA = 1 32. Fruit is only pleasant in summer CA = 1 66. Protecting yourself at work is a way of showing your love for your loved ones CA = 5 33. A diet rich in vegetables helps to control cholesterol CA = 5 67. Protecting your hands with gloves is dangerous as it lowers the sensitivity of your sense of touch CA = 1 34. A diet rich in fat harms the health of the heart CA = 5 a Item eliminated for showing an item-test correlation coefficient lower than 0,20The score of the ‘completely agree’ option (CA) is shown in each item. CA = 5 when that option is the healthiest. In that case ‘I agree’ = 4; ‘I don’t know/neutral’ = 3; ‘I disagree’ = 2; ‘I completely disagree’ = 1.CA = 1 if that option is the least healthy. In that case ‘I agree’ = 2 ; ‘I don’t know/neutral’ = 3; ‘I disagree’ = 4; ‘I completely disagree’ = 5.
The principal axis method was used to extract factors, which was rotated following the Equamax procedure.
series of average scores was verified by means of the Pearson’s correlation coefficient.
The internal consistency of the answers given to the items grouped in each one of the factors obtained in the factorial analysis was studied to evaluate reliability. Cronbach’s a coefficient for each factor was calculated.
The mean of the average scores obtained by the 69 patients in the first and second survey was calculated and compared to see if there were significant differences, using Student’s t-test for matched samples.
The stability or repeatability of the answers was checked in 69 randomly chosen patients who were surveyed twice, with an interval of 15 days between the first and second survey. To do this, the intraclass correlation coefficient was used first, as ordinal qualitative variables had been used. However, apart from this, a total and average score was calculated for each patient: the mean of the scores obtained in the 63 items of the definitive test. To check if the said scores had a normal distribution the Kolmogorov– Smirnoff test was used. The association between the two
To obtain the parameter sample independence data were analysed by using Samejima’s model (1997). Besides, this model allows the items to be ordered within each factor, both for their discriminating power and for the difficulty in choosing the healthiest option and the ease with which they chose the least healthy one (Linden and Hambleton, 1997).
Results The characteristics of the samples used in the qualitative and quantitative research were respectively: N = 48 and
4 European Journal of Cancer Prevention 2003, Vol 12 No 00
355; average age: 35 (SD 9.80) and 32.57 (SD 10.30); gender: 52% women, 48% men and 63.2% women, 32.8% men; educational level: 20% primary, 40% secondary, 40% university and 25% primary, 42% secondary, 33% university. No differences were found between the two samples either in age (P = 0.12), gender (P = 0.14) or education level (P = 0.63). The classification and ordering of the qualitative data allowed the drawing up of the 67 items shown in Table 1. The average total score of the attitude to all the preventive behaviours included in the ECC was 242.09 points (SD 22.66). The factorial analysis obtained a matrix with five factors, which explain the 32% total variance and the 108% common estimated variance. Items 2, 30, 42 and 61 in the original test, made up of 67 items, were eliminated because they had an item-test correlation less than 0.20. For this reason, the definitive test has 63 items. The five factors of this definitive test explain the 36% total variance and the 115% common estimated variance. These results seem to support a configuration of five different factors in the test (Harman, 1980; Ferrando, 1993). The five factors found consist of items related to the following aspects: pernicious effects on health due to behavioural risk factors; psychosocial advantages on drinking alcohol; advantages of smoking as perceived by the smoker; disadvantages perceived on following healthy behaviour in eating, exposure to the sun and protection at work; advantages and disadvantages of weight control. Table 2 shows the matrix of the rotated factors and the weights of the items in each of the factors. The weights of items with saturations lower than 0.35, if they were present in more than one factor, were eliminated to achieve greater clarity.
AQ1
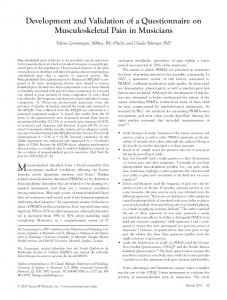
Table 3 shows the internal consistency of the items for each factor in the scale. The average value of the intraclass correlation coefficient was 0.7721 (P < 0.0001, 95% CI 0.6311–0.8592). On analysing the variables quantitatively, the average total score of the attitude to the advice of primary prevention of cancer in both surveys was x1 = 246.98 (SD1 = 21.83) yx2 = 244.47 (SD2 = 21.88). The average scores found were x1 = 3.13 y x2 = 3.11, respectively. The correlation study obtained a Pearson’s correlation coefficient of r = 0.761 (P < 0.001) and a determination coefficient of R2 = 0.58. Figure 1 shows the scatter graph. On comparing the average of the average scores obtained in each survey (Student’s test for matched pairs), no statistically significant differences were found (x1 = 3.92, SD1 = 0.35; x2 = 3.88, SD2 = 0.35; P = 0.195).
Table 2
Matrix of rotated factors
Item No. 1 36 33 64 54 22 40 44 13 34 60 66 16 58 18 24 38 28 62 20 65 56 1 11 21 19 17 12 14 15 5 4 3 7 10 8 9 6 31 29 26 23 45 49 52 25 55 32 43 63 27 67 57 59 47 48 51 46 37 35 50 39 53 41
2
Factor 3
4
5
0.605 0.576 0.494 0.493 0.485 0.475 0.459 0.449 0.444 0.437 0.436 0.432 0.386 0.379 0.361 0.358 0.353 0.346 0.339 0.333 0.312 0.310 0.308 0.728 0.701 0.685 0.648 0.612 0.460 0.186 0.856 0.818 0.816 0.807 0.645 0.311 0.216 0.662 0.636 0.611 0.562 0.469 0.397 0.375 0.358 0.356 0.332 0.327 0.321 0.311 0.283 0.273 0.247 0.226 0.598 0.550 0.539 – 0.467 – 0.424 0.391 – 0.327 0.307 – 0.271
Table 4 shows the discrimination indexes of difficulty/ ease in Samejima’s model for items that incorporate the five factors detected.
Attitude to primary prevention of cancer Lo´pez et al. 5
Discussion The double aim of our study meant using both the qualitative (to construct culturally adapted attitude items) and the quantitative method (to validate the questionnaire drawn up in that way), according to the concept of appropriate methodology proposed by McKinlay (1992). Redundant information was obtained in the qualitative research from patient number 36 on, and so, following Pope et al. (2000), on reaching patient number 48 it was estimated that there was enough information available to make the components of an attitude scale to cancer prevention, adapted to the sociocultural characteristics of the patients. The thematic classification of the answers and their ordering by frequency achieved a high consistency among the classifiers, probably due to the precision of the open questions: it was only necessary to resort to consensus in less than 5% of the answers. The five factors found in the factorial analysis explain the 36% total variance and the 115% estimated common variance. That is to say, these five factors explain the whole variance that the 63 items have in common. An Table 3 Factor 1 2 3 4 5
Cronbach’s a values a coefficient
Average
SD
0.93 0.87 0.85 0.85 0.80
94.82 27.64 28.07 58.86 32.70
9.64 4.86 6.05 8.96 4.23
estimated common variance higher than 80% would be sufficient to accept underlying dimensions (Yela, 1997), so the results of the factorial analysis carried out in the quantitative research allow us to accept the following five dimensions or factors: The first factor groups 23 items that fundamentally express the pernicious effects of the behavioural risk factors on health, in the three classic dimensions (physical, mental and social), and the advantages of healthy and preventive behaviours in the field of diet, exposure to the sun and work. Examples of these items are: ‘Smoking increases the risk of having lung cancer’, ‘Drinking alcohol to excess raises blood pressure’, ‘A diet rich in vegetables helps to control cholesterol’, ‘Maintaining correct weight prevents many illnesses’, ‘The sun helps to produce wrinkles in the skin’ or ‘Many cancers would be avoided if workers protected themselves from toxic substances’. The second factor, with some exceptions, groups seven items related to alcohol, which express the social benefits (relationships with others) and psychological benefits (element of pleasure, relaxation and lack of inhibition) that the drinkers perceive. Some examples are: ‘Thanks to alcohol I can lose my inhibitions’, ‘Drinking alcohol helps me to mix with other people’ and ‘Drinking alcohol relaxes me’. The third factor groups another seven items, all related to tobacco, and most express the advantages of smoking. This group includes items like ‘Smoking relaxes me’, ‘If I
Fig. 1
5.0
Survey 1
4.5
4.0
3.5 R2 = 0.58 P < 0.001 3.0 3.0
3.5
4.0 Survey 2
Scatter graph of the scores obtained in both surveys.
4.5
5.0
6 European Journal of Cancer Prevention 2003, Vol 12 No 00
Table 4 Factor 1
2
3
4
5
Indexes of discrimination and difficulty/ease Item No
Discrimination
Difficulty
Ease
1 11 13 16 18 20 22 24 28 33 34 36 38 40 44 54 56 58 60 62 64 65 66 5 12 14 15 17 19 21 3 4 6 7 8 9 10 23 25 26 27 29 31 32 43 45 47 49 52 55 57 59 63 67 35 37 39 41 46 48 50 51 53
1.51 0.14 2.30 1.61 1.11 1.39 2.21 2.04 1.11 2.10 2.09 2.36 1.64 1.62 2.19 1.92 1.46 1.44 1.47 0.88 1.27 0.16 1.29 0.26 2.25 1.99 1.37 2.40 2.65 2.43 4.22 5.03 0.26 3.26 2.23 0.25 3.29 1.58 1.31 1.79 0.61 1.68 1.81 1.11 0.98 0.94 0.38 0.91 0.80 1.08 0.48 0.72 0.85 0.71 0.49 0.66 0.24 0.25 1.70 2.75 1.36 1.94 1.07
– 0.09 10.87 0.16 0.60 0.68 0.76 0.19 0.01 1.55 0.78 0.47 0.57 0.88 1.05 0.49 0.70 1.13 1.29 0.92 1.94 1.68 14.62 1.57 0.12 2.79 3.00 3.23 2.17 2.44 1.80 1.74 1.63 – 0.34 1.90 2.45 2.47 1.74 2.21 3.30 2.10 2.70 1.93 1.93 3.77 4.20 2.69 4.69 4.48 3.99 3.35 4.87 4.93 5.10 5.36 5.17 3.76 14.07 12.33 1.51 0.84 0.82 1.39 0.91
– 3.02 – 4.34 – 2.39 – 2.61 – 4.20 – 2.68 – 3.06 – 2.96 – 3.95 – 2.57 – 2.09 – 2.71 – 2.75 – 3.25 – 2.37 – 5.02 – 3.32 – 4.31 – 3.73 – 4.36 – 3.52 – 9.88 – 3.48 – 11.58 – 0.61 – 0.82 – 0.22 – 0.70 – 0.47 – 0.73 0.08 0.03 – 12.91 0.12 0.36 – 11.23 0.17 – 0.86 – 0.68 – 1.20 – 3.31 – 1.23 – 1.37 – 0.61 – 1.35 – 2.38 – 7.79 – 2.14 – 2.64 – 1.57 – 6.62 – 3.34 – 2.36 – 2.85 – 4.17 – 3.33 – 5.91 – 7.21 – 2.63 – 2.77 – 3.44 – 2.91 – 5.29
can’t smoke I get into a bad mood’ and ‘Thanks to smoking I can bear stress’. The fourth factor groups 17 items that, in general, express the disadvantages perceived for having healthy behaviour, in the field of diet, exposure to the sun and
protection at work. This factor has items like the following: ‘Eating vegetables prevents you from having a varied diet’, ‘The sacrifice necessary to maintain correct weight is too great’, ‘Sun creams are too expensive’ and ‘When a worker wears protection he works worse’. Finally, most of the items grouped in the fifth factor refer to the advantages and disadvantages of maintaining a correct weight, controlling the amount of fat in the diet: it expresses advantages and disadvantages related to selfimage and different social benefits. Some of the nine items in this factor are: ‘Meals with fat satisfy more’, ‘Thin people find clothes more easily’ and ‘Thin people pick up partners more easily than fat people’. The analyses carried out give sufficient reliability to the test. The Cronbach’ a values show a high internal consistency, given that none of them were lower than 0.80, and the stability study did not find significant differences between the data provided by the first and second survey. Although the items that measure the attitude variable were collected qualitatively, from the practical point of view it is useful to obtain a total or average score for each individual, with a view to studying, for example, if the said score varies with the passing of time, or because of an educative intervention. However, there is controversy over whether averages and percentages can or cannot be calculated with numbers that indicate the position of somebody on a scale that measures a qualitative variable (Macnaughton, 1996). To avoid debate, the variables have been analysed as qualitative and as quantitative ones. The result was the same: using both methods, the repeatability of the answers was confirmed. On the other hand, the aim of our study was not to evaluate the patients’ attitude, but to construct and validate a questionnaire on attitude: the scores obtained cannot and must not be generalized to any population as they have only served to confirm the stability of the answers. With relation to the discriminating power of the items, based on Samejima’s model, it is known that the higher the discriminating value, the greater the capacity of the item to classify the individuals according to their attitude to cancer prevention. This discriminating power is independent of the sample used (unless the sample is intentionally different from the general population) and can, therefore, be extrapolated to the whole population. The higher the value obtained in the Difficulty analysis, the harder it is for the individuals to choose the healthiest option in the Likert scale. That is to say, the people surveyed will tend to ‘disagree’ or ‘completely disagree’ with the items that express healthy attitudes. In contrast,
Attitude to primary prevention of cancer Lo´pez et al. 7
the smaller the value obtained in the Ease analysis, the easier it will be for the individuals to choose the least healthy option, the option with the highest health risk. That is to say, the individuals will tend to ‘agree’ or ‘completely agree’ with the items that express unhealthy attitudes. Finally, the wider the interval whose limits are the difficulty and ease values, the harder it will be for an educative intervention to modify the attitude and point it towards the healthiest option. If we take item number 65 from Table 4 as an example, (‘a lot of time is wasted with protection at work’), it can be said that: (a) it has only slight discriminating power; and (b) it is the easiest item. That is to say, it is quite likely that many people really think that protection at work wastes time, and it is also likely that this opinion will be very difficult to modify. Difficulty 14.62 – Ease ( – 9.88) -24.5 points between the extreme values. However, analysis of item number 34 from Table 4 (‘A high-fat diet harms the health of the heart’) shows: (a) good discriminating power; and (b) it is the least easy item. That is to say: It is unlikely that people will disagree with this item. Besides, in this case Difficulty 0.47 – Ease ( – 2.09) -2.56 point distance. This amount is so small that it is likely that an educative intervention could manage to change the attitude of those that disagree with the item. Item number 1 from Table 4 (‘smoking increases the risk of getting lung cancer’) has a very low difficulty value ( – 0.09). That is to say, it is quite likely that many people agree with this item. In addition, although the Ease value for having the opposite opinion is not one of the lowest, the small difficulty–ease interval (( – 0.09) – ( – 3.02)) 2.93 point distance, suggests that an educative intervention would be likely to change the attitude to the healthy option. The interpretation of the items in the rest of the factors is analogous. Although the samples used in this type of study do not have to be representative of the population (Pope et al., 2000), the study group should deliberately fit the bill (Greenhalgh and Taylor, 1997), there are more women than men in our samples, and people with primary education are less represented. Perhaps for that reason the final questionnaire is more adapted to women with a medium-high cultural level, who are usually the ones that most frequently enrol in preventive cancer programmes in our region.
Conclusion The questionnaire items group the advantages and disadvantages of following the ECC primary prevention advice as perceived by the patients; advantages and
disadvantages that shape the attitude and predict the preventive behaviour. The results of the validation of the questionnaire confirm that the test is suitable, at least to evaluate the attitude of the population of the north of Spain with relatives affected by cancer, to the primary prevention advice included in the ECC. In later research it would be desirable to check if the questionnaire has the same usefulness for evaluating men’s attitude as for women’s, independently of the cultural level, and if it is valid to be used with other Spanish and European populations. This is suggested because Samejima’s test is universal but the advantages and disadvantages perceived on preventing cancer could vary depending on culture. In this case, it would be necessary to construct new socially and culturally adapted tests, useful for tailoring the preventive educative interventions to the attitude of specific populations, and for measuring the effect of the interventions on the said attitude.
Acknowledgements The authors gratefully acknowledge the collaboration of the patients involved, and the funding from the FISS (ref. 01/0311) and FICYT (ref. FC-02-PC-SPV01-14).
References Audrain J, Rimer B, Cella D, et al. (1999). The Impact of a brief coping skills intervention on adherence to breast self-examination among first-degree relatives of newly diagnosed breast cancer patients. Psychooncology 8:200– 209. Bolman C, De Vries H (1998). Psychosocial determinants and motivational phases in smoking behavior of cardiac inpatients. Prev Med 27:738–747. Brug J, Lechner L, De Vries H (1995). Psychosocial determinants of fruit and vegetable consumption. Appetite 25:285–296. Burnard P (1991). A method of analysing interview transcripts in qualitative research. Nurse Educ Today 11:461–466. Del Valle MO, Lo´pez ML, Herrero FJ, et al. (1999). Conocimiento y pra´ctica del Co´digo Europeo contra el Ca´ncer en una poblacio´n rural asturiana. Rev Oncol 1:133–139. Etter JF, Humair JP, Bergman MM, Perneger TV (2000). Development and validation of the attitudes towards smoking scale (ATS-18). Addiction 95:613–625. Ferrando PJ (1993). Introduccio´n al Ana´lisis Factorial. Barcelona: PPU. Fishbein M, Ajzen I (1975). Belief, Attitude, Intention and Behavior: An Introduction to Theory and Research. Reading, MA: Addison-Wesley. Garcı´a-Cueto E (1993). Introduccio´n a la Psicometrı´a. Madrid: Ed Siglo XXI. Greenhalgh T, Taylor R (1997). Papers that go beyond numbers (qualitative research). BMJ 315:740–743. Hailey BJ, Carter CL, Burnett DR (2000). Breast cancer attitudes, knowledge, and screening behavior in women with and without a family history of breast cancer. Health Care Women Int 21:701–715. Harding G, Gantley M (1998). Qualitative methods: beyond the cookbook. Fam Pract 15:76–79. Harman H (1980). Ana´lisis Factorial Moderno. Madrid: Salte´s. Howell SL, Nelson-Marten P, Krebs LU, Kaszyk L, Wold R (1998). Promoting nurses’ positive attitudes toward cancer prevention/screening. J Cancer Educ 13:76–84. Kristeller JL, Hebert J, Edmiston K, et al. (1996). Attitudes toward risk factor behavior of relatives of cancer patients. Prev Med 25:162–169. Krueger RA (1994). Focus Groups A Practical Guide for Applied Research, 2nd edn. California: Sage. Linden WJ, Hambleton RK (1997). Handbook of Modern Item Response Theory. New York: Springer.
8 European Journal of Cancer Prevention 2003, Vol 12 No 00
Lo´pez ML, Del Valle MO, Cueto A (1994). Knowledge of the European Code against Cancer in sixth-form pupils and teachers in Asturias (Spain). Eur J Cancer Prev 3:207–213. Macnaughton RJ (1996). Numbers, scales, and qualitative research. Lancet 347:1099–1100. Mays N, Pope C (2000). Qualitative research in Health Care. Assessing quality in qualitative research. BMJ 320:50–52. McKinlay JB (1992). Health Promotion through healthy public policy: the contribution of complementary research methods. Can J Pub Health 83(Suppl 1):S11–S19. Miles M, Huberman A (1984). Qualitative Data Analysis. A Sourcebook of New Methods. California: Sage Publications. Pope C, Ziebland S, Mays N (2000). Qualitative research in health care. Analysing qualitative data. BMJ 320:114–116. Prochaska JO (1991). Assessing how people change. Cancer 67:805–807. Prochaska JO (1992). What causes people to change from unhealthy to healthyenhancing behaviour? In: Heller T, Bailey L, Pattinson S (editors): Preventing Cancers. London: Open University Press; pp. 147–154. Rodrı´guez F, Gutie´rrez-Fisac JL (2000). El estado de salud y sus determinantes: evaluacio´n de los objetivos 1 a 12. In: Alvarez C, Peiro S (edtiors): Informe SESPAS 2000: La Salud Pu´blica Ante los Desafı´os de un Nuevo Siglo. Granada: Escuela Andaluza de Salud Pu´blica; pp. 43–50.
Ryan EL, Skinner CS (1999). Risk beliefs and interest in counselling: focus-group interviews among first-degree relatives of breast cancer patients. J Cancer Educ 14(2):99–103. Samejima F (1997). Graded Response Model. In: Van der Linden WJ, Hambleton RK (editors): Handbook of Modern Item Response Theory. New York: Springer. Smith CF, Williamson DA, Womble LG, Johnson J, Burke LE (2000). Psychometric development of a multidimensional measure of weight-related attitudes and behaviors. Eat Weight Disord 5:73–86. Van Assema P, Pieterse M, Kok G, Eriksen M, De Vries H (1993). The determinants of four cancer-related risk behaviours. Health Educ Res 8:461– 472. Veronesi U, Tubiana M, Boyle P, et al. (2000). Co´digo Europeo contra el Ca´ncer. http://www.telescan.nki.nl/code/sp_code.html. Wardle J, Steptoe A, Smith H, et al. (1995). Breast self-examination: attitudes and practices among young women in Europe. Eur J Cancer Prev 4:61–68. Weston R (1999). Intervention and prevention. Eur J Cancer Prev 8:373–375. Willoughby FW, Edens JF (1996). Construct validity and predictive utility of the stages of change scale for alcoholics. J Subst Abuse 8:275–291. Yela M (1997). La Te´cnica del Ana´lisis Factorial. Madrid: Biblioteca Nueva.
AQ2
AQ3
AUTHOR QUERY FORM
LIPPINCOTT WILLIAMS AND WILKINS JOURNAL NAME ARTICLE NO:
CEJ 2002-244
2/17/03
QUERIES AND / OR REMARKS Query No
Details Required
AQ1
What is 'y'?
AQ2
Samejima 1997 - please insert page numbers.
AQ3
Insert ‘date accessed’ (this link is no longer live?).
AQ4
Please check 42 and 61 in table 1.
Authors Response
1