for determination of veterinary drug residues in bovine muscle ... 2014 /Revised: 26 November 2014 /Accepted: 1 December 2014 /Published online: 27 December 2014 ... erinary drug residues, representing at least 13 different classes,.
Anal Bioanal Chem (2015) 407:4423–4435 DOI 10.1007/s00216-014-8386-3
RESEARCH PAPER
Validation of a streamlined multiclass, multiresidue method for determination of veterinary drug residues in bovine muscle by liquid chromatography–tandem mass spectrometry Marilyn J. Schneider & Steven J. Lehotay & Alan R. Lightfield
Received: 22 October 2014 / Revised: 26 November 2014 / Accepted: 1 December 2014 / Published online: 27 December 2014 # Springer-Verlag Berlin Heidelberg (outside the USA) 2014
Abstract Multiclass, multiresidue methods are becoming increasingly popular in regulatory monitoring programs due to their increased analytical scope and laboratory efficiency. In this work, we report the development and validation of a new high-throughput analytical method to monitor up to 131 veterinary drug residues, representing at least 13 different classes, in bovine muscle. This novel method streamlined sample preparation to 10 %, average recoveries outside 70–120 %, RSDr >20 %, RSDR >30 %, and HR >1.0 %False Neg, n=30 1n=29
%Recovery (%RSDR), n=30 Level X (ng/g) LOQ (ng/g) 0.5X
1X
2X1
0.5X 1X
Overall results, n=89
2X1 Overall %Recovery %RSDr %RSDR HR
Fluoroquinolones Ciprofloxacin
50
2.7
91 (35)
87 (16)
93 (39)
0
0
0
0
90
11
29
Desethylene ciprofloxacin
100
2.9
87 (20)
85 (8)
91 (35)
0
0
0
0
87
11
23
1.0
Danofloxacin
200
94 (2)
88 (13)
95 (29)
0
0
0
0
92
8
20
0.8
Difloxacin
10
1.2
50
3.6
94 (10)
85 (30)
92 (4)
10
7
3
7
90
12
21
0.6
Enrofloxacin
100
6.6
95 (10)
91 (12)
94 (12)
0
0
0
0
93
8
12
0.5
Norfloxacin
50
2.7
93 (25)
87 (6)
89 (19)
0
0
0
0
90
11
19
0.7
Orbifloxacin
50
3.1
103 (5)
99 (4)
98 (6)
0
0
0
0
100
9
9
0.2
Sarafloxacin
50
3.8
95 (9)
90 (12)
93 (13)
7
0
0
2
93
11
12
0.5
Sulfonamides Sulfabromomethazine
100
1.9
106 (18)
104 (7)
104 (17)
0
0
0
0
105
5
13
0.6
Sulfachloropyridazine
100
4.9
105 (7)
100 (13)
106 (2)
0
0
0
0
104
9
10
0.3
Sulfadiazine
100
107 (12)
99 (16)
102 (8)
0
0
0
0
103
5
14
0.5
Sulfadimethoxine
100
20
1.9
106 (19)
102 (22)
103 (19)
0
0
0
0
104
5
18
0.9
Sulfadoxine
100
19
107 (11)
101 (13)
102 (13)
0
0
0
0
103
4
14
0.5
Sulfaethoxypyridazine
100
3.9
108 (3)
102 (14)
103 (8)
0
0
0
0
104
4
12
0.4
Sulfamerazine
100
1.8
113 (7)
103 (7)
104 (16)
3
0
0
1
107
5
16
0.5
Sulfamethazine
100
4.4
106 (9)
103 (11)
104 (14)
0
0
0
0
105
5
11
0.5
Sulfamethizole
100
4.5
105 (12)
100 (15)
99 (13)
0
0
0
0
101
5
15
0.6
Sulfamethoxazole
100
4.2
108 (12)
103 (4)
108 (7)
0
0
0
0
106
8
10
0.3
Sulfamethoxypyridazine
100
4.5
106 (9)
101 (2)
102 (7)
0
0
0
0
103
6
9
0.3
Sulfanilamide
100
2.9
110 (36)
103 (3)
103 (22)
30
23
31
28
105
12
24
0.9
Sulfanitran
100
2.2
106 (60)
106 (10)
99 (12)
7
0
0
2
104
10
33
1.1
Sulfapyridine
100
0.9
106 (14)
102 (14)
102 (11)
0
0
0
0
104
6
13
0.6
Sulfaquinoxaline
100
3.1
109 (11)
100 (33)
104 (19)
0
0
0
0
104
5
23
0.9
Sulfathiazole
100
0.8
105 (8)
99 (20)
100 (14)
0
0
0
0
102
5
15
0.6
Tetracyclines Chlortetracycline Doxycycline
1000
91
61 (23)
56 (20)
56 (34)
0
0
0
0
58
8
27
1.6
100
20
65 (21)
61 (25)
63 (26)
0
0
0
0
63
9
22
1.1
Oxytetracycline
1000
40
61 (4)
56 (5)
54 (18)
0
0
0
0
57
7
20
0.6
Tetracycline
1000
105
70 (11)
65 (8)
61 (33)
0
0
0
0
65
8
26
1.1
Macrolides/lincosamides Clindamycin
100
5.4
103 (6)
100 (3)
105 (2)
0
0
0
0
103
5
7
0.2
Erythromycin
100
2.6
108 (9)
101 (1)
104 (11)
0
0
0
0
104
6
12
0.3
Gamithromycin
100
6.0
99 (14)
90 (17)
101 (7)
0
0
0
0
97
10
20
0.6
Lincomycin
100
3.1
102 (5)
98 (10)
99 (18)
0
0
0
0
100
4
12
0.5
Pirlimycin
300
96 (5)
93 (8)
94 (10)
0
0
0
0
94
5
8
0.4
Tildipirosin
100
43 (74)
56 (43)
73 (56)
0
0
0
0
57
32
85
2.5
12 3.8
Tilmicosin
100
6.4
106 (11)
102 (5)
107 (8)
3
3
0
2
105
6
10
0.4
Troleandomycin
150
2.3
117 (11)
112 (9)
111 (1)
0
0
0
0
113
13
11
0.3
Tulathromycin Tylosin
1000 200
283 6.3
70 (85)
73 (33)
80 (28)
0
0
0
0
74
18
50
3.0
95 (14)
91 (8)
94 (14)
0
0
0
0
93
14
13
0.6
β-Lactams/cephalosporins Amoxicillin
10
0.5
84 (8)
74 (25)
67 (12)
27
7
3
12
75
19
34
0.5
Ampicillin
10
0.7
83 (28)
86 (39)
82 (28)
20
7
10
12
84
22
29
1.0
Cefazolin
100
6.0
106 (8)
99 (19)
96 (9)
3
0
0
1
100
10
18
0.5
Cephapirin
100
1.1
85 (4)
80 (5)
72 (44)
0
0
0
0
79
16
31
0.8
Desacetyl cephapirin
100
1.5
127 (4)
115 (6)
110 (12)
10
0
0
3
117
18
20
0.3
4426
M.J. Schneider et al.
Table 1 (continued) Class Drug analyte
%False Neg, n=30 1n=29
%Recovery (%RSDR), n=30 1X
2X1
104 (25)
103 (21)
94 (5)
10
10
10
10
101
16
22
0.5
53 (68)
48 (3)
44 (76)
10
7
17
11
48
30
56
2.7
Level X (ng/g) LOQ (ng/g) 0.5X Cloxacillin
10
0.4
0.5X 1X
2X1 Overall %Recovery %RSDr %RSDR HR
DCCD (ceftiofur metabolite)
400
Dicloxacillin
100
1.0
104 (13)
102 (16)
101 (15)
0
0
0
0
102
8
13
0.6
Nafcillin
100
1.3
106 (4)
100 (8)
102 (19)
0
0
0
0
103
5
13
0.5
Oxacillin
100
1.1
103 (4)
97 (7)
99 (22)
0
0
0
0
100
5
14
0.5
0
0
0
0
Incurred in samples
Penicillin G
50
31
Overall results, n=89
Incurred in samples
Phenicols 101 (7)
87 (89)
93 (64)
80
73
66
73
93
23
56
1.7
Florfenicol
Chloramphenicol
300
13
106 (1)
102 (18)
105 (11)
0
0
0
0
104
10
12
0.5
Florfenicol amine
300
17
106 (4)
91 (7)
88 (19)
0
0
0
0
95
9
29
0.5
40
27
31
33
132
38
142
4.5
20
7
17
105
26
36
1.2
100 100 100
109
10
17
0.8
103
9
26
1.2
Thiamphenicol
10
10
1.7
1.1
146 (211) 131 (124) 120 (103)
3.0
113 (43)
101 (15)
103 (42)
23
111 (21)
104 (11)
112 (11)
100
109 (22)
102 (3)
97 (37)
0
Thyreostats 2-Mercaptobenzimidazole
25
2-Thiouracil
400
6-Methyl-2-thiouracil
400
6-Propyl-2-thiouracil
50
6-Phenyl-2-thiouracil
400
24 5.2 2.1 35
0
0
0
117 (40)
103 (33)
110 (35)
10
0
0
3
110
16
36
1.4
109 (9)
102 (17)
107 (6)
0
0
0
0
106
7
13
0.6
β-Agonists Cimaterol
10
0.1
106 (13)
101 (19)
101 (3)
0
0
0
0
103
11
14
0.4
Clenbuterol
10
0.8
113 (48)
104 (20)
104 (15)
7
3
0
3
107
11
31
0.8
Ractopamine
30
1.1
109 (10)
100 (8)
103 (10)
3
0
0
1
104
9
14
0.3
Salbutamol
10
0.1
104 (18)
96 (16)
93 (11)
0
0
0
0
98
11
21
0.5
Zilpaterol
12
0.2
103 (8)
93 (6)
87 (10)
7
0
0
2
95
14
24
0.3
Anthelmintics Abamectin-Na
20
1.8
93 (75)
85 (77)
87 (66)
10
10
0
7
88
19
65
2.5
Albendazole (ALBZ)
50
1.7
102 (14)
100 (11)
104 (12)
0
0
0
0
102
6
12
0.5
ALBZ sulfoxide
50
2.2
114 (1)
109 (11)
109 (3)
0
0
0
0
111
5
9
0.2
ALBZ sulfone
50
2.0
111 (2)
106 (3)
107 (11)
0
0
0
0
108
5
9
0.2
ALBZ 2-aminosulfone
50
1.1
107 (22)
104 (12)
103 (10)
3
0
0
1
105
6
15
0.6
Bithionol
10
0.4
67 (49)
71 (25)
77 (42)
23
7
0
10
72
18
40
1.2
Cambendazole
10
0.6
108 (14)
106 (10)
108 (12)
0
0
0
0
107
6
11
0.4
Clorsulon
100
5.7
102 (36)
98 (32)
106 (23)
13
3
0
6
102
13
29
1.3
Closantel
50
0.4
82 (23)
78 (23)
82 (21)
0
0
0
0
81
13
21
0.9
Doramectin-Na
30
1.3
97 (12)
82 (60)
83 (65)
10
17
7
11
87
19
50
1.8
Emamectin Eprinomectin
10
0.1
99 (25)
95 (6)
98 (2)
0
0
0
0
97
12
14
0.3
100
2.8
108 (22)
98 (55)
99 (32)
20
0
0
7
102
20
36
1.6 0.5
Fenbendazole
400
6.5
106 (11)
102 (13)
102 (6)
0
0
0
0
103
4
11
Fenbendazole sulfone
400
8.6
110 (4)
106 (7)
107 (4)
0
0
0
0
108
4
7
0.3
10
0.2
107 (8)
104 (8)
107 (1)
0
0
0
0
106
5
7
0.2
20
13
0
11
97
15
28
0.4
0
0
0
0
103
5
13
0.6
80
53
31
55
105
31
88
3.0 0.5
Flubendazole 2-Amino-flubendazole Haloxon Ivermectin-B1a Levamisole
10
0.8
106 (9)
90 (24)
93 (6)
100
1.1
105 (14)
100 (12)
103 (13)
10
4.9
115 (35)
102 (131) 101 (115)
100
2.8
106 (6)
101 (14)
105 (16)
0
0
0
0
104
5
13
Mebendazole
10
0.4
112 (7)
109 (10)
109 (10)
0
0
0
0
110
7
9
0.3
2-Amino-mebendazole
10
0.8
93 (28)
97 (10)
95 (6)
0
0
0
0
95
28
16
0.4
Morantel Moxidectin
100
6.9
99 (8)
98 (13)
103 (7)
0
0
0
0
100
5
11
0.4
50
7.8
110 (74)
88 (56)
77 (69)
70
80
34
62
90
47
77
2.7
Niclosamide
10
0.2
89 (34)
92 (12)
95 (7)
3
0
0
1
92
8
20
0.5
Nitroxynil
50
1.4
89 (64)
92 (23)
92 (28)
0
0
0
0
91
9
37
1.5
Oxfendazole
800
Oxibendazole
10
31 0.6
111 (7)
104 (6)
103 (3)
0
0
0
0
106
4
12
0.3
110 (6)
108 (18)
105 (21)
3
0
0
1
108
8
15
0.5
Validation of a streamlined multiclass, multiresidue method
4427
Table 1 (continued) Class Drug analyte
%False Neg, n=30 1n=29
%Recovery (%RSDR), n=30 Level X (ng/g) LOQ (ng/g) 0.5X
1X
2X1
0.5X 1X
Overall results, n=89
2X1 Overall %Recovery %RSDr %RSDR HR
Oxyclozanide
10
0.3
75 (76)
80 (14)
83 (12)
10
0
0
3
80
12
40
1.0
Rafoxanide
10
0.3
70 (13)
65 (20)
70 (57)
23
23
14
20
68
29
33
1.0
Selamectin
200
3.2
95 (21)
89 (42)
90 (46)
10
0
0
3
91
12
34
1.8
Thiabendazole
100
1.4
109 (8)
103 (10)
105 (11)
0
0
0
0
106
5
11
0.4
5-Hydroxy-thiabendazole
100
1.6
99 (18)
93 (24)
94 (23)
0
0
0
0
95
9
20
1.0
Triclabendazole
50
0.4
103 (7)
98 (11)
100 (9)
0
0
0
0
100
5
10
0.4
Triclabendazole sulfoxide
50
1.3
99 (12)
100 (17)
99 (5)
3
0
0
1
99
9
10
0.4
Dimetridazole
10
0.4
102 (64)
100 (41)
107 (37)
7
3
0
3
103
13
43
1.5
Hydroxy-dimetridazole
50
0.8
108 (29)
106 (17)
111 (14)
3
0
0
1
108
10
19
0.8
Ipronidazole
10
0.5
108 (15)
105 (11)
106 (11)
7
0
0
2
106
6
12
0.4
Coccidiostats
Hydroxy-ipronidazole
10
0.6
108 (9)
102 (9)
101 (13)
50
67
45
54
104
12
13
0.3
100
0.7
85 (6)
81 (3)
83 (15)
0
0
0
0
83
8
10
0.4
Metronidazole
10
0.2
110 (16)
107 (12)
111 (9)
0
0
0
0
109
9
12
0.4
Hydroxy-metronidazole
10
0.3
110 (22)
98 (16)
96 (9)
0
0
0
0
101
57
25
0.5
Ronidazole
10
0.3
109 (9)
105 (10)
109 (13)
10
0
0
3
108
12
10
0.3 0.5
Lasalocid A
Tranquilizers Acetopromazine
10
0.5
90 (15)
84 (10)
88 (24)
3
3
0
2
87
16
18
Azaperone
10
0.7
103 (10)
105 (7)
111 (15)
3
0
0
1
106
12
15
0.3
Carazolol
10
0.5
99 (9)
96 (13)
103 (12)
0
0
0
0
100
7
14
0.4
Chlorpromazine
10
0.3
86 (27)
78 (10)
83 (19)
0
0
0
0
82
12
23
0.6
Haloperidol
10
0.3
107 (15)
101 (16)
105 (16)
3
0
0
1
105
6
16
0.5
Promethazine
10
0.3
93 (17)
86 (26)
86 (14)
0
0
0
0
88
10
21
0.6
Propionylpromazine
10
0.3
86 (19)
80 (23)
84 (13)
0
0
0
0
83
9
20
0.6
Triflupromazine
10
0.2
91 (19)
88 (18)
91 (11)
0
0
0
0
90
7
15
0.5
Xylazine
10
0.6
112 (46)
109 (52)
111 (43)
0
0
0
0
111
10
41
1.5
Anti-inflammatories Betamethasone
100
5.6
104 (23)
92 (29)
97 (45)
13
7
7
9
97
17
34
1.5
Diclofenac
200
0.8
98 (7)
94 (11)
97 (14)
0
0
0
0
96
3
11
0.5
Dipyrone metabolite
200
Chromatographic problem
Flunixin
25
0.3
104 (5)
99 (7)
100 (11)
0
0
0
0
101
4
10
0.3
Ketoprofen
10
0.7
109 (13)
99 (23)
90 (25)
0
0
0
0
99
23
31
0.7
Meloxicam
100
3.0
101 (12)
101 (14)
106 (4)
0
0
0
0
103
5
12
0.4
Oxyphenylbutazone
100
0.9
91 (21)
86 (26)
86 (25)
0
0
0
0
87
12
23
1.1 0.7
Phenylbutazone
100
0.5
89 (7)
81 (20)
82 (20)
0
0
0
0
84
10
20
Prednisone
100
5.2
109 (14)
100 (15)
105 (12)
10
3
0
4
104
12
16
0.6
Tolfenamic acid
200
1.8
98 (5)
92 (11)
95 (8)
0
0
0
0
95
3
10
0.4
Other Bacitracin
500
Carbadox
30
36 1.3
92 (15)
91 (13)
94 (20)
7
0
0
2
92
8
15
0.9
104 (13)
99 (19)
98 (21)
3
0
0
1
100
9
18
0.7 1.8
2-Quinoxalinecarboxylic acid
30
7.9
86 (77)
82 (39)
79 (32)
97
67
24
63
83
33
48
Melengestrol acetate
25
0.4
108 (3)
101 (12)
106 (14)
0
0
0
0
105
6
13
0.4
1000
6.3
97 (4)
93 (3)
96 (11)
0
0
0
0
95
4
9
0.4
Novobiocin Virginiamycin
100
1.4
103 (33)
100 (5)
107 (20)
3
0
0
1
103
7
22
0.8
β-Zearalanol
100
5.7
104 (14)
101 (19)
87 (9)
0
0
0
0
104
8
14
0.6
nine spikes were made at the 2X level by mistake). A reagent blank was also prepared on each day using 1.5 mL water (the approximate amount in 2 g bovine muscle [14]). To each sample, 100 μL of the 5 ng/μL internal standard mix was
added prior to extraction, but not to the pooled samples used for matrix-matched calibration standards (the drug analytes and internal standards were added to blank final extracts in that case).
4428
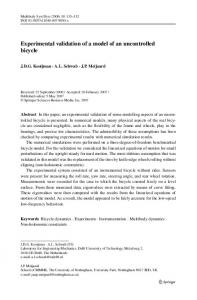
For sample preparation, samples were shaken (5 min) with 4/1 MeCN/H2O (10 mL) using a GlasCol (Terre Haute, IN; USA) pulsating vortex platform shaker (see Fig. 1, image 4) at 80 % speed and maximum pulsation. Then, centrifugation at 3,700 rcf was conducted for 5 min at room temperature. Extracts (0.4 mL) were pipetted into the shell portion of the in-filter autosampler vials containing 25 mg C18 sorbent. After partially depressing the plunger portion, the tray of vials was vortexed as before for 30 s, and the vial plungers were then depressed fully to achieve filtration prior LC-MS/MS analysis. This filter-vial d-SPE process is shown in Fig. 1. Taking into account the 1.5-mL water in the 2 g samples (yielding 11.5 mL volume after extraction), final extracts had a sample equivalence of 0.17 g/mL in ≈7:3 MeCN/water. LC-MS/MS analysis An Agilent (Little Falls, DE; USA) 1100 HPLC system coupled to an AB Sciex (Foster City, CA; USA) 6500 QTrap mass spectrometer was used in this study. A Phenomenex (Torrance, CA; USA) Kinetex core-shell C18 column (50×3 mm, 2.6 μm) coupled with a 3-mm i.d. coreshell C18 guard column was used for LC. Sample injection volume was 1 μL with the filter vials at room temperature in the autosampler tray. A divert valve directed column effluent to waste shortly before and after elution of the drug analytes, and during most of the system wash step. Column temperature was 40 °C and flow rate was 0.3 mL/min. The mobile phase was 0.1 % aqueous formic acid (A) and 0.1 % formic acid in MeCN (B), and the gradient was 2 %B for 0.1 min taken to 100 %B over the course of 8.0 min, and then held at 100 %B for 2.7 min. Injection (10 μL) of MeCN and autosampler needle wash was made during the re-equlibration/wash step between each sample injection to help reduce carryover.
Fig. 1 Steps of the filter-vial dispersive-SPE process: (1) 25 mg C18 contained in shell portion of the filter-vial; (2) addition of 0.4 mL of the extracts; (3) partial capping of the vials; (4) shaking of the tray for 30 s; (5) pressing of the vials; (6) final extracts ready for analysis
M.J. Schneider et al.
The MS instrument was operated in electrospray ionization (ESI) with positive and negative switching using scheduled multiple reaction monitoring (sMRM) with a 60-s retention time (tR) window. AB Sciex Analyst 1.6.2 software was used for instrument control. Curtain gas was set to 25 psi, collision gas was medium, ion spray voltage was 5,000 or −4,500 V in ESI+/− switching, source temperature was 425 °C, and source gases 1 and 2 were set at 60 psi. Other parameters for the ion transitions (typically 3) monitored for each analyte are provided in ESM Table S1. The optimized parameters for each drug analyte were determined via infusion of each analyte in 1/1 MeCN/water containing 0.1 % formic acid. Matrix-matched and reagent-only calibration standards were prepared each day during validation at tissue equivalent concentrations of 0X, 0.25X, 0.5X, 1X, 2X, and 3X. Although internal standards were added to the samples and standards, they were not needed for quantification purposes, and thus were only considered for quality control, demonstrating less than ±20 % deviation from the mean response. Each analytical sequence consisted of the 40 samples (10 each of 0X, 0.5X, 1X, and 2X spikes) plus the reagent blank, and 6 each matrixmatched and reagent-only calibration standards all of which were analyzed both before and after the samples (65 analyses per sequence plus an equal number of wash injections). Recoveries were calculated by comparison of peak areas of fortified samples with the matrix-matched calibration curve for that day. Matrix effects were determined as %difference between matrix-matched and reagent-only calibration standards. Estimated limits of quantification (LOQs) for the method were the concentrations with signal/noise (S/N) ratio of 10 extrapolated from the 0.5X spiking levels as measured by the instrument’s data processing software (AB Sciex MultiQuant 3.0).
Validation of a streamlined multiclass, multiresidue method
4429
Results and discussion LC method development In our previous multiclass, multiresidue veterinary drug analysis studies [4–6, 15], we had to conduct solvent evaporation of extracts during sample preparation in order to meet the 0.5X monitoring levels with the MS/MS instruments available to us. Recently, we have obtained a new model QTrap instrument, which enabled us to streamline our approach by eliminating the time-consuming solvent evaporation step without sacrificing LOQs. Quantification was a secondary consideration to screening/identification of the residues, but the new instrument gave us greater expectations for better quantitative capabilities with the method. Ideally, we would have simply used our previous UHPLC method [5], but we were unable to couple UHPLC with the new MS/MS instrument due to laboratory logistics. Instead, we used HPLC with a coreshell C18 column [16], which allowed us to adapt our UHPLC gradient ramp. Because the instrument software did not allow timed start of the infusion pump during the run, post-column infusion of ammonium formate could not be easily done to enhance ionization of late-eluting anthelmintics; thus, we did not pursue that feature of our previous UHPLC method [5]. One benefit of the previous solvent evaporation step was that the removal of MeCN from the extract better matched the initial highly aqueous reversed-phase LC conditions, which led to good peak shapes and tR reproducibility even for earlyeluting drug analytes [4–6]. In this study using the more sensitive instrument, we had to assess the combination of injection volume and aqueous dilution factor to achieve acceptable chromatographic performance and meet LOQ needs (we had no desire to lower detection limits below the regulatory levels of concern). Previously, we injected ≈20 mg equivalent sample tissue in the final extract [4, 5]. In this study, we compared different injection volumes and dilution factors with water and found that the instrument was able to meet FSIS target concentrations with >100-fold less injected sample equivalent, which led to our injection of merely 0.17 mg equivalent sample. Figure 2 exhibits the results of the injection/dilution experiment for the quantification ion of 2-thiouracil using a reagentonly standard equivalent to 0.17 mg injected sample (extracts were diluted with water to the same factor that injection volume was increased). The extraction method resulted in extracts with a solvent composition of ≈7/3 MeCN/water, and this situation is shown in the top chromatogram for a 1-μL injection. The lower three chromatograms show the effects of diluting final extracts 1/2, 1/4, and 1/10 with water, leading to the %MeCN amounts shown in Fig. 2. At least fourfold dilution with water was needed to avoid the initial plug of 2-thiouracil being carried unhindered through the
Fig. 2 Effect of injection volume (left column) of diluted extracts with water showing the resulting %MeCN in the injected final extracts on the chromatography of 2-thiouracil in reagent-only standard equivalent to 200 ng/g in sample
column by the MeCN surge from the injected solution. Among the other analytes, only florfenicol amine was affected in a similar way, and 1 μL injection of 7/3 MeCN/water gave good chromatography otherwise. No matrix interferences were observed for the quantification ions of florfenicol amine or 2-thiouracil in the chromatographic solvent front. Thus, we chose the most streamlined approach by simply injecting 1 μL of the undiluted final extracts after conducting filter-vial dSPE. In the cases of florfenicol amine and 2-thiouracil, we integrated the ion chromatograms as shown in Fig. 2 starting from the solvent front to the end of the peaks during data processing. Actually, this unique peak shape gave higher S/N and aided qualitative assessment of these early-eluting drugs, albeit reproducibility of peak areas was worse.
Sample preparation In a previous study [4], we compared several different extraction conditions, including assessment with incurred samples (real-world field samples containing veterinary drug residues). This provided the final optimized extraction conditions, which led to implementation by FSIS in the NRP [3]. We have observed no reason to change this simple, effective, and rapid (5 min) solvent extraction step, and our use of a pulsating
4430
vortexer (see Fig. 1) allowed shaking of 50 centrifuge tubes (50 mL) simultaneously in common carrying trays. After the initial extraction, we previously conducted liquidliquid partitioning with hexane (saturated with MeCN), in conjunction with d-SPE [4, 5] or not [6], to reduce fat content in final extracts. During method development experiments in this study, we demonstrated that the same recoveries (results not shown) were achieved if we added the 10-mL hexane (saturated with MeCN) during the initial 5-min extraction step with 10 mL 4/1 MeCN/water rather than post-extraction hexane-partitioning cleanup after the centrifugation step. This hexane co-extraction approach can be used to streamline the sample preparation if desired, and then a portion of the MeCN/ water extract may be taken for further filter-vial d-SPE cleanup, but we abandoned the former step for the following reasons: (1) oxyphenylbutazone, phenylbutazone, and other less hydrophilic drugs partially partitioned into the hexane, causing low and variable recoveries; (2) trace amounts of hexane appeared in the final extracts, which could adversely affect chromatography; and (3) the injection of >100-fold less sample equivalent than previously did not require as much cleanup to justify the extra time, effort, and cost of the hexane-partitioning step. Thus, our final method simply entailed 5 min each for extraction and centrifugation followed by a 30-s shake of 0.4 mL aliquots of extracts using filter-vial d-SPE in similar sample/C18 ratio and filter type as used separately before [4, 5]. All shaking and centrifugation steps, as well as pressing the d-SPE filter-vials, were done in batches, which led to streamlined sample preparation for high-sample throughput analysis. Although it took an analyst just over 3 h to prepare a batch of 40 pre-homogenized samples for LC-MS/MS analysis, most of the time was spent labeling the tubes/vials, weighing the samples, and preparing the 12 calibration standards. Laboratory waste merely consisted of a 50-mL polypropylene centrifuge tube, 3 for nonpermitted drugs). The screening analysis only required the concentration and tR criteria be met for the quantification ion, and these results are the same as reported for quantification. No false positives were observed by these criteria, but human review of automatic integrated peaks by the software may have eliminated some obvious interferences within the ±0.2-min tR window. Review of software-integrated peaks is an essential part of nearly any chromatographic analysis. For qualitative identification, the ion ratios were also taken into account. As reported previously [4, 5], the integrated peak area ratio for any pair of product ions had to be within ±10 % (absolute) of the reference ion ratio for the pair, and ion ratios within ±20 % (absolute) were required for any two pairs of ion ratios. The default reference ion ratios for each analyte were the average of the duplicate 1X, 2X, and 3X reagent-only calibration standards in the same analytical sequence. However, due to the adsorptive losses of some analytes on PVDF in the reagent-only standards (listed in Table 2), the high-level matrix-matched standards were used in those cases. In all cases, the signal of the lower intensity ion was divided by the higher intensity ion to ensure that the reference (average) ion ratio was less than 100 %. Although no false positives >0.1X concentration occurred in the study, an interesting finding was observed for ketoprofen. The weakest product ion (m/z 255 → 194) was used for quantification because the other ion transitions (see ESM Table S1) had substantial interferences even in the reagent blanks. The tR difference was consistently 0.08 min for the interfering ions from the quantification ion, which fell
within both the ±0.2 and ±0.1 min tR acceptability windows. Thus, identification criteria would have been met for all blank samples (including reagent blanks), except concentrations were undetermined due to the absence of the quantification ion. A similar situation occurred for cimaterol in our previous studies [4, 5], but different ion transitions for cimaterol were chosen in this study to resolve that problem. The same solution may be needed for ketoprofen in the future if the preferable use of UHPLC is not enough to better separate the reagent interferant from the analyte. With respect to false negatives, Table 1 and Fig. 5 provide the individual drug and overall results for the analytes in the study. Figure 5 does not include the dipyrone metabolite or 2thiouracil which both gave 100 % false negatives due to unreliable chromatography for dipyrone, as already mentioned, and poor sensitivity of the only diagnostic product ion for 2-thiouracil. In the latter case, 2-thiouracil is a small molecule (m/z 127) with only one strong product ion, so options were limited for identification purposes. The reagent-only chromatography of 2-thiouracil’s quantification ion in the final method is shown in Fig. 2 (top), and even though identification could not be made by the specified criteria, the unique peak shape was very helpful for the analyst to use human judgment for improved decision-making. No interferences were observed for that ion transition, and enforcement actions require additional analyses to confirm positive findings; thus, this method still meets minimum fitnessfor-purpose needs for 2-thiouracil. As observable in ESM Table S1, other drugs that only yielded two ion transitions consisted of 2-hydroxydimetridazole (precursor of m/z 158) and metronidazole (m/z 142). As shown in Table 1, only three false negatives occurred for those analytes; thus, this was not a hindrance in those cases. To help avoid possible interferences observed during method development, four product ions were monitored for emamectin, ivermectin, 6-methyl-2-thiouracil, morantel, norfloxacin, thiamphenicol, xylazine, and zilpaterol. Identification False Negatives
[3]. The approval of the growth-promoting drug by Codex was very controversial in 2012 [22], and ractopamine is still not permitted in the EU, China, Russia, Australia, New Zealand, and several other countries [3].
4433
14%
0.5X
1X
2X
12% 10% 8% 6% 4% 2% 0%
Day1
Day2
Day3
Overall
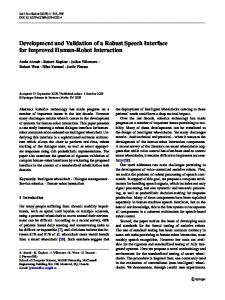
Fig. 5 Qualitative identification results from the validation experiments each day for 129 veterinary drugs fortified at three levels in the 18 bovine muscle samples (n=10 each day and level except n=9 at the 2X level on day 1, and n=89 overall). 2-Thiouracil and dipyrone metabolite were excluded from this assessment
4434
Otherwise, three ion transitions were monitored for the other drug analytes. Figure 5 shows the typical effect of decreasing rates of false negatives (reduced variability in ion ratios) as analyte concentrations increase. Furthermore, the worse results shown in Fig. 4 for quantification in the day 3 experiment are also apparent in the day 3 qualitative results. Even so, the overall rate of false negatives for the >11,400 data points for the analytes in spiked samples was 4.5 %, which is generally acceptable in monitoring programs. Table 1 provides the rates of false negatives combined over the 3 days and overall at the three spiking levels for qualitative identifications for each analyte. Rates of false negatives >10 % are listed in bold, with fourfold more false negatives occurring on day 3 than either of the other 2 days (see Fig. 5). For the most part, the same drugs that gave more variable quantitative results also yielded higher percentage of false negatives (see Table 1). These drug analytes include sulfanilamide, amoxicillin, ampicillin, DCCD, chloramphenicol, thiamphenicol, 2-mercaptobenzimidazole, doramectin, 2-amino-flubendazole, ivermectin, moxidectin, rafoxanide, hydroxy-ipronidazole, and 2-quinoxalinecarboxylic acid. All but a few of these drugs had 1X=10 ng/g, the lowest target level, which inherently yields greater variability than analytes at higher concentrations.
Conclusions This novel method with its rapid sample preparation coupled with sensitive detection provides an effective and efficient approach for simultaneously monitoring up to 131 veterinary drug residues in animal tissue. We calculated results normalized to internal standards or not, and no significant differences were observed, in part because we used matrix-matched calibration (even though matrix effects were minimal due to the injection of only 0.17 mg equivalent sample). Internal standards may be more important when using less sensitive instruments for diverse matrices. The method has been validated in bovine muscle in accordance with FSIS protocols, and it provides acceptably good recoveries and precision, 100 veterinary drug residues in bovine muscle by ultrahigh performance liquid chromatography-tandem mass spectrometry. J Chromatogr A 1258:43–54
Validation of a streamlined multiclass, multiresidue method 6. Schneider MJ, Lehotay SJ, Lightfield AR (2012) Evaluation of a multi-class, multi-residue liquid chromatography-tandem mass spectrometry method for analysis of 120 veterinary drugs in bovine kidney. Drug Test Anal 4(Suppl 1):91–102 7. Sporri AS, Jan P, Cognard E, Ortelli D, Edder P (2014) Comprehensive screening of veterinary drugs in honey by ultrahigh-performance liquid chromatography coupled to mass spectrometry. Food Addit Contam A 34:806–816 8. Zhan J, Xu D-M, Sun J, Xu Y-J, Ni M-L, Yin J-Y, Chen J, Yu X-J, Huang Z-Q (2013) Comprehensive screening for multi-class veterinary drug residues and other contaminants in muscle using column-switching UPLC-MS/MS. Food Addit Contam A 30:1888–1899 9. Robert C, Gillard N, Brasseur P-Y, Pierret G, Ralet N, Dubois M, Delahaut P (2013) Rapid multi-residue and multi-class qualitative screening for veterinary drugs in foods of animal origin by UHPLCMS/MS. Food Addit Contam A 30:443–457 10. Deng X-J, Yang H-Q, Li J-Z, Song Y, Guo D-H, Luo Y, Du X-N, Bo T (2011) Multiclass residues screening of 105 veterinary drugs in meat, milk, and egg using ultra high performance liquid chromatography tandem quadrupole time-of-flight mass spectrometry. J Liq Chromatogr Rel Technol 34:2286–2303 11. Biselli S, Schwalb U, Meyer A, Hartig L (2013) A multi-class, multianalyte method for routine analysis of 84 veterinary drugs in chicken muscle using simple extraction and LC-MS/MS. Food Addit Contam A 30:921–939 12. Aguilera-Luiz MM, Romero-González R, Plaza-Bolaños P, Martínez-Vidal JL, Garrido-Frenich A (2013) Wide-scope analysis of veterinary drug and pesticide residues in animal feed by liquid chromatography coupled to quadrupole-time-of-flight mass spectrometry. Anal Bioanal Chem 405:6543–6553 13. Han L, Sapozhnikova Y, Lehotay SJ (2014) Streamlined sample cleanup using combined dispersive solid-phase extraction and invial filtration for analysis of pesticides and environmental pollutants in shrimp. Anal Chim Acta 827:40–46 14. USDA Food Composition Database (http://ndb.nal.usda.gov/ndb/). Accessed Sept 2014 15. Schneider MJ, Mastovska K, Lehotay SJ, Lightfield AR, Kinsella B, Shultz CE (2009) Comparison of screening methods for antibiotics in beef kidney juice and serum. Anal Chim Acta 637:290–297
4435 16. Samanidou VF, Karageorgou EG (2011) On the use of Kinetex™C18 core-shell 2.6 μm stationary phase to multiclass determination of antibiotics. Drug Test Anal 3:234–244 17. Stahnke H, Kittlaus S, Kempe G, Alder L (2012) Reduction of matrix effects in liquid chromatography-electrospray ionization-mass spectrometry by dilution of the sample extracts: how much dilution is needed? Anal Chem 84:1474–1482 18. Morel-Salmi C, Julia A, Vigor C, Vercauteren J (2014) A huge PVDF adsorption difference between resveratrol and ε-viniferin allows to quantitatively purify them and to assess their anti-tyrosinase property. Chromatographia 77:957–961 19. Horwitz W, Albert R (2006) The Horwitz ratio (HorRat): a useful index of method performance with respect to precision. J AOAC Int 89:1095–1109 20. Feng S, Chiesa OA, Kijak P, Chattopadhaya C, Lancaster V, Smith EA, Girard L, Sklenka S, Li H (2014) Determination of ceftiofur metabolite desfuroylceftiofur cysteine disulfide in bovine tissues using liquid chromatography–tandem mass spectrometry as a surrogate marker residue for ceftiofur. J Agric Food Chem 62:5011–5019 21. Anderson CA, Rupp HS, Wu WH (2005) Complexities in tetracycline analysis—chemistry, matrix extraction, cleanup, and liquid chromatography. J Chromatogr A 1075:23–32 22. Bottemiller H (2012) Codex adopts ractopamine limits for beef and pork—contentious 69–67 vote on key trade issue pits United States against China and the EU. Food Safety News (www.foodsafetynews. com/2012/07/codex-votes-69-67-to-advance-ractopamine-limits-forbeef-and-pork/#.U_z5Ybl0xD8). Accessed Sept 2014 23. U.S. Food and Drug Administration (2003) Guideline for industry: mass spectrometry for confirmation of the identity of animal drug residues. Fed Regist 68:25617–25618, www.fda.gov/cvm/guidance/ guide118.pdf. Accessed Sept 2014 24. European Commission, Guidance document on analytical quality control and validation procedures for pesticide residues analysis in food and feed. SANCO/12571/2013 (www.eurl-pesticides.eu/). Accessed Sept 2014 25. Geis-Asteggiante L, Nunez A, Lehotay SJ, Lightfield AR (2014) Structural characterization of product ions by electrospray ionization and quadrupole time-of-flight mass spectrometry to support regulatory analysis of veterinary drug residues in foods. Rap Commun Mass Spectrom 28:1061–1081