Geosci. Model Dev., 4, 1019–1034, 2011 www.geosci-model-dev.net/4/1019/2011/ doi:10.5194/gmd-4-1019-2011 © Author(s) 2011. CC Attribution 3.0 License.
Geoscientific Model Development
Validation of modelled forest biomass in Germany using BETHY/DLR 1 , and B. C. Haller4 ¨ M. Tum1 , M. Buchhorn2,3 , K. P. Gunther 1 Deutsches
Zentrum f¨ur Luft- und Raumfahrt (DLR), Deutsches Fernerkundungsdatenzentrum (DFD), 82234 Oberpfaffenhofen, Germany 2 German Biomass Research Centre (DBFZ), Department Bioenergy Systems, Torgauer Strasse 116, 04347 Leipzig, Germany 3 Alfred Wegener Institute for Polar and Marine Research (AWI), Division: Geoscience and Periglacial Research, Telegrafenberg A43, 14473 Potsdam, Germany 4 Department of Biology and Redpath Museum, McGill University, 859 Sherbrooke Street West, Montreal, Quebec, H3A 2K6, Canada Received: 15 July 2011 – Published in Geosci. Model Dev. Discuss.: 26 July 2011 Revised: 7 November 2011 – Accepted: 14 November 2011 – Published: 18 November 2011
Abstract. We present a new approach to the validation of modelled forest Net Primary Productivity (NPP), using empirical data on the mean annual increment, or MAI, in above-ground forest stock. The soil-vegetation-atmospheretransfer model BETHY/DLR is used, with a particular focus on a detailed parameterization of photosynthesis, to estimate the NPP of forest areas in Germany, driven by remote sensing data from VEGETATION, meteorological data from the European Centre for Medium-Range Weather Forecasts (ECMWF), and additional tree coverage information from the MODIS Vegetation Continuous Field (VCF). The output of BETHY/DLR, Gross Primary Productivity (GPP), is converted to NPP by subtracting the cumulative plant maintenance and growth respiration, and then validated against MAI data that was calculated from German forestry inventories. Validation is conducted for 2000 and 2001 by converting modelled NPP to stem volume at a regional level. Our analysis shows that the presented method fills an important gap in methods for validating modelled NPP against empirically derived data. In addition, we examine theoretical energy potentials calculated from the modelled and validated NPP, assuming sustainable forest management and using species-specific tree heating values. Such estimated forest biomass energy potentials play an important role in the sustainable energy debate.
Correspondence to: M. Tum (
[email protected])
1
Introduction
Models of carbon uptake by plants play an important role in answering questions concerning the mechanisms driving the carbon cycle and the roles of terrestrial carbon sinks and sources (Cox et al., 1999). Carbon uptake by plants, measured as Gross Primary Productivity (GPP), can be predicted by simple models that describe the physical, chemical, and plant physiological processes of plant development, as well as the interactions between plants and the atmosphere. Such “deterministic” models (sometimes also called “mechanistic” or “Monteith-type” models) calculate photosynthesis following the methods of Monsi and Saeki (1953) and Monteith (1965). The idea behind these Monteith-type models is that the carbon uptake of sufficiently watered and fertilized plants is linearly correlated with the energy of the incident photosynthetically active radiation (PAR), or more precisely, the fraction of the PAR that is actually absorbed by the plants (fPAR). Following this approach, it is possible to calculate GPP for each vegetation type from the absorbed solar radiation (fPAR) and the light use efficiency (LUE) of the vegetation type. The LUE can be affected by environmental stress factors, particularly temperature, water limitation, and nitrogen availability. Species-specific fPAR values may be estimated by measurement of dry biomass accumulation, or may be derived from satellite data. GPP, as estimated by such a model, can be converted to NPP by considering temperature-dependent maintenance respiration. Maintenance respiration can be estimated using allometric functions regarding leaf and root distribution following the approach of Ryan et al. (1995), or using the Leaf
Published by Copernicus Publications on behalf of the European Geosciences Union.
1020
M. Tum et al.: Validation of modelled forest biomass in Germany using BETHY/DLR
Area Index (LAI) of the vegetation following Running et al. (2000). In either case, NPP is defined as the remainder after plant maintenance respiration is subtracted from GPP. In a further step, Net Ecosystem Productivity (NEP) can be calculated by subtracting the heterotrophic respiration in an ecosystem from the ecosystem’s NPP. The Monteith-type model architecture has been used many times. For example, the C-Fix model, a Monteith-type parametric model by Veroustraete et al. (1994), was used by Verstraeten et al. (2006) to estimate net ecosystem fluxes for all of Europe. C-Fix is driven by vegetation type data of the Normalized Differenced Vegetation Index (NDVI) and meteorological data (temperature and daily incoming global radiation) obtained from about 800 weather stations administered by the World Meteorological Organization (WMO). Verstraeten et al. (2006) validated their results with eddy covariance flux tower measurements, obtaining an R 2 of 0.84 for pine forests and 0.59 for mixed deciduous forests. The Carnegie-Ames-Stanford Approach (CASA) model introduced by Potter et al. (1993) and validated by Potter et al. (2001, 2003) is another example of a Monteith-type model. The CASA model is driven by monthly NDVI data from the FASIR database of the Goddard Space Flight Center, monthly temperature and precipitation data from the International Institute for Applied Systems Analysis (IIASA), and monthly PAR data from the Goddard Institute for Space Studies. Validation of CASA was performed against atmospheric CO2 concentration data from NOAA and the Geophysical Monitoring from Climate Change Flask Sampling Network, and obtained R 2 values between 0.09 and 0.67. When the LUE approach is integrated into a coupled soilplant-atmosphere model, such as the Atmosphere–Land Exchange (ALEX) model, daily estimates of evapotranspiration and carbon assimilation fluxes can also be obtained (Anderson et al., 1997). Recently, more sophisticated models have begun to be developed that take this integrative approach even further. In computing the uptake of carbon by plants, these so-called “dynamic” models take into account the complex interactions between plants, soil, and the atmosphere, but also account for the carbon released by both plants and soil in a manner that respects the conservation of energy and momentum. At present, only a few dynamic models have been published. Examples are the Lund-PotsdamJena (LPJ) model developed by Prentice et al. (1992) and modified by Bondeau et al. (2007), the Equilibrium Terrestrial Biosphere Model (BIOME3) by Haxeltine and Prentice (1996), and the ORganizing Carbon and Hydrology in Dynamic EcosystEms (ORCHIDEE) model by Krinner et al. (2003). These global models are driven by meteorological input data, and phenology is calculated internally from those inputs using per-species physiological parameters. The spatial resolution for dynamic models can range from degrees, for global models such as Prentice et al. (1992) and Haxeltine and Prentice (1996), to kilometres, for regional models such as Wisskirchen (2005). Model outputs are typically Geosci. Model Dev., 4, 1019–1034, 2011
GPP, NPP and NEP, total ecosystem respiration, and evapotranspiration. This study used the Biosphere Energy Transfer Hydrology (BETHY/DLR) model, a dynamic model based on the Jena Scheme of Atmosphere Biosphere Coupling in Hamburg (JSBACH) by Knorr (1997), which was designed for global applications (see also Knorr and Heimann, 2001). It was modified by Wisskirchen (2005) for application to regional modelling. Model validation is often conducted using data from devices called eddy covariance flux towers. The relationship between carbon and energy flux has been studied in international networks such as FLUXNET (Baldocchi et al., 2001) and AmeriFlux, as well as in projects such as EUROFLUX (Valentini, 2003) and CarboEurope. This research has shown that eddy covariance flux tower measurements can be used to quantify NEP at the spatial scale of the footprint of a tower (Baldocchi, 1997). As mentioned above, NEP may also be calculated by subtracting heterotrophic respiration from NPP. Therefore, robust methods have been developed to estimate heterotrophic respiration in order to convert NEP, as measured by eddy towers, into NPP (or, by considering plant maintenance respiration as well, GPP). For example, the MODIS GPP product (MOD17, C4.5) was validated with eddy tower CO2 flux estimates across diverse land cover types and climates (Heinsch et al., 2006). The main test areas were forest ecosystems in North America, but chaparral, oak savannah, northern grassland and Arctic tundra were also included in the investigation. It was found that MODIS overestimated GPP by about 20 % to 30 %, but this depended strongly on season and ecosystem type. Comparison of annual MODIS GPP (modelled with global meteorological data from NASA’s Global Modeling and Assimilation Office) to tower-based GPP measurements yielded an R 2 of 0.72. The primary objective of this study is to present a new approach to the validation of modelled NPP. We compare output from BETHY/DLR, run at 1 km2 spatial resolution, with empirical measurements of the mean annual increment (MAI) in above-ground biomass (including bark) observed in forests in Germany. The MAI data are available at a regional scale called the NUTS-1 level; NUTS is an abbreviation for “Nomenclature des Unit´es Territoriales Statistiques,” and is a system of hierarchically organised territorial units used for statistical purposes. The NUTS-1 MAI data were obtained from the National Forest Inventory (NFI) of Germany. A secondary objective is to use our modelled and validated NPP to estimate theoretical energy potentials, given sustainable forestry practices, for the area of study. Sustainable energy potentials from forests are a key element in planning a sustainable energy economy for Germany (and, of course, the rest of the world), and so developing methods for estimating, and ultimately forecasting, these potentials is of great importance (BMVBS, 2010).
www.geosci-model-dev.net/4/1019/2011/
M. Tum et al.: Validation of modelled forest biomass in Germany using BETHY/DLR 2
Model description
BETHY/DLR is a soil-vegetation-atmosphere-transfer (SVAT) model. SVAT models track the plant-mediated transformation of atmospheric carbon dioxide into energystoring hydrocarbons such as sugars, a process known as carbon fixation. BETHY/DLR models photosynthesis, and takes into account environmental conditions that affect it. Photosynthesis is parameterized following the combined approach of Farquhar et al. (1980) and Collatz et al. (1992), and treats separately the “light” and “dark” reactions of photosynthesis at the leaf level. A benefit of this design is that the photosynthetic rate can be mechanistically limited either by light availability or by the abundance of the carboxylation enzyme Rubisco, the key player in the Calvin cycle that fixes carbon. In addition, so-called C3 and C4 plants are distinguished in BETHY/DLR because significant differences exist between their carbon fixation physiologies; in particular, C4 plants such as sugar beet and corn can fix more atmospheric CO2 at higher temperatures than can C3 plants such as barley and wheat. In a second step, the rate of photosynthesis is extrapolated from leaf to canopy level taking into account both canopy structure and the interactions between soil, atmosphere, and vegetation. For closed canopies (trees, shrubs, and crops) the photosynthetic rate depends on the Leaf Area Index (LAI), a per-species metric of leaf upper surface area per unit ground area. To model self-shading, photosynthetic rate is reduced exponentially from the canopy top to the soil. In this approach, radiation absorption in the canopy is approximated in BETHY/DLR using the so-called “two-flux scheme” of Sellers (1985) with three canopy layers. Besides photosynthesis, other energy transfers also need to be tracked. BETHY/DLR’s energy balance model takes into account heat fluxes between the vegetation and the atmosphere above it, as well as the cooling effect of evapotranspiration from the soil and vegetation. Soil heat flux is also estimated, and the storage of heat in the canopy and in the air layer above the canopy is considered. The coupling of these processes is of great importance, since temperature-dependent photosynthesis transforms light energy into chemical energy, and finally into carbohydrates, using water and CO2 . Water is available for the plants from the soil, while evapotranspiration by plants and soil determine the water vapour deficit in the atmosphere, which is closely linked to the stomatal behaviour of leaves. Thus when considering the dynamic interaction of, for instance, the soil water balance and photosynthesis, the natural behaviour of vegetation can be reflected; this is the motivating idea of the SVAT approach. The water cycle must also be modelled and included in this interaction scheme. In BETHY/DLR three water reservoirs are considered: soil water, snow, and “skin” or “intercepted” water on leaves and other parts of the vegetation. These reservoirs change in time and space depending on www.geosci-model-dev.net/4/1019/2011/
1021
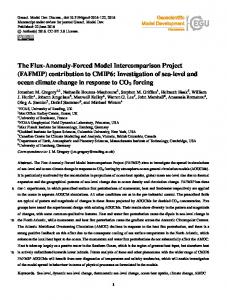
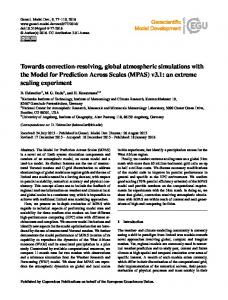
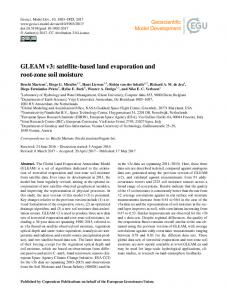
precipitation, temperature and evapotranspiration. A “bucket model” is used for calculating soil water dynamics, using the plant rooting depth as the depth of the soil core. In the bucket model, water availability for plants is governed by the soil water content above the permanent wilting point (at which water is so tightly bound by soil particles that it is unavailable to plants) and below the field capacity (at which the soil is full and further water added by precipitation or snowmelt runs off). The distribution of water within the soil is not modelled in BETHY/DLR, although this would be a worthwhile addition. Water limitation is considered by calculating the demand for evapotranspiration using the approach of Monteith (1965) with the criteria of Federer (1979), which state that evapotranspiration cannot be greater than the limit set by the soil water supply and the water uptake physiology of a plant’s roots. Autotrophic respiration is modelled in BETHY/DLR as the sum of maintenance respiration and growth respiration. Maintenance respiration is determined by plant-specific dark respiration rates, while growth respiration is proportional to the difference between GPP and maintenance respiration. For estimating NEP, heterotrophic soil microbe respiration is calculated as a function of temperature, scaled by the annual NPP and the effect of soil moisture (neglecting, for modelling purposes, other heterotrophic respiration). The output of BETHY/DLR is a time series of NPP in daily steps, at the resolution and projection of the land cover classification. Here 1 km2 resolution is used, in a latitudelongitude projection using the WGS84 (World Geodetic System 1984) datum. An overview of the input data used in this study and the internal model processes acting upon them is presented in Fig. 1.
3
Input data
The inputs of the BETHY/DLR model are three remote sensing datasets derived from SPOT-VEGETATION and MODIS, meteorological data provided by ECMWF, and two further datasets describing soil type and land elevation. 3.1
Remote sensing data
Per-pixel Leaf Area Index (LAI) time series were used to determine vegetation phenology. These time series were based on CYCLOPES (Carbon cYcle and Change in Land Observational Products from an Ensemble of Satellites) tenday composite datasets, which can be downloaded from the POSTEL (Pole d’Observation des Surfaces continentales par TELedetection) database. Criteria for the identification of gaps and outliers in the CYCLOPES datasets were defined and crosschecked against a hand-validated dataset. For each identified gap or outlier, harmonic analysis (HA), a type of superpositioning transformation, was applied to estimate a corrected value. Following this procedure, a global mean Geosci. Model Dev., 4, 1019–1034, 2011
1022
M. Tum et al.: Validation of modelled forest biomass in Germany using BETHY/DLR
Fig. 1. Model overview for BETHY/DLR. Left: input data, middle: internal model processes, right: outputs.
error of 9 % was found across a longer time series. Despite these gaps and outliers, the CYCLOPES dataset is the most consistent LAI dataset available (Garrigues et al., 2008); it was also chosen because it is available in the needed form of ten-day composites. The CYCLOPES dataset also provides land cover and land use information for the year 2000, available as the product Global Land Cover 2000 (GLC2000). The Land Cover Classification System of the Food and Agriculture Organization of the United Nations (FAO), using 22 different land cover classes, was used to derive GLC2000 (Bartholome et al., 2002; DiGregorio and Jansen, 2001). The CYCLOPES LAI and GLC2000 datasets are both available as 10◦ × 10◦ maps in rectangular projection, with latitude and longitude using the WGS84 datum. Complete coverage of the study area (Germany) is available. In order to make the GLC2000 land use/land cover classification useable for NPP modelling with BETHY/DLR, the GLC2000 vegetation classes were translated to BETHY/DLR’s forest-related vegetation types. Each vegetation type in BETHY/DLR is described by biochemical parameters such as the maximum carboxylation rate and the maximum electron transport rate, encapsulating the maximum rates of, respectively, the light and dark reactions of photosynthesis. The internal parameterisation of BETHY/DLR allows a given GLC2000 vegetation class to be represented as a fraction of two BETHY/DLR vegetation types. In the context of this study, only four GLC2000 Geosci. Model Dev., 4, 1019–1034, 2011
classes represented forest types found within Germany; the BETHY/DLR representation of these four classes is shown in Table 1. To obtain information about fractional land cover, an additional dataset was used. The MODIS Vegetation Continuous Fields (VCF) dataset (DeFries et al., 2000; Hansen et al., 2002, 2003) contains annual global data on percent tree cover at a spatial resolution of 500 m square, and is available for 2000 to 2005. For use in BETHY/DLR, the highresolution VCF data were aggregated to match the spatial resolution of the CYCLOPES data using a Geographic Information System (GIS). For GLC2000 class 6 (“Tree cover, mixed leaf type”), a weighting factor of 0.5 between deciduous and coniferous forest types was used (without scaling of those weights by the VCF fractional land cover). This approximation was assumed to be adequate, since only 15 % of German forest areas are described as mixed forest in the GLC2000, and since VCF contains no further information about the proportion of deciduous to coniferous trees. A similar approach was described by Jung (2008) using the AVHRR Continuous Field of Tree Cover dataset. 3.2
Meteorological data
In addition to remote sensing data, BETHY/DLR needs meteorological input data (Table 2). The ECMWF (European Centre for Medium-Range Weather Forecasts) provides this data at a spatial resolution of 0.25◦ × 0.25◦ and a temporal www.geosci-model-dev.net/4/1019/2011/
M. Tum et al.: Validation of modelled forest biomass in Germany using BETHY/DLR
1023
Table 1. Translation of GLC2000 vegetation classes to BETHY/DLR vegetation types with weighting factors. GLC2000 class
BETHY/DLR type
Weighting factor
Tree cover, broadleaved, deciduous closed (glc-2) Tree cover, broadleaved, deciduous open (glc-3) Tree cover, needle-leaved, evergreen (glc-4) Tree cover, mixed leaf type (glc-6)
Temperate broadleaved deciduous trees Temperate broadleaved deciduous trees Evergreen coniferous trees Temperate broadleaved deciduous trees Evergreen coniferous trees
MODIS VCF MODIS VCF MODIS VCF 0.5 0.5
Table 2. Summary of meteorological input data from ECMWF, including short names and code numbers. Parameter
ECMWF short name
Volumetric soil water layer 1 Volumetric soil water layer 2 Volumetric soil water layer 3 Volumetric soil water layer 4 Geopotential Large scale precipitation Convective precipitation 10 m U -velocity 10 m V -velocity 2 m temperature Low cloud cover Medium cloud cover High cloud cover
SWVL1/(SWL1) SWVL2/(SWL2) SWVL3/(SWL3) SWVL4/(SWL4) Z LSP CP 10 U 10 V 2T LCC MCC HCC
ECMWF code number 039 040 041 042 129 142 143 165 166 167 186 187 188
resolution of up to four times per day. The data are produced by ECMWF’s climate model analysis of meteorological station measurements of air temperature (at 2 m height), wind speed (at 10 m height), soil water content (in the four uppermost layers), and cloud cover. Daily precipitation values were obtained from the ECMWF INTERIM dataset. From these data we calculated daily mean, minimum and maximum temperatures, daily mean cloud cover at three heights, and relative humidity. Daily temperature values were reconstructed at the 1 km2 resolution of the land cover data, adjusting for the elevation difference between the ECMWF data and the elevation of each modelled pixel using the temperature gradient of the international standard atmosphere (−0.65 K per 100 m). The daily average photosynthetically active radiation (PAR) was calculated from global radiation following the method of Burridge and Gadd (1974). This method calculates PAR from the incident sunlight for the given day and year, modified by atmospheric transmission, which depends on the degree of cloudiness. Daily average cloud cover was calculated using a weighted sum of each cloud layer. This approach leads to more exact results than the direct use of radiation forecast data, and is thus preferable to the direct use www.geosci-model-dev.net/4/1019/2011/
of ECMWF radiation data (Wisskirchen, 2005). Global radiation was calculated for each location at each one-hour time step. Time series of the volumetric soil water content were needed to calculate the soil water budget of the model. Information about the soil type was taken from the International Soil Reference and Information Centre-World Inventory of Soil Emission Potentials (ISRIC-WISE) dataset, which has a resolution of 5 × 5 arcminutes. It is a harmonization of the global FAO-UNESCO Soil Map of the World (FAOUNESCO 1974).
4
Eddy crosscheck
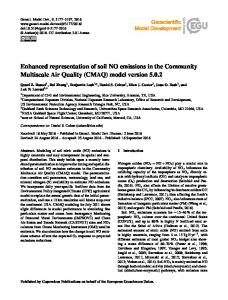
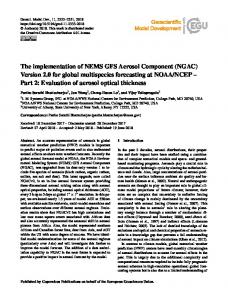
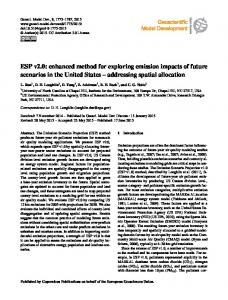
Before validating BETHY/DLR’s modelled NPP for NUTS1 regions across all of Germany, we performed a crosscheck of BETHY/DLR GPP results with eddy covariance flux tower measurements provided by FLUXNET. Two tower sites were selected, one in the Hainich forest and one in the Tharandt forest. The Hainich tower is to the west of Jena, Germany, in a mixed deciduous beech forest, while the Tharandt tower is south of Dresden in a coniferous forest. For both sites Level 4 data, providing information about GPP, are available for 2000 and 2001. GPP was calculated by subtracting the estimated ecosystem respiration from measured NEP) as described in Reichstein et al. (2005). These data were crosschecked against BETHY/DLR’s modelled GPP, as annual sums at each station (Table 3). Because BETHY/DLR underestimated annual GPP sums by 20 %–30 % for both stations over both years, a further analysis of monthly GPP sums was performed (Fig. 2). BETHY/DLR’s GPP estimates qualitatively follow the measured GPP for the coniferous forest at Tharandt over both years, but with a slight underestimation (Fig. 2a and b). This finding accords with the results of Wisskirchen (2005), who also observed good agreement between measured and modelled NEP at Tharandt. For the mixed deciduous forest of the Hainich station in 2000, BETHY/DLR’s estimated GPP is good up to May and from September onwards. However, June, July and August exhibit a strong depression of the modelled GPP, responsible for the overall underestimation for this year (Fig. 2c). For Hainich in 2001 the modelled GPP is Geosci. Model Dev., 4, 1019–1034, 2011
1024
M. Tum et al.: Validation of modelled forest biomass in Germany using BETHY/DLR
Table 3. Annual GPP sums in (gC m−2 a−1 ) modelled with BETHY/DLR and measured with eddy flux towers at the Hainich and Tharandt stations for 2000 and 2001. The percent difference and RMSE are provided for each comparison. Hainich
Year 2000 2001
Tharandt
BETHY/DLR
Tower
1
RMSE
BETHY/DLR
Tower
1
RMSE
1318 1210
1649 1576
20 % 27 %
20.9 25.2
1426 1278
2025 1655
30 % 23 %
18.6 17.9
Fig. 2. Monthly GPP sums modelled with BETHY/DLR (solid lines) and measured with eddy flux towers (dashed lines) for the Tharandt and Hainich stations for 2000 and 2001.
overestimated in May, but underestimated in all other months in the growing season (Fig. 2d). Overall, BETHY/DLR models monthly GPP well for coniferous forest, with an underestimation of yearly GPP of less than 30 %. For deciduous forest the underestimation of yearly GPP is also less than 30 %, but monthly GPP shows an RMSE of up to 25 (Table 3). In particular, BETHY/DLR seems to strongly underestimate the peak of productivity during the middle of summer, perhaps due to Geosci. Model Dev., 4, 1019–1034, 2011
the more heterogeneous development patterns of the species in this vegetation group. Comparisons of GPP calculated by other vegetation models, such as BIOME-BGC, ORCHIDEE and LPJ, with eddy covariance flux tower measurements revealed an overall RMSE of 30 % for forests in climate zones from boreal to Mediterranean (Jung, 2008). This magnitude of error corresponds well with our findings.
www.geosci-model-dev.net/4/1019/2011/
M. Tum et al.: Validation of modelled forest biomass in Germany using BETHY/DLR 5
Validation strategy
To validate BETHY/DLR’s modelled NPP, we used empirical data on the mean annual increment (MAI) of timbergrowing stocks. These data describe the change in the aboveground woody parts of trees with a diameter greater than 7 cm, given as solid tree volume (including bark), estimated during the second National Forest Inventory (NFI2) and the first National Forest Inventory (NFI1), divided by the time between the two inventories. We chose to use MAI instead of current annual increments (CAI) because for Germany no empirically-derived data with higher temporal resolution than the NFI is available. For Germany, these timber stock increment data are provided by the second National Forest Inventory, classified by forest, tree species, and age class. The aim of this ongoing large-scale survey is to establish statistically reliable central monitoring of the development of Germany’s forests, to allow assessment of each forest’s status and production potential. The NFI survey uses a permanent set of sampling sites, based on a nationwide 4 km × 4 km grid. Samples are taken at randomly chosen sites from this set, using a uniform procedure across all of Germany. This sampling procedure fulfils accuracy requirements at the national level, but more intensive sampling is conducted for greater accuracy in some smaller federal states, such as Bremen and Hamburg. From a statistical point of view the maximum error of the NFI survey regional level data is about 12 % for coniferous forest and below 8 % for deciduous forest, calculated from the data of BMELV (2004). For each sampling site, the NFI surveys about 150 characteristics, such as tree species composition, timber volume, and growth, using an angle-count sampling method at each corner of the site. Furthermore, sampling circles with defined radii are drawn to survey tree species composition, tree heights, deadwood, ground vegetation and other characteristics. A more detailed description can be found in BMELV (2004). The first NFI survey was conducted between 1986 and 1988 and was restricted to the ten states of the former West Germany. All data of the NFI1 are referenced to the year 1987. The second NFI survey was carried out in 2001 and 2002 across all federal states of Germany. The reference year for NFI2 is 2002. The NFI data are freely available at the NUTS-1 level (BMELV, 2004). In order to validate the modelled NPP against these NFI surveys, the highly detailed NFI data had to be aggregated. In a first step, the tree species reported in the NFI statistics were grouped into BETHY/DLR’s two temperate forest classes, coniferous and deciduous. Coniferous forest in Germany is mainly composed of spruce (∼57 %) and pine (∼33 %), while Germany’s deciduous forest is dominated by beech (∼48 %) and oak (∼25 %). It was therefore assumed that all parameters (standing timber stock and mean annual increment of timber stock, in particular) of these two forest classes could be estimated as the sum of the metrics for the www.geosci-model-dev.net/4/1019/2011/
1025
two principal species, plus an estimated value for all of the secondary species. The NFI data were then used to calculate the MAI of the total above-ground biomass (MAIT ), which was then compared to the modelled NPP. To calculate MAIT for a NUTS region, the increments of the above-ground biomass of coniferous (MAIc ) and deciduous (MAId ) trees were summed (Eq. 1). MAIT = MAIc + MAId
(1)
As described above, we calculated MAIc and MAId as the sum of the increments of the total above-ground biomass of ˆ plus an estimate for the tertiary the two dominan species (M) ˜ species (M). Both MAIc and MAId , represented simply as MAI, were thus calculated following Eq. (2). MAI =
2 X
Mˆ s + M˜
(2)
s=1
The index s represents the two dominant species of the forest class. Since tree biomass depends upon age, Mˆ was calculated using per-species age-dependent biomass increments, β, for the ten age classes in the NFI data, as shown by Eq. (3). Mˆ s =
10 X
βs,a · As,a
(3)
a=1
The index a represents the age classes, and A represents the proportional area occupied by each age class (given in the NFI data). Since values for β are not given by the NFI, the NFI’s species- and age-dependent net increments of the outer bark volume V , expressed in m3 a−1 area−1 , are used. To convert timber stock biomass into absolute dry biomass, speciesdependent conversion factors (ε) are needed (Table 4). Furthermore, species- and age-dependant conversion factors, P , are needed to estimate the total above-ground biomass. P represents the fraction of total above-ground biomass, including branches of less than 7 cm diameter and needles/leaves, that is outer bark (Table 4). Given these values, β was calculated as shown in Eq. (4). βs,a =
Vs,a · εs Ps,a
(4)
Because the first NFI was conducted before 1989, values for V are only available for the ten states of the former West Germany. For the five states of the former East Germany, values for V were taken from yield tables (Erteld, 1963). For this study values of ε were taken from Dieter and Englert (2001). Since only a single source of values for P was found, the accuracy of these values is unknown. To calculate M˜ it was assumed that a weighted average of the biomass increments of the two dominant tree species, ˆ would be representative for the tertiary species (Eq. 5). M, Geosci. Model Dev., 4, 1019–1034, 2011
1026
M. Tum et al.: Validation of modelled forest biomass in Germany using BETHY/DLR
Table 4. Per-species percentage of timber stock biomass (without bark) to total above-ground biomass (P ) from Kramer and Kr¨uger (1981), max ε from Dieter and Englert (2001), and min ε from Kaltschmidt and Hartmann (2009). / = no value. ε (t m−3 )
P per age class
Species
min
max
I
II
III
IV
V
VI
VII
VIII
IX
X
Spruce Pine Beech Oak
0.38 0.43 0.56 0.58
0.43 0.49 0.66 0.64
0 0 0 0
0.48 0.33 0.00 0.56
0.25 0.25 0.49 0.21
0.17 0.19 0.32 0.19
0.17 0.19 0.19 0.12
0.13 0.18 0.16 0.11
0.12 0.15 0.14 0.12
0.13 0.16 0.13 0.11
/ / 0.15 0.08
/ / / 0.08
Statistical analysis indicated that the error of this approach is less than 6 %. A˜ · V˜ · ε˜ M˜ = P˜
(5)
P˜ and V˜ represent the arithmetic averages of the weighted average means of P and V , respectively. Since both depend on tree age and species composition, they were thus calculated using Eq. (6) (P˜ being calculated analogously using P ). 10 P
V ·A 2 P a=1 s,a s,a P 10
s=1
As,a
a=1
V˜ =
2
(6)
ε˜ was calculated using the arithmetic mean of ε, following Eq. (7). 2 P
ε˜ =
εs
s=1
2
(7)
Before the modelled results could be validated, they needed to be aggregated to the NUTS-1 level at which the NFI data are given. To accomplish this, the modelled NPP was first transferred to a GIS, taking into account the equi-rectangular WGS84 datum map projection. Then, in order to allow comparison of the datasets, the CAI of the above-ground biomass of the modelled NPP was calculated. Because the modelled NPP does not specify which parts of the plant contain the accumulated carbon, the below-ground carbon content had to be estimated and removed. Furthermore, the NPP (in units of carbon) was converted to above-ground biomass (in units of dry weight) by applying a conversion factor (Eq. 8). CAI =
NPP · λ (1 + R)
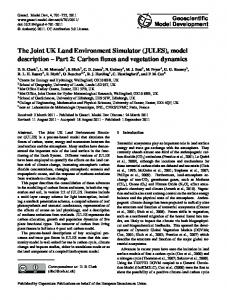
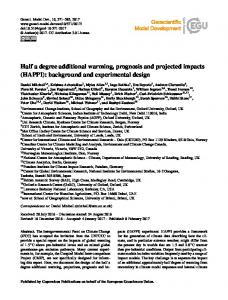
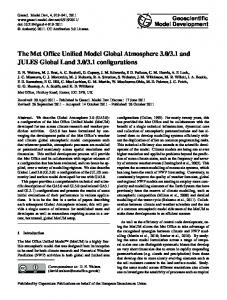
Fig. 3. Annual NPP of forest areas in Germany for 2000 and 2001. High NPP is shown in green, moderate NPP in yellow, and low NPP in red. Grey pixels represent areas which do not belong to the GLC2000 classes glc-2, glc-3, glc-4 or glc-6 (see also Table 1). Blue pixels represent pixels designated as forest in GLC2000, but that have less than 10 % forest cover according to VCF; their modelled NPP is therefore close to zero despite being considered forest.
(8)
of R for each of the two temperate forest classes modelled by BETHY/DLR (coniferous and deciduous) was calculated (deciduous: 0.19 ± 0.08, coniferous: 0.23 ± 0.04). To check the numbers upon which these calculations were based, the corresponding allocation factors for above-ground biomass were also calculated using the same dataset (deciduous: 0.81, coniferous: 0.84); these values agree closely with previously reported values (Zhou et al., 2006), supporting our estimated values for R. The value for λ was set to 2, which is seen as representative for both deciduous and coniferous trees (Houghton et al., 1997). After these calculations and conversions, the CAI derived from the BETHY/DLR model output was compared to the MAI calculated from NFI statistics in order to validate BETHY/DLR’s estimates of NPP.
R represents the ratio of the increment of below- to aboveground biomass, while λ is a conversion factor from NPP to total biomass. Species-specific values for R were taken from Pistorius and Zell (2005). Since the GLC2000 gives no information about tree species distribution, a mean value Geosci. Model Dev., 4, 1019–1034, 2011
www.geosci-model-dev.net/4/1019/2011/
M. Tum et al.: Validation of modelled forest biomass in Germany using BETHY/DLR 6
Results and discussion
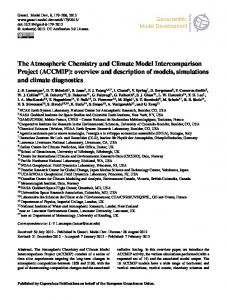
Figure 3 depicts annual modelled NPP for Germany in 2000 and 2001 at this study’s spatial resolution of 1 km2 . For both years the major forests of southern Germany (the Spessart, the Palatinate, and the Black Forests) are clearly identifiable from their high NPP values, whereas the northern forested areas, such as the Harz mountains, have substantially lower NPP. The mean annual NPP for 2000 was 139 (tC km−2 yr−1 ) with a maximum of 547 (tC km−2 yr−1 ); for 2001 the mean annual NPP was 137 (tC km−2 yr−1 ) with a maximum of 544 (tC km−2 yr−1 ). Total annual modelled NPP was thus 21.6 × 10⁶ tC for 2000 and 21.3 × 10⁶ tC for 2001. Conversion of these NPP values to above-ground biomass as described above gives annual totals of 52.3 × 10⁶ t for 2000 and 51.8 × 10⁶ t for 2001. The value estimated from NFI’s data is 82.7 × 10⁶ t (for both of 2000 and 2001). Our modelled NPP thus shows an underestimation of 37 % for both years compared to empirical data. Furthermore, large areas with very low NPP can be identified, especially at the borders of larger forests such as the Black Forest of southwestern Germany. This is because these areas are considered to be forest according to GLC-2000, but MODIS VCF indicates very low forest cover fractions (down to one part per thousand). Such areas of conflicting land cover information are shown as blue pixels in Fig. 3. Linear regressions of estimated above-ground biomass increment from modelled NPP (CAI) against the empirical data from the NFI (MAI) are presented in Fig. 4, with results for coniferous and deciduous trees separated for comparsion. Figure 4 shows that BETHY/DLR underestimates the net increment of above-ground biomass for both deciduous and coniferous trees. The R 2 values of 0.74 and 0.76 for deciduous trees indicate a high degree of correlation, however. The correlation for coniferous trees is even stronger, with R 2 values of 0.95 and 0.93, but the underestimation is also higher here. In order to quantify the predictive accuracy of BETHY/DLR’s NPP estimates, the root mean square error (RMSE) was calculated for all four panels; for deciduous trees the RMSE is 1.53 (2000) and 1.48 (2001), and for coniferous trees, 1.87 (2000) and 1.93 (2001). The MAI of above-ground biomass for deciduous trees in Germany for all NUTS-1 regions is 821.9 tons per km2 (NFI), but the corresponding value estimated with BETHY/DLR is 530.9 tons per km2 , 35 % less. For coniferous trees these values are 804.7 tons per km2 (NFI) and 416.0 tons per km2 (BETHY/DLR), a 48 % underestimate. A reason for underestimation can be found in the land cover/land use classification used (GLC2000). Figure 5 presents a comparison of the forest areas derived from the NFI database, the forest areas of GLC2000, and the forest areas for the intersection of GLC2000 and MODIS VCF. From Fig. 5b it is apparent that NFI and GLC2000 deciduous forest area estimates differ markedly; an underestimation www.geosci-model-dev.net/4/1019/2011/
1027
of 66 % for Schleswig-Holstein (SH) and an overestimation of 106 % for Bavaria (BY) is observed, for example. For coniferous forest (Fig. 5a) the two area estimates are more comparable, with a mean difference of 20 %. These imbalances are reduced when looking at the total forest areas for deciduous and coniferous trees across all of Germany; total coniferous forest area estimates are 42 400 km2 (NFI) and 47 100 km2 (GLC2000), and for the deciduous forest, 60 800 km2 (NFI) and 61 100 km2 (GLC2000). It can also be seen in Fig. 5a and b that the GLC2000 underestimates forest areas for the northern states of Germany such as Schleswig-Holstein (SH) and Lower Saxony (NI), whereas it overestimates the forest areas for southern states such as Bavaria (BY) and Baden-W¨urttemberg (BW). In aggregate, then, GLC2000 represents forest area well, but its spatial distribution is not comparable with the NFI data. We hypothesize that the medium-scale forest structure found in most parts of Germany is not adequately described by the GLC2000, due to the difficulty of accurately classifying a heterogeneous land cover distribution even with a resolution of 1 km2 (Mayaux et al., 2006). According to the Land Cover Classification System (DiGregorio and Jansen, 2001) used in deriving GLC2000, the GLC2000 class “Broadleaved Deciduous Closed to Open (100–40) % Trees” includes all forest areas with a forest fraction from 40 % to 100 % – a very wide range. In order to describe the forest cover fraction more precisely, the MODIS VCF product was combined with the GLC2000 to produce the area estimates used as inputs by BETHY/DLR. Figure 5a and b show the coniferous and deciduous forest areas that result from this combination of MODIS VCF and GLC2000. Clearly this approach led to underestimations of the forest area in Germany, both for coniferous (47 %) and deciduous (59 %) forest. This underestimation occurs because only areas reported as forested in the GLC2000 were carried forward to be combined with the MODIS VCF coverage data; areas designated as non-forest in GLC2000, but with a non-zero forest cover fraction in VCF, were treated as non-forested. As a result, those forest areas which were underestimated by GLC2000, such as Lower Saxony or Schleswig-Holstein, led to substantial underestimations of the increment of above-ground biomass. Other land cover datasets with higher resolution, such as CORINE (100 m × 100 m) and MERIS GlobCover (300 m × 300 m), are available for Germany, and their land use structures show a better agreement with the NFI data. Since BETHY/DLR requires land cover and LAI inputs to be at the same spatial resolution, and since no higher-resolution LAI products are available yet for Germany, these finergrained land cover datasets unfortunately could not be used. Exploratory analysis shows, however, that the combination of GlobCover and VCF leads to an underestimation of forest area of 24 %, while the combination of CORINE and VCF yields an underestimation of only 7 %. This agrees with the findings of EEA (2006), which estimated the reliability of the CORINE classes 311 (coniferous forest) and 312 (deciduous Geosci. Model Dev., 4, 1019–1034, 2011
1028
M. Tum et al.: Validation of modelled forest biomass in Germany using BETHY/DLR
Fig. 4. Estimated above-ground biomass increment from modelled NPP (CAI) versus empirical data from the NFI (MAI) for Germany’s deciduous and coniferous trees for 2000 and 2001. Each cross represents one NUTS-1 region. Thick lines show linear regressions. Values are given in megatons per NUTS-1 unit per year.
Fig. 5. Comparison of coniferous and deciduous forest areas from NFI, from GLC2000, and from the intersection of GLC2000 and MODIS VCF areas. Areas are given in 1000 km2 per NUTS-1 unit. BW: Baden Wuerttemberg, BY: Bavaria, BB: Berlin/Brandenburg, HE: Hesse, MV: Mecklenburg-Western Pomerania, NI: Lower Saxony/Hamburg/Bremen, NW: North Rhine-Westphalia, RP: RhinelandPalatinate, SL: Saarland, SN: Saxony, NT: Saxony-Anhalt, SH: Schleswig-Holstein, TH: Thuringia.
Geosci. Model Dev., 4, 1019–1034, 2011
www.geosci-model-dev.net/4/1019/2011/
M. Tum et al.: Validation of modelled forest biomass in Germany using BETHY/DLR
1029
Fig. 6. Normalized estimated above-ground biomass increment from modelled NPP versus empirical data from the NFI for Germany’s deciduous and coniferous trees for 2000 and 2001. Each cross represents one NUTS-1 region. Thick lines show linear regressions. Values are given in tons km−2 .
forest) at better than 85 %. We observe, therefore, that while area-wide land cover products at high resolution are needed and useful, high-resolution datasets for plant physiology parameters such as LAI must also keep pace if these products are to be of maximal utility. Returning to Fig. 4, we note that when the number of observations is small, the slope of a regression line is very sensitive to outliers. In the case of deciduous forests in 2000 and 2001 two outliers can be identified that have a strong influence on the slope of the regression line: Bavaria and Baden Wuerttemberg, the two largest federal states of Germany. In Fig. 4 these states have the largest values (on both axes), because of their large areas. To compensate for the large effect of both: the potential outliers and forest area underestimation, we normalized the CAI and MAI data for each NUTS-1 region by dividing these values by forest area, resulting in units of tons per km−2 per NUTS unit. For this the MAI data was devidid by the forest area reported in the NFI and the CAI data by the combined area of GLC2000 and VCF as used for the model run. The results are presented with linear regressions in Fig. 6.
www.geosci-model-dev.net/4/1019/2011/
Figure 6 shows that BETHY/DLR does not exhibit an underestimation for coniferous trees with these areanormalized metrics, indicating that the underestimation seen in Fig. 4 might indeed be explained by GLC2000’s area underestimation, as discussed above. The R 2 values of 0.61 and 0.53 still indicate a reasonable degree of correlation. The underestimated CAI for deciduous trees, observed in Fig. 4 and persisting in Fig. 6 after area-normalization, might be explained by BETHY/DLR’s internal model parameters related to carbon uptake: maximum carboxylation rate and maximum electron transport rate. The values used for these parameters were taken from Knorr (1997) (see also Knorr and Heimann, 2001), where they were used for global carbon assessment; these values thus represent global mean values. However, forests in Germany are probably more productive than the “global mean” trees simulated by BETHY/DLR using these parameter values, because of their age. The last large reforestation programme in Germany followed World War II, to mitigate the deforestation experienced during the war. According to the NFI, the mean age of Germany’s forests is about 67 yr (81 yr for deciduous and 54 yr for Geosci. Model Dev., 4, 1019–1034, 2011
1030
M. Tum et al.: Validation of modelled forest biomass in Germany using BETHY/DLR
coniferous trees), an age class that is expected to exhibit a high rate of increase of timber biomass. Young and old trees differ in their carbon allocation and fixation strategies; in particular, carbon fixation and timber growth decreases with increasing tree age. In old trees, the maintenance respiration rate is nearly as high as the carbon uptake rate, and thus the large majority of GPP in older trees is dedicated to maintenance. The carbon uptake of young trees, on the other hand, is mainly used for growth. Studies show that the transition between these two metabolic regimes occurs at about 60 to 80 yr of age (Zhou et al., 2006). Therefore it is likely that the values used for the maximum carboxylation rate and the maximum electron transport rate are too low to accurately simulate the tree communities of Germany (see Zaehle et al., 2006 for further discussion of this issue). Underestimations in the modelled NPP could also be the result of the neglect of nitrogen deposition in the model. Luysseart et al. (2010) showed an increase in modelled NPP of up to 30 % when nitrogen deposition is included in the model formulation. Uncertainties for deciduous trees are higher (R 2 0.35 and 0.37) than for conifers, which might indicate higher structural variability among deciduous tree species. In particular, deciduous tree species exhibit greater variation in shape than do coniferous tree species in nature. Finally, it should be taken into account that NFI statistics can only produce MAI values; these values were estimated from the difference between the first NFI survey, in 1987, and the second, in 2002. Until NFI conducts a third survey year, the effects of climatic variability cannot be captured by the NFI statistics.
7
Estimation of energy potentials
A further objective of this study is to derive energy potentials both from modelled NPP and from NFI data. The energy potential of forests is of considerable importance to the sustainable energy discussion and the development of sustainable energy policy. To estimate theoretical energy potentials, species-specific lower heating values (H ) can be used to convert from absolute dry above-ground biomass. Heating values represent the maximum energy obtainable from the combustion of biogenic solid fuels, and are given in megajoules per kilogram. Since the GLC2000 gives no information about tree species, but does differentiate between deciduous and coniferous trees, mean heating values representative of each tree class were used. For this study, heating values for deciduous and coniferous trees were calculated for each NUTS1 unit (Table 5), taking into account the relative abundance and age distribution of tree species in each region. Heating values for the main deciduous (oak and beech) and coniferous (pine and spruce) tree species can be found in many sources; see, for example, Kaltschmidt and Hartmann (2009) Geosci. Model Dev., 4, 1019–1034, 2011
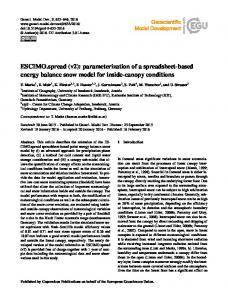
Fig. 7. Sustainable theoretically available energy potential, in terajoules per 1 km2 pixel, of forest areas in Germany for 2000 and 2001. Low energy potentials are shown in blue, intermediate potentials in beige, and high energy potentials in red. White represents, as in Fig. 3, areas which are not designated as forested by GLC2000 (see Table 1).
and Grammel (1989). We assume sustainable management of forest biomass; following this assumption, only the mean annual net increment of forest biomass is used to calculate theoretical energy potential. Since B (above-ground biomass; see Eq. (8) is determined for absolute dry conditions, we calculated the energy potential (J ) as shown in Eq. (9). J = B ×H
(9)
Using this equation, theoretical energy potentials for 2000 and 2001 were estimated from the above-ground biomass previously calculated from modelled NPP (Fig. 7). Although the validation previously conducted had demonstrated a systematic underestimation of NPP, no correction was applied here to compensate for this, since such correction would have resulted in an incorrect spatial distribution of estimated energy potentials. Comparison with Fig. 3 shows that those forest areas having the highest NPP values also have the highest theoretical energy potentials. This is also true, mutatis mutandis, for low NPP and energy potential, and is valid for both 2000 and 2001. Analysis revealed that the mean theoretical available energy potential for coniferous forest is 17.5 (TJ km−2 yr−1 ) for 2000 and 2001, while for deciduous forest these values are 25.0 (TJ km−2 yr−1 ) (2000) and 24.6 (TJ km−2 yr−1 ) (2001). Maximum values of 25.7 (TJ km−2 yr−1 ) (coniferous forest) and 25.4 (TJ km−2 y−1 ) (deciduous forest) were found. The NFI data were also used to estimate empirical energy potentials, using Eq. (10) for all thirteen NUTS-1 units in Germany (Table 5). These estimates of energy potential are partitioned into the two main tree classes.
www.geosci-model-dev.net/4/1019/2011/
M. Tum et al.: Validation of modelled forest biomass in Germany using BETHY/DLR
1031
Table 5. Total forest areas, estimated increment of above-ground biomass from NFI data, heating values, and empirical energy potentials of woody biomass for Germany’s NUTS-1 regions, partitioned into deciduous and coniferous tree classes.
NUTS-1 region
Overall forest area
Tree Type
(ha) Hesse
AGB increment
Heating Value
Empirical energy potential
(tons yr−1 )
(MJ kg−1 )
(PJ yr−1 )
813 092
deciduous coniferous
3 384 016 3 037 591 6 421 607
18.4 19.3 18.8
62.3 58.7 121.0
154 602
deciduous coniferous
876 626 571 957 1 448 583
18.4 19.5 18.8
16.1 11.1 27.3
1 081 248
deciduous coniferous
4 091 784 4 966 180 9 057 965
18.4 19.9 19.2
75.3 98.9 174.2
835 763
deciduous coniferous
3 700 153 3 733 869 7 434 021
18.4 19.1 18.7
68.1 71.3 139.4
794 432
deciduous coniferous
3 527 763 2 972 838 6 500 601
18.4 19.3 18.8
64.9 57.5 122.4
1 281 409
deciduous coniferous
4 869 976 6 564 707 11 434 683
18.4 19.2 18.8
89.6 125.8 215.4
2 386 027
deciduous coniferous
7 253 796 13 642 971 20 896 766
18.4 19.3 19.0
133.5 263.2 396.6
92 131
deciduous coniferous
674 469 318 401 992 871
18.4 19.2 18.7
12.4 6.1 18.5
Brandenburg & Berlin
973 017
deciduous coniferous
1 519 005 4 058 284 5 577 289
18.4 20.9 20.2
27.9 84.7 112.6
Mecklenburg-Western Pomerania
492 673
deciduous coniferous
1 787 216 1 817 119 3 604 336
18.4 20.3 19.4
32.9 36.9 69.8
471 290
deciduous coniferous
1 090 393 2 057 192 3 147 585
18.4 19.7 19.2
20.1 40.5 60.5
454 640
deciduous coniferous
1 241 898 1 737 999 2 979 897
18.4 20.4 19.5
22.9 35.4 58.2
490 276
deciduous coniferous
1 356 655 1 864 346 3 221 001
18.4 19.4 19.0
25.0 36.1 61.1
82 717 205
19.1
1579.9
±1.25
±103.5
Schleswig-Holstein
Lower Saxony, Hamburg & Bremen North Rhine-Westphalia
Rhineland-Palatinate
Baden-Wuerttemberg
Bavaria
Saarland
Saxony
Saxony-Anhalt
Thuringia
Germany
10 320 601
Uncertainty
www.geosci-model-dev.net/4/1019/2011/
Geosci. Model Dev., 4, 1019–1034, 2011
1032
M. Tum et al.: Validation of modelled forest biomass in Germany using BETHY/DLR
Since it was shown previously that underestimation existed both for the areas of forests (as derived from remote sensing) and for modelled NPP, it is unsurprising that the empirical energy potential estimated from NFI data is 37 % higher than the theoretical estimate from modelled NPP.
8
Conclusions
For this study we modelled the Net Primary Productivity (NPP) of German forests for 2000 and 2001 using the dynamic biomass model BETHY/DLR. We presented a new method for the validation of modelled NPP using empirical data related to MAI of above ground biomass. Modelled NPP was converted and aggregated to a net increment of above-ground biomass per NUTS-1 unit for comparison to these empirical data. With this method we showed a high degree of correlation between modelled and empirical NPP, although the modelled NPP underestimated the empirical NPP. A comparison with data from two eddy covariance flux towers revealed that BETHY/DLR represents annual productivity patterns well (particularly for coniferous forest) but with substantial underestimation. In a second step, the sustainable theoretical energy potential of the above-ground biomass was estimated, using heating values to convert estimated above-ground biomass to energy units. For comparison, energy potentials were also calculated from empirical data, which revealed that modelled energy potentials are underestimated by 37 %, a consequence of the prior underestimation of modelled NPP. Reasons for this pattern of underestimation were discussed; in particular, it was shown that GLC2000 does not represent the spatial distribution of forest areas well due to its limited resolution. We thus argue that 1 km2 resolution is insufficient to describe the heterogeneous small-scale structure of mid-European forests. For future modelling, the use of higher-resolution land cover products might allow more accurate NPP estimation; this should be tested in future research. To facilitate the use of such products, however, there is a need for matching high-resolution datasets for vegetation metrics such as LAI. Furthermore we hypothesize that the maximum carboxylation rate and maximum electron transport rate is agedependent and thus potentially responsible for the underestimation of modelled NPP, since BETHY/DLR does not take the tree age distribution into account. Further research in this area could thus lead to more exact results. Modelled NEP, NPP and GPP are typically validated using eddy flux tower measurements, but such measurements are not available in many areas. Our presented validation method could therefore be helpful in the assessment of model outputs both at a broader spatial scale, and in less developed countries. Our method will, additionally, allow the development of a downscaling procedure for empirically derived NUTS-level data, allowing NUTS data to be partitioned Geosci. Model Dev., 4, 1019–1034, 2011
into smaller spatial units. Our MAI-based validation method should, however, be tested in additional countries, and should be comprehensively compared to validation using eddy measurements, so that the benefits and drawbacks of each method are clearly understood. This new MAI-based validation method will be useful in validating modelled NPP; as we demonstrated here, that also allows the further estimation of other metrics, such as bioenergy potentials. Such estimates of forest energy potentials play an important role in planning for a sustainable economy. More broadly, accurate and precise model results, crosschecked against empirical data, are needed for a better understanding of optimal forest management and the future possibilities of renewable energy. Acknowledgements. This study was conducted under the “Regionale und globale r¨aumliche Verteilung von Biomassepotenzialen” Project, promoted by BMVBS and the FP7 project EnerGEO (Grant agreement no.: 226364). We thank ECMWF, BMELV, and MediasFrance for providing data. BH is supported by the National Science Foundation Graduate Research Fellowship under Grant No. 1038597. Edited by: D. Lawrence
References Anderson, M. C., Norman, J. M., Diak, G. R., Kustas, W. P., and Mecikalski, J. R.: A two-source time-integrated model for estimating surface fluxes using thermal infrared remote sensing, Remote Sens. Environ., 60, 195–216, 1997. Baldocchi, D.: FLUX Footprints within and over forest canopies, Bound.-Lay. Meteorol., 2, 273–293, 1997. Baldocchi, D., Falge, E., Gu, L. H., Olsen, R., Hollinger, D., Running, S., Anthoni, P., Bernhofer, C., Davis, K., Evans, R., Fuentes, J., Goldstein, A., Katul, G., Law, B., Lee, X., Malhi, Y., Meyers, T., Munger, W., Oechtel, W., Paw, K. T., Pilegaard, K., Schmid, H. P., Valentini, R., Verma, S., Vesala, T., Wilson, K., and Wofsy, S.: FLUXNET: A new tool to study the temporal and spatial variability of ecosystem-scale carbon dioxide, water vapor, and energy flux densities, B. Am. Meteorol. Soc., 82, 2415–2434, 2001. Bartholome, E., Belward, A. S., and Achard, F.: GLC 2000: Global Land Cover mapping for the year 2000, EUR 20524 EN, European Commission, Luxemburg, 2002. Bondeau, A., Smith, P.C., Zaehle, S., Schaphoff, S., Lucht, W., Cramer, W., Gerten, D., Lotze-Campen, H., M¨ullers, C., Reichstein, M., and Smith, B.: Modelling the role of agriculture for the 20th century global terrestrial carbon balance, Global Change Biol., 13, 679–706, 2007. Burridge, D. M. and Gadd, A. J.: The Meteorological Office operational 10-level numerical weather prediction model, British Meteorological Office Tech. Notes, Nos. 12 and 48, 1974. Collatz, G. J., Ribas-Carbo, M., and Berry, J. A.: Coupled Photosynthesis – stomatal conductance model for leaves of C4 plants, Aust. J. Plant Physiol., 19, 519–538, 1992. Cox, P. M., Betts, R. A., Bunton, C. B., Essery, R. L. H., Rowntree, P. R., and Smith, J.: The impact of new land surface physics
www.geosci-model-dev.net/4/1019/2011/
M. Tum et al.: Validation of modelled forest biomass in Germany using BETHY/DLR on the GCM simulation of climate and climate sensitivity, Clim. Dynam., 15, 183–203, 1999. DeFries, D. S., Hansen, M. C., Townshend, J. R. G., Janetos, A. C., and Loveland, T. R.: A new global 1-km daaset of percentage tree cover derived from remote sensing, Global Change Biol., 6, 247–254, 2000. Dieter, M. and Englert, H.: Absch¨atzung des Rohholzpotenzials f¨ur die energetische Nutzung in der Bundesrepublik Deutschland, ¨ Arbeitsbericht des Instituts f¨ur Okonomie 2001/11, Hamburg, 2001. DiGregorio, A. and Jansen, L. J. M.: Land Cover Classification System (LCCS): Classification Concepts and User Manual for Software Version 1.0. United Nations Food and Agricultural Organization, Rome, 2001. EEA: The thematic accuracy of Corine Land cover 2000 – Assessment using LUCAS (land use/cover area frame statistical survey), EEA Technical Report, 7, 1–90, 2006. Erteld, W.: Ertragstafelausz¨uge, F¨ur den Gebrauch in der Praxis, 2nd Edn., Neumann Verlag Radebeul, 1963. Farquhar, G. D., von Caemmerer, S., and Berry, J. A.: A biochemical model of photosynthesis in leaves of C3 species, Planta, 149, 58–90, 1980. Federal Ministry of Food Agriculture and Consumer Protection (BMELV): Die zweite Bundeswaldinventur – BWI2 – Das wichtigste in K¨urze, Bonn, 2004. Federal Ministry of Transport, Building and Urban Development (BMVBS): Globale und regionale Verteilung von Biomassepotentialen, BMVBS-online publication 27/10, 2010. Federer, C. A.: A soil-plant-atmosphere model for transpiration and availability of soil water, Water Resour. Res., 15, 555–562, 1979. Food and Agriculture Organization: United Nations Educational, Scientific and Cultural Organization (FAO-UNESCO), Soil Map of the World, Volume I: Legend, UNESCO, Paris, France, 1974. Garrigues, S., Lacaze, R., Baret, F., Morisette, J. T., Weiss, M., Nickeson, J. E., Fernandes, R., Plummer, S., Shabanov, N. V., Myneni, R. B., Knyazikhin, Y., and Wang, W.: Validation and intercomparison of global Leaf Area Index products derived from remote sensing. J. Geophys. Res., 113, G02028, doi:10.1029/2007JG000635, 2008. Grammel, R. H.: Forstbenutzung, Paul Parey, Hamburg, Berlin, 1989. Hansen, M. C., DeFries, R. S., Townshend, J. R. G., Sohlberg, R., Dimiceli, C., and Carroll, M.: Towards an operational MODIS continuous field of percent tree cover algorithm: examples using AVHRR and MODIS data, Remote Sens. Environ., 83, 303–319, 2002. Hansen, M. C., DeFries, R. S., Townshend, J. R. G., Carrol, M., Dimiceli, C., and Sohlberg, R. A.: Global Pecent Tree Cover at a Spatial Resolution of 500 Meters: First Results of the MODIS Vegetation Continuous Fields Algorithm, Earth Interact., 7, 1– 15, 2003. Haxeltine, A. and Prentice, A. C.: BIOME3: an equilibrium biosphere model based on ecophysiological constraits, resource availability and competition among plant functional types, Global Biogeochem. Cy., 10, 693–709, 1996. Heinsch, F. A., Zhao, M., Running, S. W., Kimball, J. S., Nemani, R. R., Davis, K. J., Bolstad, P. V., Cook, B. D., Desai, A. R., Ricciuto, D. M., Law, B. E., Oechel, W. C., Kwon, H., Luo, H., Wofsy, S. C., Dunn, A. L., Munger, J. W., Baldocchi, D. D., Xu,
www.geosci-model-dev.net/4/1019/2011/
1033
L., Hollinger, D. Y., Richardson, A. D., Stoy, P. C., Siqueira, M. B. S., Monson, R. K., Burns, S. P., and Flanagan, L. B.: Evaluation of Remote Sensing Based Terrestrial Productivity From MODIS Using Regional Tower Eddy Flux Network Observations, IEEE T. Geosci. Remote, 44, 1908–1926, 2006. Houghton, J. T., Meira Filho, L. G., Lim, B., Treanton, K., Mamaty, I., Bonduki, Y., Griggs, D. J., and Callander, B. A.: Revised 1996 intergovernmental panel on climate change guidelines for national greenhouse inventories. Paris: IPCC/OECD/IEA, 1997. Jung, M.: Uncertainties of terrestrial carbon cycle modelling: Studies on gross carbon uptake of Europe PhD Thesis, University Hamburg, Hamburg, 2008. Kaltschmitt, M. and Hartmann, H. (Editors): Energie aus Biomasse – Grundlagen, Techniken und Verfahren, Springer-Verlag, Berlin, Heidelberg, 2001. Knorr, W.: Satellite Remote Sensing and Modelling of the Global CO2 Exchange of Land Vegetation: A Synthesis Study [PhD Thesis], Max-Planck-Institut f¨ur Meteorologie, Hamburg, 1997. Knorr, W. and Heimann, M.: Uncertainties in global terrestrial biosphere modeling 1, A comprehensive sensitivity analysis with a new photosynthesis and energy balance scheme, Global Biogeochem. Cy., 15, 207–225, 2001. Kramer, H. and Kr¨uger, H. H.: Vorrat und Nutzungsm¨oglichkeiten forstlicher Biomasse in der Bundesrepublik Deutschland, Der Forst- und Holzwirt, 36, 33–37, 1981. Krinner, G., Viovy, N., de Noblet-Decoudr´e, N., Og´ee, J., Polcher, J., Friedlingstein, P., Ciais, P., Sitch, S., and Prentice, I. C.: A dynamic global vegetation model for studies of the coupled atmosphere-biosphere system. LGGE, CNRS/Universit´e Joseph Fourier, Grenoble, 2003. Luyssaert, S., Ciais, P., Piao, S., Schulze, E.-D., Jung, M., Zaehle, S., Schelhaas, M. J., Reichstein, M., Churkina, G., Papale, D., Abril, G., Beer, C., Grace, J., Loustau, D., Matteucci, G., Magnani, F., Nabuurs, G. J., Verbeeck, H., Sulkava, M., Van der Werf, G. R., Janssens, I. A., and members of the CARBOEUROPE-IP Synthesis Team: The European carbon balance, Part 3: forests, Global Change Biol., 16, 1429–1450, 2010. Mayaux, P., Hugh, E., Gallego, J., Strahler, A. H., Herold, M., Agrawal, S., Naumov, S., De Miranda, E. E., Di Bella, C. M., Ordoyne, C., Kopin, Y., and Roy, P. S.: Validation of the Global Land Cover 2000 Map, IEEE T. Geosci. Remote, 44, 1728–1739, 2006. ¨ Monsi, M. and Saeki, T.: Uber den Lichtfaktor in den Pflanzengesellschaften und seine Bedeutung f¨ur die Stoffproduktion, Jpn. J. Bot., 14, 22–52, 1953. Monteith, J. L.: Evaporation and Environment in the State and Movement of Water in Living Organisms, Sym. Soc. Exp. Biol., 19, 205–234, 1965. Pistorius, T. and Zell, J.: Die Dynamik der Kohlenstoffvorr¨ate in Baden-W¨urttemberg zwischen 1987 und 2002 – Ver¨anderungen in der Waldbiomasse und Modellierung der Holzproduktspeicher, Allg. Forst Jagdztg, 176, 111–120, 2005. Potter, C. S., Randerson, J. T., and Field, C. B.: Terrestrial ecosystem production: a process model based on global satellite and surface data, Global Biogeochem. Cy., 7, 811–841, 1993. Potter, C. S., Bubler, J., Crill, P., and Lafleur, P.: Ecosystem modeling of methane and carbon dioxide fluxes for boreal forest sites, Can. J. Forest Res., 31, 208–223, 2001. Potter, C., Klooster, S., Myneni, R., Genovese, V., Tan, P.-N.,
Geosci. Model Dev., 4, 1019–1034, 2011
1034
M. Tum et al.: Validation of modelled forest biomass in Germany using BETHY/DLR
and Kumar, V.: Continental-scale comparisons of terrestrial carbon sinks estimated from satellite data and ecosystem modeling 1982–1998, Global Planet. Change, 39, 201–213, 2003. Prentice, I. C., Cramer, W., Harrison, S. P., Leemans, R., Monserud, R. A., and Solomon, A. M.: A global biome model based in plant physiology and dominance, soil properties and climate, J. Biogeogr., 19, 117–134, 1992. Reichstein, M., Falge, E., Baldocchi, D., Papale, D., Aubinet, M., Berbigier, P., Bernhofer, C., Buchmann, N., Gilmanov, T., Granier, A., Gr¨unwald, T., Havr´ankov´a, K., Ilvesniemi, H., Janous, D., Knohl, A., Laurila, T., Hohila, A., Lousau, D., Matteucci, G., Meyers, T., Miglietta, F., Ourcival, J.-M., Pumpanen, J., Rambal, S., Rotenberg, E., Sanz, M., Tenhunen, J., Seufert, G., Vaccari, F., Vesala, T., Yakir, D., and Valentini, R.: On the separation of net ecosystem exchange into assimilation and ecosystem respiration: review and improved algorithm, Global Change Biol., 11, 1424–1439, 2005. Running, S. W., Thornton, P. E., Nemani, R., and Glassy, J. M.: Global terrestrial gross and net primary productivity from the Earth Obeservation System, in: Methods in Ecosystem Science, edited by: Sala, O. E., Jackson, R. B., Mooney, H. A., and Howarth, R. W., New York: Springer-Verlag, 44–57, 2000. Ryan, M. G., Gower, S. T., Hubbard, R. M., Waring, R. H., Gholz, H. L., Cropper Jr., W. P., and Running, S. W.: Woody tissue maintenance respiration of four conifers in contrasting climates, Oecologia, 101, 133–140, 1995.
Geosci. Model Dev., 4, 1019–1034, 2011
Sellers, P. J.: Canopy reflectance, photosynthesis and transpiration, Int. J. Remote Sens., 6, 1335–1372, 1985. Valentini, R.: Fluxes of carbon, water and energy of European forests, Ecological studies, Springer, Berlin, 2003. Veroustraete, F., Patyn, J., and Myneni, R. B.: Forcing of a simple ecosystem model with fAPAR and climate data to estimate regional scale photosynthetic assimilation, in: VGT, Modelling and Climate Change Effects, edited by: Veroustraete, F. and Ceulemans, R., Academic Publishing, The Hague, the Netherlands, 151–177, 1994. Verstraeten, W. W., Veroustraete, F., and Feyen, J.: On temperature and water limitation of ecosystem productivity: Implementation in the C-Fix model, Ecol. Model., 199, 4–22, 2006. Wisskirchen, K.: Modellierung der regionalen CO2 -Aufnahme durch Vegetation, PhD Thesis, Meteorologisches Institut der Rhein, Friedrich-Wilhelm-Universit¨at, Bonn, 2005. Zaehle, S., Sitch, S., Prentice, I. C., Liski, J., Cramer, W., Erhard, M., Hickler, T., and Smith, B.: The importance of age-related decline in forest NPP for modeling regional carbon balances, Ecol. Appl., 16, 1555–1574, 2006. Zhou, X., Peng, C., and Dang, Q.-L.: Formulating and parameterizing the allocation of net primary productivity for modelling overmature stands in boreal forest ecosystems, Ecol. Model., 195, 264–272, 2006.
www.geosci-model-dev.net/4/1019/2011/