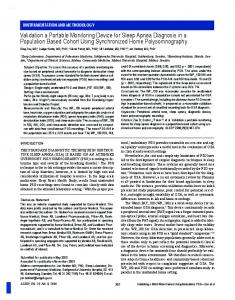
Rate sensor. Motor-driven system. Portable system. Fig. 1. Validation of hand-held muscle tone measurement device based on the motor-driven system. II.
VALIDATION OF PORTABLE MUSCLE TONE MEASUREMENT DEVICE BASED ON A MOTOR-DRIVEN SYSTEM Jia-Jin J. Chen1 , Hsin-Min Lee1 , Ying-Zu Huang2 1
Institute of Biomedical Engineering, National Cheng Kung University, Tainan, Taiwan, R.O.C. 2 Department of Neurology, National Cheng Kung University, Tainan, Taiwan, R.O.C.
Abstract- As a component of upper motor neuron syndrome, assessment of abnormality in muscle tone, including spasticity and rigidity, is a routine clinical examination. The aim of this study is to extend a sophisticated motor-driven measurement system, developed in our previous research, as a validation platform for developing a portable muscle tone measurement system. The main features of hand-held muscle tone measurement device are small angular-rate sensor for recording stretch velocity and light air-bag cuff for measuring the pressure difference at two sides of the wrist. To test the validity, the measurements recorded from the portable device shows good correlation with that recorded from the motor-driven system after removing the gravitational effect. To differentiate the normal from abnormal muscle tone, the slope of stretch resistance versus position was used to differentiate the normal muscle tone from that of a parkinsonism. However, there several factors, including the application of air-bag, the air-filled pressure, and the stretch velocity, could affect the accuracy in using the hand-held device for muscle tone assessment. Keywords - Portable, muscle tone, validation test I. INTRODUCTION
Abnormal muscle tone is a featured symptom found in upper motor neuron lesions such as stroke, spinal cord injury, and Parkinson’s disease. The hypertonia, including spasticity or rigidity, could impede normal motor function of spastic limb and limit daily life of patients. In clinics, the muscle tone is usually assessed in a score form by subjectively determining the resistance of a joint to an externally imposed passive movement. In laboratory environment, motor-driven systems which stretch the paretic limbs with various stretching modes for quantifying muscle tone have been developed [1][2][3]. However, researchers have criticized the motor-driven systems are too cumbersome and inconvenient in clinical test environment [4]. Compared to motor-driven systems, hand-held systems seem to have advantages in providing an on-line quantification of muscle tone, especially in clinical routine examination or in surgical room. However, the measurement variations introduced by the operational preferences of each individual, e.g. varied stretching velocity and manual holding resistance etc., have been less investigated. The aim of this study is to extend our previous motor-driven spasticity measurement system [5] as a reference for developing and evaluating a portable muscle tone measurement system.
Measurement device Wrist cuff
Resistance measurement
Manipulator Rate sensor
Velocity measurement
A/D Converter
Torque sensor
Motor-driven system
Display
Start
Processing Save
Exit
NoteBook PC (LabVIEW) Portable system
Fig. 1. Validation of hand-held muscle tone measurement device based on the motor-driven system II. METHODS
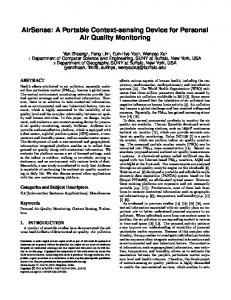
The portable system consisted of three parts including resistance measurement device, angular rate sensor and data acquis ition system (Fig. 1). The resistance measurement device was used to record the flexion and extension resistance, derived from a differential pressure sensor (DP45-34, Validyne, U.S.A.) connecting to the two chambers of the air-bag cuff at two sides of wrist. A series of fittings to the valves and vents were checked to ensure whole device a leak-tight system (Fig. 2). The angular rate sensor (ARS -C142, Watson Industries, U.S.A.) was mounted on forearm to record velocity of the stretched limb from which the position of elbow joint during stretch can be derived. The weight of the angular-rate sensor and air-bag cuff mounted on subject’s wrist was less than 80 grams which would not interfere the test procedures. The pressure difference and angular rate signals were sent to a portable PC via an A/D converter with 12-bit resolution. The data were sampled at 1 KHz and displayed in real-time for monitoring purpose. Under a circumstance in which the stretching is not valid, e.g. not enough stretching range or velocity, the data will be discarded. The calibration and validation tests of the portable muscle tone system were first performed based on our previous motor-driven system. The air-bag cuff was clipped on the manipulator under which a sensitive torque sensor was mounted directly on the stretching motor of motor-driven system. The constant-velocity stretch was elicited by the
Report Documentation Page Report Date 25 Oct 2001
Report Type N/A
Title and Subtitle Validation of Portable Muscle Tone Measurement Device Based on A Motor-Driven System
Dates Covered (from... to) Contract Number Grant Number Program Element Number
Author(s)
Project Number Task Number Work Unit Number
Performing Organization Name(s) and Address(es) Institute of Biomedical Engineering National Cheng Kung University Tainan, Taiwan, R.O.C.
Performing Organization Report Number
Sponsoring/Monitoring Agency Name(s) and Address(es) US Army Research, Development & Standardization Group PSC 802 Box 15 FPO AE 09499-1500
Sponsor/Monitor’s Acronym(s) Sponsor/Monitor’s Report Number(s)
Distribution/Availability Statement Approved for public release, distribution unlimited Supplementary Notes Papers from 23rd Annual International Conference of the IEEE Engineering in Medicine and Biology Society, October 25-28, 2001, held in Istanbul, Turkey. See also ADM001351 for entire conference on cd-rom., The original document contains color images. Abstract Subject Terms Report Classification unclassified
Classification of this page unclassified
Classification of Abstract unclassified
Limitation of Abstract UU
Number of Pages 3
computer-controlled torque motor. During constant-velocity stretching, the pressure difference and stretch velocity from the hand-held device as well as the torque and position from motor system were recorded simultaneously for further comparison.
Pressure measurement Device Tubes to wrist cuff
Vent (-) Vent (+)
Three-way connector
Check valve Pump air in
system includes an upward trend due to the gravitational effect. By subtraction of baseline torque induced by gravity, the signals from motor-driven and portable systems show a good correlation exceeding 0.95 in Fig. 4. Typical measurements of stretching velocity profile and elicited resistance for a normal and a rigid parkinsonism during to-and-fro stretching are shown in Fig. 5. By plotting the stretching position versus the stretch resistance, higher stiffness, i.e., the slope of position-resistance curve, can be observed in rigid elbow joint (Fig. 6). 0.8
Differential pressure sensor
0.6
Pump air in
Bypass Vent
Three-way connector
Check valve
Fig. 2. Pressure measurement device with various fittings and a monitor pressure gauge.
Next, the hand-held device was applied to the parkinsonian and normal subjects. The subject supinely lied on a bed with shoulder slight abducting and the air-bag cuff on his wrist. The absolute pressure in each air bag was set at 80 mmHg, which could be on-line adjusted according to the pressure meter (Fig. 2). During the experiment, the operator held the air-bag cuff and stretched the forearm back and forth at the selected velocity to observe the measurements from hand-held device.
Correlation coefficient: 0.9532
0.4
Normalize Amplitude
Bourdon-tube pressure meter
0.2 0 -0.2 -0.4 -0.6
--- : torque sensor
-0.8
… : pressure sensor
-1
0
75
Position (Degrees)
Fig. 4. Good correlation between torque signal from motor system and pressure signal from portable system after adjusting their sensitivity. IV. DISCUSSION AND CONCLUSION
(a) Velocity signal from motor system 40
0
(b) Velocity signal from rate sensor 40 20 0
100 0
(mmHg)
-2
(d) Resistance (Pressure Sensor)
(a)
Velocity
(Nt.m)
(c) Resistance (Torque Sensor) 2
The hand-held muscle tone measurement device takes the advantages of small angular-rate sensor and light wrist air-bag cuff and shows better portability for clinical use. However, several factors could affect the recording accuracy of resistance during stretching movement. First, the compliance of air-bag could counterbalance the resistance during stretching. Thus, an adequate pressure (80 mmHg in
6 0
0
-100
0
1
-6 -12
Time (Sec) Fig. 3. Comparison of velocity and resistance signals recorded from motor-driven, (a) and (c), and portable system (b) and (d), respectively.
(b)
Resistance
(Deg/Sec)
20
5
10
15
20
25
30
35
5
10
15
20
25
30
35
0 -1
0
III. RESULTS (c)
0
-100
(d)
Resistance
Fig. 3 compares the signals measured from portable and motor-driven systems during a 40 deg/sec vertical stretch. The average velocity (40.560 ± 0.464 deg/sec) measured from angular rate sensor is very close to that derived from the motor encoder (40.023 ± 0.476 deg/sec). Similar features, indicated by vertical arrows in Fig. 3(c) and (d), can be observed form the stretch resistance of two systems. However, the torque signal measured from motor-driven
Velocity
100
0
1
5
10
15
20
25
30
5
10
15
20
25
30
0 -1
0
Time (Sec) Fig. 5. The stretch velocity and resistance of the portable device for a normal, (a) and (b), as well as a rigid elbow joint, (c) and (d).
Difference of Stiffness between Normal and Abnormal muscle tone
ACKNOWLEDGMENT The authors would like to thank the National Science Council of the R.O.C. for financially supported the work under Contract No. NSC 89-2213-E-006-041.
r
o
N
REFERENCES
Position (Deg)
m
Fig. 6. Comparison of stiffness, the slope of stretch resistance versus position, between normal muscle tone and rigidity during to -and-fro movement.
d
e
z
i
l
a
this study) should be filled into the air-bag to reduce the influence of compliance. Another factor is the stretch velocity of imposed movement. In previous studies, the stretch movement was limited to relatively slow stretch velocity such that the acceleration/deceleration effects on the resistance were usually ignored [4]. However, higher stretching velocity is generally required, especially for observing velocity-dependent tests, such as the spasticity measurement. At high stretch velocity, the inertia could cause change in the resistance measurement. Unlike the constant velocity stretch in motor-driven system, higher variation in stretch velocity could occur, due to the difference in manual manipulation of each individual. These factors could deter the application of hand-held device for spasticity assessment. Moreover, using pres sure difference to represent stretch resistance seems to be less influenced by the gravitational effect (shown in Fig. 3 and 4). This could be due to that the pressure difference is the relative resistance between two air bags circumvented around the wrist. On contrast, the gravitational torque is included in the stretch torque of motor-driven system which generally records the reactive torque from the base of manipulator. This gravitational torque needs to be removed from the reactive torque. In conclusion, we evaluated the feasibility of hand-held muscle tone device in this study based on our previous motor-driven system. The major advantages of using the portable system were its flexibility and minimum intervention to the subject. However, several factors should be considered, including the air-bag compliance and stretch modes when performing the portable muscle tone measurement device. Further work should be done on standardizing experimental protocols for manual testing of muscle tone and extending the hand -held device for spasticity assessment.
[1] R.K. Powers, D.L. Campbell, and W.Z. Rymer, “Stretch reflex dynamics in spastic elbow flexion muscles,” Annals of Neurology, vol. 25, pp. 32-44, 1989. [2] A.F. Thilmann, S.J. Fellows, and H.F. Ross, “Biomechanical changes at the ankle joint after stroke ,” Journal of Neurology, Neurosurgery & Psychiatry., vol. 54, no. 2, pp. 134-9, 1991. [3] E.G. Walsh, “A review of some measurements of muscle wasting, tone and clonus in paraplegia,” Paraplegia, vol. 31, no. 2, pp. 75-81, 1993. [4] A. Prochazka, D.J. Bennett, M.J. Stephen, S.K. Patrick, R. Sears-Duru, T. Roberts, J. Jhamandas, ”Measurement of rigidity in parkinson's disease,” Movement Disorders, vol. 12, no. 1, pp. 24-32, 1997. [5] M.S. Ju, J.J. Chen, H.M. Lee, T.S. Lin, C.C. Lin, Y.Z. Huang. “Time-course analysis of stretch reflexes in hemiparetic subjects using an on-line spasticity measurement system,” Journal of Electromyography and Kinesiology, vol. 10, pp. 1-14, 2000.