... software initialy developed by [9]: https://github.com/neuropoly/axonseg. ... microscopy (possibly using electron microscope or CARS [10]), as well as.
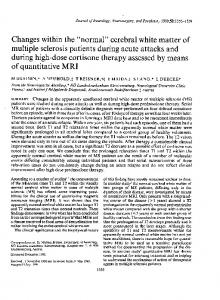
Validation of quantitative MRI metrics using full slice histology with automatic axon segmentation Tanguy Duval1, Blanche Perraud1, Manh-‐‑Tung Vuong1, Nibardo Lopez Rios1, Nikola Stikov1,2, Julien Cohen-‐‑Adad1,3 1 Institute of Biomedical Engineering, Polytechnique Montréal, Montréal, QC, Canada 2 Functional Neuroimaging Unit, CRIUGM, Université de Montréal, Montreal, QC, Canada 3 A.A. Martinos Center for Biomedical Imaging, Massachusetts General Hospital, Harvard Medical School, Charlestown, MA, United States 4 Montreal Heart Institute, Montréal, QC, Canada Synopsis. In this work we propose to validate and compare AxCaliber/ActiveAx/Noddi/MTV in the spinal cord using full slice histology with axon/myelin segmentation. High resolution data (150µm/px) were acquired on an ex vivo spinal cord and compared voxel by voxel with histology. We found that q-‐‑space metrics were precise enough to distinguish between various fiber distributions. A correlation coefficient of r=0.62 was found between AxCaliber and histology for axon ▲ Figure 1: qspace diameter metric. Also, good agreement were found between the different q-‐‑space models and with MTV. sampling of the diffusion protocols. Purpose. Many quantitative MRI methods have been proposed to measure the diameter of axons and their density (e.g. AxCaliber [1], NODDI [2] or ActiveAx [3]), as well as the volume of myelin or macromolecules (qMT, MTV [4]). Most of these a. AxCaliber b. Noddi and ActiveAx methods have been validated independently, but the exact diffusion modeling in white matter is still under debate [5,6]. In order to compare and rank the precision of different methods and models, the community needs a ground truth obtained ▶ Figure 2: from histology of a broad range of fiber distributions. In this work, we focus on the variety of diameter distribution and densities present in the spinal tracts. AxCaliber, NODDI, ActiveAx and MTV protocols were acquired on an ex vivo cat spinal Framework for the comparison of MRI cord. The precision of the extracted metrics was assessed using full slice histology with automatic axon segmentation. We quantitative metrics also make our data publicly available as a basis for future comparisons (http://www.neuro.polymtl.ca/downloads). with histology. The Methods. Tissue preparation. A cervical segment of cat spinal cord (perfused and post-‐‑fixed with paraformaldehyde 4%) optical microscopy (a) was automatically was extracted. After 24h, two contiguous 1cm pieces were cut. MRI: The first piece was scanned on a Agilent 7T animal scanner equipped with 600 mT/m gradients. The tissue was washed in PBS 5 days at 4°C before scanning and inserted into axon-‐‑segmented (b). a small glass tube filled with buffered water. A custom-‐‑made solenoid coil was used for transmission and reception (S11 ~ -‐‑ The i mage was then downsampled (c) by 40dB). One axial slice of spinal cord was acquired, matrix 64x64. Resolution was 0.16x0.16x0.20 mm3. Diffusion. A single computing the shot EPI sequence was used: BW=250kHz, TR=2s. AxCaliber. Figure 1.a. shows the qspace sampling (2D sampling perpendicular to the spinal cord). Diffusion parameters were δ=3/8/8/8 ms, Δ = 7/12/25/40 ms, G = [0 .. 849] mT/m (199 average axonal increments), TE minimized (36 -‐‑ 62ms). The minimal model of white matter (hindered and restricted in parallel cylinders) metrics in 150x150µm2 pixels. was used. Fitting parameters were (i) axon diameter index [3] (ii) fraction of restricted water (fr), and (iii) apparent Metrics were finally hindered diffusion coefficient. NODDI and ActiveAx. Figure 1.b. shows the qspace sampling. Diffusion parameters were registered on the MRI δ=3ms, Δ=30ms, 4 shells acquired with bvalue=40/189/1680/6720 s.mm-‐‑2, TE=47ms. 796 directions were acquired in (d) using affine 27min in each protocol. ActiveAx results were obtained using a two compartment model ZeppelinCylinder model and transform. MRI NODDI used a 4 compartment model WatsonSHStickTortIsoVIsoDot_B0. MTV. Macromolecular Tissue Volume (MTV) was quantitative metrics measured using the procedure described in [4]. First a T1 map was produced using an Inversion Recovery Fast Spin Echo (f) were compared [7] with 38 inversion times exponentially distributed between 3ms and 2s (hard-‐‑inversion pulse, TR=14s, ESP=6.18ms). with histology (e) Spoiled Gradient-‐‑Echo images (2 dummy scan, 16 average, TE=2.4ms, TR=24ms) were acquired using flip angles of 2,4,6,10,15,20,25 and 30°. In order to derive Myelin Volume from MTV we used a scaling factor of 1.65 evaluated from data voxel by voxel using Pearson correlation acquired on monkey corpus callosum [8]. Histology. The second piece of spinal cord was stained with osmium 4%, coefficient (g). dehydrated, embedded in paraffin, cut in 4µm slices and imaged using an optical 20x whole slice microscope (Hamamatsu NanoZoomer 2.0-‐‑HT). Resolution was 230nm/px and allowed us to segment the axons automatically. We release the MATLAB open-‐‑source axon segmentation software initialy developed by [9]: https://github.com/neuropoly/axonseg. Validation and Comparison. This procedure is described in Figure 2. Briefly, the axon-‐‑segmented image was downsampled by averaging the axon properties on 150x150µm windows and registered to MRI using affine transformation. Correlation (Pearson coefficient) was computed voxel-‐‑wise between MRI and histological metrics. Results. Figure 3 shows the MRI metrics and histology results. Figure 4 shows the correlation matrix of MRI and histological metrics, demonstrating high correlation between AxCaliber and histology for axon diameter (r=0.62) and a moderate correlation for the fraction of restricted water (r=0.38). A good correlation for the measurement of the restricted water fraction between AxCaliber and NODDI (r=0.59), ActiveAx (0.86), FA (0.83) and MTV (0.76). Discussion. This work shows for the first time a fully axon-‐‑segmented slice of spinal cord compared with various diffusion and myelin imaging Figure 3 : Quantitative MRI metrics mapping quantitative metrics. Using correlation analysis, AxCaliber was shown to be (left 2 columns) and histology mapping precise enough to distinguish between various fiber distributions present (right column). Top row. Axon diameter in the spinal cord white matter. The relatively low correlation for the metrics. Middle row. Fraction of restricted restricted fraction and Myelin Volume Fraction could be due to the unequal water. Bottom row. FA and myelin volume sensitivity of the axon segmentation software throughout the tissue. Better fraction metrics. microscopy (possibly using electron microscope or CARS [10]), as well as Figure 4 : Correlation matrix comparing histology manual correction using online crowd contribution [11] might overcome this issue. (green) quantitative diffusion MRI metrics Acknowledgments. We thank Serge Rossignol and Hugo Delivet-‐‑Mongrain for providing us with the cat spinal (orange) and quantitative myelin imaging (blue). cord, and the histology unit of the Institute for Research in Immunology and Cancer for helping with tissue Note the numbered values. Box 1 exhibits a high preparation. This study was funded by the Canadian MS Society (Duval), The Canada Research Chair in correlation (0.62) between histology and MRI for Quantitative Magnetic Resonance Imaging (JCA), the Canadian Institute of Health Research [CIHR FDN-‐‑143263], axon diameter. Box 2 presents a moderate the Fonds de Recherche du Québec -‐‑ Santé [28826], the Fonds de Recherche du Québec -‐‑ Nature et Technologies correlation (0.48) between histology and MRI for [2015-‐‑PR-‐‑182754], the Natural Sciences and Engineering Research Council of Canada [435897-‐‑2013] and the the restricted f raction. Box 3 highlights the Quebec BioImaging Network. agreement between 2D and 3D sampled q-‐‑space metrics. Box 4 highlights the link between diffusion References. [1] Y. Assaf et al., MRM, 2008, 59, 1347. [2] H. Zhang et al., NeuroImage, 2012, 61, 1000. [3] D.C. and myelin i maging. Alexander et al., NeuroImage, 2010, 52, 1374. [4] A. Mezer et al., Nat. Med, 2013, 19, 1667. [5] M. Nilsson et al., MRM, 2013, 26, 345. [6] U. Ferizi et al., MRM, 2014, 72, 1785. [7] J.K. Barral et al., MRM, 2010, 64, 1057. [8] N. Stikov et al., NeuroImage, 2015, 118, 397. [9] S. Bégin et al., Biomed Opt Exp, 2014, 5, 4145. [10] T. Duval et al., in ISMRM, 2015, 682. [11] C.R.G. Guttmann, spinevirtuallab.org