Validation, verification and uncertainty assessment for improving the Netherlands’ emission inventory L.J. Brandes*, J.G.J. Olivier and M.M.P. van Oorschot Netherlands Environmental Assessment Agency, RIVM-MNP P.O. Box 1, NL-3720 BA Bilthoven, The Netherlands *Corresponding author (
[email protected])
Abstract This paper presents recent developments in Quality Assurance and Quality Control (QA/QC) for the Netherlands’ Pollutant Emission Register (PER), which is updated annually and holds emissions for many substances. In recent years more emphasis is laid on validation activities for the PER as a whole and to verification actions and quantitative uncertainty assessments for greenhouse gases, acidifying compounds and NMVOC. This paper focuses on greenhouse gases. First an overview is provided of the quality assurance system for the annual inventory compilation and update process and the quality control (validation) activities of the PER in general and for greenhouse gases in particular. Next we describe the approach followed by the Netherlands for the improvement of the greenhouse gas inventory, with special attention for the role of uncertainty estimates of annual emissions and emission trends. We summarise the experience with the IPCC Good Practice guidance on uncertainty assessment and key source identification, including the value of higher tier uncertainty assessments. Based on this experience, we conclude with recommendations for QA/QC, emission uncertainty assessments, prioritising inventory improvements, and for improving the IPCC Good Practice guidance.
1
Introduction
The preparation of the National Inventory Report on greenhouse gas emissions in the Netherlands is based on the emission data in the national Pollutant Emission Register (PER). This general emissions database exists for many years and is organised as a project with an annual cycle. To meet the requirements of the UN Framework Convention on Climate Change (UNFCCC) and its Kyoto Protocol, improvement of calculation methodologies and procedural aspects such as on validation, documentation and reporting is necessary. The Kyoto Protocol also requires Annex I countries (i.e. industrialised countries with a quantitative emission objective) to have a so-called National System in place for the annual 19
GHG Uncertainty Workshop - Warsaw, September 24-25, 2004
compilation and reporting of emissions (the PER organisation part that deals with greenhouse gases, including the compilation of the NIR/CRF) [24]. In 2000 a programme was started to adapt the monitoring and reporting of greenhouse gases in the Netherlands and transform this part of the PER project into a National System as prescribed by the Kyoto Protocol. To comply with the EU and UNFCCC requirements, the Netherlands plans its National System to be operational in 2005. In this paper we describe the quality system in place and our experience with the improvement programme, with special attention for the role of uncertainty assessments. We conclude with recommendations for prioritising inventory improvements and for IPCC Good Practice.
1.1
The Netherlands’ Pollutant Emission Register
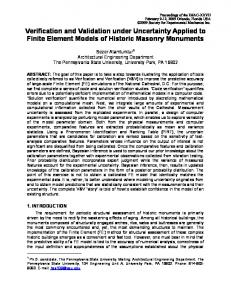
The Netherlands’ Pollutant Emission Register (PER) project comprises the inventory, analysis, localisation and presentation of emission data of both industrial and non-industrial sources in the Netherlands for several hundreds of substances. The PER is the national instrument to monitor the emissions from all sources to all compartments (air, water and soil) on a (sub-)national scale. Groups of emission ex-perts (called Task Forces) collect the data required and perform emission calculations. Agreement on definitions, methods and emission factors is discussed and reported by experts in these Task Forces. Emission data is gathered for the following so-called Target Sectors: industry, energy sector (e.g. public utilities), transport, households and services, agriculture and natural sources. The emissions of large industrial point sources are registered individually, based on their annual environmental reports (MJVs). The emissions of all other sources are calculated with statistical activity data and emission factors. The emission data are updated every year and stored in the central national database, the PER, from which information for national policy, international reporting obligations and research applications is provided (Figure 1). The Netherlands Environmental Assessment Agency (RIVM-MNP) co-ordinates the annual compilation of the PER on behalf of the Ministry of Housing, Spatial Planning and the Environment (VROM). Each year emission data are (re)compiled for the years 1990, 1995, 2000 and t-3, t-2 and t-1 (i.e. now 2003) for about 160 substances. Where possible, they also report the emissions for the other years between 1990 and t-3. The PER is established in co-operation with a number of institutes, among which Statistics Netherlands (CBS) and the Netherlands Organisation for Applied Scientific Research (TNO).
1.2
National Inventory Report for greenhouse gases
The National Inventory Report (NIR) for the UNFCCC provides overviews and explanations of the trends in greenhouse gas emissions and summarises descriptions of data sources and methods for uncertainty assessments in annual emissions and trends as required by the UNFCCC reporting guidelines [23]. For this purpose the emissions data contained in the PER are grouped according to the IPCC source categories and are supplemented with emissions for other years, often also compiled by the Task Forces. Furthermore, it describes the identification of key sources according to the IPCC Good Practice guidance [5] and quality assurance and quality control activities [7]. The NIR, including
20
GHG Uncertainty Workshop - Warsaw, September 24-25, 2004
the emission spreadsheets in the Common Reporting Format (CRF), and other related reports are electronically available at www.greenhousegases.nl. Task Force ENINA Industry, energy, waste management
CBS
Task Force Traffic Traffic and transport
TNO
RIVM-MNP
AOO
Task Force WESP Consumers, services and construction
Emissions to air, water, soil
NOVEM National Inventory Entity
National report: Environmental Balance
RIVM-MNP Pollutant Emission Register
National Inventory Report UNFCCC Other international reports, for example: UNECE CLRTAP EPER LCP Aarhus convention
Task Force Agriculture Agriculture, LUCF EC-LNV
RIZA
Task Force MEWAT Water and Waste water treatment
Figure 1: Organisation of the PER project and National System (i.e. the part that deals with greenhouse gases) in the Netherlands, 2004.
2
Quality Management
In 1997 the quality assurance1 system ISO 9001 was introduced to ascertain the quality of the monitoring process related to the PER. All procedural activities by RIVM-MNP and data processing by TNO are subject to this quality system, as well as the maintenance of the PER database by RIVM-MNP. However, the activities of actual data collection and emission calculation by the Task Forces are not yet part of the formal ISO quality assurance programme. Later, the UNFCCC and Kyoto Protocol added additional requirements to both the inventory quality and the inventory preparation process. The inventory of greenhouse gas emissions should be transparent, consistent, comparable, complete and accurate (the so-called ”TCCCA” criteria) as elaborated in the UNFCCC Guidelines for reporting [23] and the IPCC Good Practice Guidance [5]. The national inventory system should comply with so-called National System guidelines [24], such as consideration of ways to improve the quality of the inventory, amongst others based on information from the review process2 . 1 According to IPCC Good Practice the inventory definition of Quality Assurance (QA) is ”a planned system of review procedures conducted by personnel not directly involved in the inventory compilation/development process to verify that data quality objectives were met, ensure that the inventory represents the best possible estimate of emissions and sinks given the current state of scientific knowledge and data available, and support the effectiveness of the quality control (QC) programme”. The IPCC inventory definition of Quality Control (QC) is ”a system of routine technical activities, to measure and control the quality of the inventory as it is being developed. A QC system is designed to: (i) provide routine and consistent checks to ensure data integrity, correctness, and completeness; (ii) identify and address errors and omissions; (iii) document and archive inventory material and record all QC activities. QC activities include general methods such as accuracy checks on data acquisition and calculations and the use of approved standardised procedures for emission calculations, measurements, estimating uncertainties, archiving information and reporting. Higher tier QC activities include technical reviews of source categories, activity and emission factor data, and methods” [5]. These definitions have also been adopted for the Kyoto protocol [24]. 2 National System guidelines, articles 5(d) and 13 and 15 (d) [24].
21
GHG Uncertainty Workshop - Warsaw, September 24-25, 2004
To meet these international requirements a programme was started to adapt the monitoring of greenhouse gases and transforming this to a National System as required in Article 5.1 of the Kyoto Protocol. This programme consists of three main elements: (1) a monitoring improvement programme (reducing the uncertainty in the inventory), (2) development of monitoring protocols (methodology and process descriptions, including data sources and allocated responsibilities) and (3) other parts of the QA/QC system that meets the National System requirements. Next we will summarise these three elements, except for the uncertainty assessments which are discussed in a separate section.
2.1
Monitoring improvement programme
As part of the monitoring improvement programme, a series of studies and activities are being carried out to improve data quality, methodologies, documentation and data compilation procedures. This programme focuses on the use of higher tier methodologies for so-called key sources, improving data quality for these priority sources wherever this is practicable, transparent reporting and proper documentation. A workshop held in 1999 served as a starting point for the identification of priority sources [26, 27]. Based on a number of practicalities, for a selection of them improvement projects were started. These quality improvements comprise most sectors and most gases: • re-evaluation of CO2 emission factors for fuels, • improvement of CO2 emissions from waste incineration (better split into organic and fossil carbon), • a Tier-2 methodology for CO2 from feedstocks, • a Tier-2 methodology for CH4 from gas distribution and for enteric fermentation of cattle, • changing the present country-specific method for indirect N2 O emissions from soils into the rec-ommended IPCC methodology, • updating the CH4 emissions from landfills and wastewater treatment plants, • identification of significant non-CO2 sources yet included in the inventory, and • a sinks assessment. Final recalculations of the Netherlands’ greenhouse gas inventory are planned for the second half of 2004, which will include all remaining key issues identified by the Dutch improvement programme. The fuel related emissions in the PER are based on a bottom up approach [22]. Emissions from public electricity production, refineries, large industries and waste incineration are for about 75% directly reported by individual companies. For these sectors, the remainder of the emissions is estimated on the basis of calculated remaining fuel consumption and standard emission factors. However, the method for emission data collection from large industrial point sources has been changed since the mid 1990’s. Before 1995, the emission and activity data from about 700 large companies were collected, checked and processed by 22
GHG Uncertainty Workshop - Warsaw, September 24-25, 2004
TNO. Since 1996, this data collection has been gradually replaced by annual environmental reports from companies. From 1999 onwards, a group of about 250 companies are obliged to report their emissions in the standard format of annual environmental reports (MJVs). The 1999 MJVs were thoroughly analysed to establish the data quality, which led to serious doubts. For example, CO2 emissions of these companies dropped by 33% from 1998 to 1999. Another problem was the incomplete reporting of fuel use in MJVs, which resulted in a major double counting of fuel-use emissions in the industry. Although in 2001 and 2002 improvement plans were carried out, resulting in a much larger dataset with emissions of individual companies, the transparency is still insufficient. Since 2003, reporting can be done electronically, which should result in higher data quality in future. These problems and concern expressed in UNFCCC reviews on transparency and consistency led to a discussion about the reliability of the current bottom up method for fuel related emissions. Recently, Statistics Netherlands showed the feasibility of calculating fossil fuel related emissions top down based on sectoral energy statistics, which does provide more reliable as well as consistent and transparent emissions data.
2.2
Monitoring protocols: methodology and process descriptions
The general methodology for calculating emissions to air and water in the Dutch PER is described in [30]. The methodology for calculating emissions of greenhouse gases is described in more detail in [22]. For methane and nitrous oxide these methods were based on background documents [in English] prepared by [25] and [8]. Other documents on emission calculation methodology are given in the proceedings of workshops on greenhouse gas emissions and sinks in the Netherlands held in 1999 [26, 27]. In 2001 a project was started to develop specific monitoring protocols for the Dutch greenhouse gas emissions. As part of the National System, all relevant methodologies, procedures, tasks, responsibilities and such are being described in a transparent way in these protocols. The protocols cover the data collection, validation, data storage, data management and data dissemination, and are documented and will be available online (see Section 1.2). In this project, the methodologies and procedures for estimating greenhouse gas emission in the Netherlands were (re)assessed and compared with UNFCCC and IPCC requirements. Discussions include the feasibility and willingness to provide additional (sometimes confidential) data and the feasibility and costs of changing methodologies. Meanwhile all key sources are described in separate (draft) protocols. For non-key sources a separate combined ’protocol’ is elaborated.
2.3
Quality Assurance and Quality Control system
Although the PER project is executed under the ISO 9001 quality system, these quality elements do not meet all National System requirements for greenhouse gases. In 2001 a three-phase project was started to adapt the QA/QC system for greenhouse gas monitoring and the NIR/CRF compilation process. The first phase was finished in 2002 and included an assessment of the present situation as compared to the UNFCCC/IPCCC requirements (DHV, 2002). The second 23
GHG Uncertainty Workshop - Warsaw, September 24-25, 2004
phase involves the elaboration and description of relevant processes and procedures, including adaptation of the present situation. The third phase, which is scheduled for 2004, comprises the formal and legal arrangements, needed for the structural embedding of the QA/QC procedures in the PER project. This includes the legal embedding of the data provision as described in the monitoring protocols. 2.3.1
Quality Assurance
For a large part the ISO quality system already complies with key National System requirements. The Ministry of VROM commissions RIVM-MNP to draft each year a detailed plan for the compilation of the emission inventory for the forthcoming year, including responsibilities of the parties involved, members of the Task Forces, division of tasks, selection of substances and years, the list of source categories and the time schedule. Each Task Force has the task to update (or define) the protocols for the monitoring process of their specific Target Sector (see Section 2.2). At the end of the yearly project, the PER Project Group reports the necessary improvements identified for next year’s emission inventory update, based on observations made by the Task Forces. In addition, the greenhouse gas inventories were subject to a series of reviews by the UNFCCC. In general the findings of the different UNFCCC reviews are well observed and described. The Netherlands responded and made improvements in the inventory and the NIRs on several aspects: inconsistency in time series, missing notation keys, incompleteness of CRF, additional information on methodology and data sources in the NIR. Also, the Netherlands appointed Novem as National Inventory Entity under the Kyoto protocol, which has the overall responsibility for coordinating the quality management of the national system for greenhouse gases. 2.3.2
Quality Control
Each year, the Task Force members fill a standard format database with emission data as described in Section 1.1. As part of the Quality Control (QC) activities, before the data is submitted to a central database, data checks on completeness, emission levels and errors are performed. After submission to the central database, a draft data file is made. The Task Force members and other emission experts examine the time series within two weeks. These actions focus on greenhouse gases, acidifying substances, aerosols (PM10 ), Non-Methane Volatile Organic Compounds (NMVOC) and emissions to water and soil. The emissions are checked for outliers in two ways: (1) the levels per sector per year are compared with the levels published the previous year and (2) interannual differences and the overall trend per sector. This assessment is carried out at the level of main subcategories within the Target Sectors. When significant differences are found, the Task Forces evaluate the emission data in more detail, for example by sub-sector the combustion or process related emissions, emission factors and activity data. Currently, spreadsheet tools are in development to assist the Task Force members, for instance, to mark (flag) outliers in the emission trend. The UNFCCC secretariat has also, for its internal use, developed an outlier detection spreadsheet to facilitate the inventory review process. For international reporting of greenhouse gases according to the IPCC format, the emissions of
24
GHG Uncertainty Workshop - Warsaw, September 24-25, 2004
most Target Sectors need to be converted into the IPCC subcategory level of the CRF sectoral background tables, which are generally split into fuel combustion and non-combustion emission sources. Therefore, the data were also checked at the reporting format level of the IPCC Tables 7A (CRF recalculation tables). Remarkable trend changes observed are noted and discussed at an annual workshop. The result of this workshop is an action list, that is carried out or the items become footnotes and will be dealt with in the next inventory round. In most cases differences can be explained or emission figures are corrected in the database. The chairmen of the Task Forces then approve the final data file, after which the emission data are released. Later in time for the greenhouse gases, when preparing the final CRF data set, similar trend and level checks of outliers were carried out at the more detailed level of the sub-sources of all CRF sectoral background tables: annual changes in emissions of the six greenhouse gases; annual changes in activity data; annual changes in implied emission factors for CO2 , CH4 and N2 O; and level values of implied emission factors, in particular, of CO2 from combustion. Special trend and recalculation check spreadsheets were developed for this purpose. The institute responsible for the data entry checks all flagged items for correctness of the figures and the plausibility of the difference. Again, remaining flagged items are communicated with the relevant sectoral expert to explain the marked items. The explanations of both checks are used to document the differences with the previous release of the CRF in the recalculation tables and to explain unusual trends in the NIR. Due to limited capacity these detailed CRF checks are performed after the finalisation of the PER, so if additional errors are detected these are not corrected in that cycle but have to wait till next year. In future, a better planning of the inventory preparation should therefore include all QC activities prior to the fixation of the new PER dataset.
3
Uncertainty analysis
The IPCC Good Practice guidance on inventory improvement introduces the concept of key sources, which can be identified taking into account the uncertainty in the emissions [5]. In response to recommendations from an international review on this topic, the RIVM-MNP has intensified its research on uncertainty analyses [20]. For emission monitoring, this varied from methodological studies on expert assessment and the role of dependencies [3, 6, 31, 33, 34], to conducting integrated uncertainty analyses on greenhouse gas emissions [13, 10, 14, 12] and acidifying emissions [29], for which different methods have been used. Uncertainties in emission figures have been calculated according to the first-order approximation method recommended by the IPCC (’Tier-1’) and since 2001 reported in National Inventory Reports [13, 7] and in RIVM-MNP’s annual Environmental Balances [21].
3.1
Uncertainties in greenhouse gas emissions
The IPCC Tier 1 methodology for estimating uncertainty in annual emissions and trends has been applied to key sources since the National Inventory Report 2001. The Tier-1 methodology works with three major assumptions: (1) all individual emission sources are independent from each other; (2) the emission
25
GHG Uncertainty Workshop - Warsaw, September 24-25, 2004
probability shows normal, i.e. Gaussian, distributions and (3) uncertainties are smaller than 60%. Based on these assumptions, simple error-propagation rules can be applied on adding uncertainties of different sources in the emission inventory. At RIVM-MNP we have modified the IPCC Tier 1 standard error propagation formulas and removed the condition for a valid application that the error should be less than 60%. It should be stressed that most uncertainty estimates are ultimately based on expert judgement and therefore inevitably show a high degree of subjectivity. However, the reason to use these estimates is to identify the most important uncertain sources. For this purpose, a reasonable order-of-magnitude estimate of the uncertainty in activity data and in emission factors is usually sufficient. The uncertainty estimates for activity data and emission factors used in the uncertainty calculations were based on three sources [12]: (a) country-specific uncertainty estimates made or endorsed by sectoral expert groups [26, 27]; (b) other country-specific references adopted by RIVM experts; (c) IPCC default uncertainties from the Good Practice guidance [5]. The first information source was part of a workshop identifying both uncertainties and options and priorities for inventory improvement, as part of the development of the National System under the Kyoto protocol. All identified Netherlands experts on greenhouse gas emissions were invited to participate, both internal and external to the Dutch PER/NIR project, and they endorsed the proposed uncertainty estimates. The IPCC Tier 1 calculation of annual uncertainty (using a 95% confidence interval) in CO2 -eq. emissions are presented in Table 1 [7]. However, these figures do not include the correlation between source categories (e.g. energy amounts for feedstocks and fuel combustion, cattle numbers for enteric fermentation and animal manure production) or a correction for notreported sources. Therefore, the actual uncertainty of total annual emissions per compound and of the total will be somewhat higher. We estimate the resulting uncertainty in national total annual CO2 -eq. emissions at about ±5% (Table 1). Because of problems identified with recent annual environmental reports from individual companies (see Section 2.1) an extra uncertainty in national CO2 emissions was estimated for 2000 at 2% [4]. This will also be the case with 2001 and 2002 emissions. Moreover, in the last year’s ’t-1’ emission estimates extra uncertainty is introduced, due to the use of partially estimated statistics as basis for the inventory. The calculated uncertainty in the trend in the total CO2 -eq. emissions for 1990-2002 (1995 for F-gases) is ±3% points. Per individual gas, the trend uncertainty in total emissions of CO2 , CH4 , N2 O and the total group of F-gases has been calculated at ±3%, ±6%, ±11% and ±9% points, respectively [7]. In 2002, a Tier 2 uncertainty analysis was done, taking into account correlations between emission sources and specific probability density functions. This additional information is also mostly based on expert judgements. This study was not only aimed on the amount of uncertainty (quantitative uncertainty) but also focuses on the underlying causes of uncertainty (qualitative uncertainty) [14]. The study showed that the Tier 2 and Tier 1 uncertainty analyses, using similar underlying uncertainty data, resulted in similar magnitudes of overall uncertainty calculations, both for level and trend uncertainty (Tables 2 and 3). The range of confidence is similar to the trend uncertainty found in comparable studies for the UK, Norway and Austria [19]. Other conclusions of the study were that the thorough assessment of the models for emission 26
GHG Uncertainty Workshop - Warsaw, September 24-25, 2004
Greenhouse gas Carbon dioxide Methane Nitrous oxide F-gases Total CO2 -equivalents
Tier-1 uncertainty (calculated) ± 2% ± 17% ± 34% ± 21% ± 4%
Tier-1 uncertainty (estimated) ± 3% ± 25% ± 50% ± 50% ± 5%
Table 1: Calculated and estimated uncertainty of total annual emissions per compound (1990-1999) [7] estimates resulted in areas for improvement and that the quality of uncertainty data still depends to a large extent on expert estimates. Greenhouse gas Tier 1 uncertainty* Tier Carbon dioxide 2.7% Methane 16.2% Nitrous oxide 35.5% F-gases 20.3% Total CO2 -equivalents 4.5% * Calculated in NIR 2001 [13].
2 uncertainty 1.6% 14.6% 29.3% 20.0 % 3.6%
Table 2: Comparison of results of Tier-1 and Tier-2 uncertainty assessment for annual emissions, 1999 [14]. Emission trend in % Tier 1 uncertainty* Trend in CO2 -equivalents (6.1 ± 2.6) % Calculated confidence range 4.5% - 8.4% on trend * Calculated in NIR 2001 [13].
Tier 2 uncertainty (5.8 ± 2.8 % 3.5% - 8.6%
Table 3: Comparison of results of Tier-1 and Tier-2 uncertainty assessment for the 1990-1999 emission trend [14]. It should be stressed that the Tier 1 and 2 uncertainty estimates do not include limitations or biases due to the use of a simplified methods for key sources. Since 2000, when the initial estimates of the uncertainties in the inventory were made, new methods, new data and new information on uncertainty in activity data and emission factors have became available. Part of the completion of major recalculations of the Netherlands inventory planned for the end of this calendar year will be to update the present uncertainties to the new datasets.
3.2
Uncertainties in emissions of acidifying substances
Since 2000, uncertainty estimates are reported in the Environmental Balances [21]. These are based on expert judgement (mostly RIVM-MNP) and Tier-1 calculations. A preliminary analysis on NMVOC emissions showed an uncertainty range of ±26%. In a recent study by [29], the uncertainty in the contribution of 27
GHG Uncertainty Workshop - Warsaw, September 24-25, 2004
the various emission sources to total acidification (in acidification equivalents) has been assessed according to the Tier-2 methodology and estimated at ±10% (Table 4). Component NH3 NOx SO2 Total acid equivalents
Tier-1 for 1999 ±17% ±11% ± 8% ± 9%
Tier-1 for 2000 ±12% ±14% ± 6% ±8%
Tier-2 for 2000 ±17% ±15% ± 6% ±10%
Table 4: Uncertainty (95% confidence ranges) in acidifying compounds and for total acidifying equivalents for emissions in the year 1999 [21] and 2000 [29]. As for greenhouse gases, a comparison was made between the Tier-1 and Tier-2 methodology. This is not straightforward as the two studies use a different knowledge collection. The 2000 Tier-2 analysis used CLRTAP default uncertainties for several NOx processes, which explains the difference with the 1999 Tier-1 results. For NH3 , the difference between 2000 Tier-1 and Tier-2 can be explained by talking non-normal distributions and dependencies between individual emission sources for each animal type into account (both are violations against the Tier-1 assumptions; these effects were encapsulated in the 1999 Tier-1 analysis). The differences for SO2 and total acidifying equivalents are small. The 1999 study draws on the results of an earlier study on the quality of nitrogen oxides (NOx ) and sulphur dioxide (SO2 ) emissions as reported by individual companies for point sources under their national reporting requirements [3]. Besides providing quantitative uncertainty estimates, important conclusions were that a limited number of facilities showed high uncertainties, e.g. of the order of 50% or more for NOx , which could be improved with little extra effort, and that companies generally have a lack of knowledge of the uncertainty in the emissions that they report. For the study by Van Gijlswijk emission experts were systematically interviewed on quantitative uncertainties, which simultaneously provided information on the reliability and quality of the underlying knowledge base. For processes not covered by interviews, standard default uncertainties were used, according to the Good Practice Guidance for CLRTAP emission inventories [16]. The qualitative knowledge (on data validation, methodological aspects, empirical basis and proximity of used data) has been combined into a score for data strength, based on the so-called NUSAP approach [33, 17]. The qualitative and quantitative uncertainties were combined in so-called diagnostic diagrams that can be used to identify areas for improvement, as the diagrams indicate strong and weak parts of the available knowledge. Sources with a relatively high quantitative uncertainty and weak data strength are thus candidates for improvement. To effectively reduce the uncertainty, the nature of uncertainties must be known (e.g. random, systematic or knowledgeuncertainty). A general classification scheme on uncertainty typology is given in [28] (see also paper by Vreuls; this workshop).
28
GHG Uncertainty Workshop - Warsaw, September 24-25, 2004
3.3
General guidance for uncertainty management
Based on its earlier work on uncertainty assessments, the Netherlands Environmental Assessment Agency (RIVM-MNP) introduced a Guidance for Uncertainty Assessment and Communication to help RIVM-MNP researchers to gain better insight into aspects of quality and uncertainty [15, 32]. The guidance offers assistance to MNP employees in mapping and communicating uncertainties in environmental assessments. The guidance stimulates reflection during the execution of environmental assessments and is intended to signal timely which bottlenecks could occur with respect to dealing with uncertainties. The guidance offers advice on the selection of appropriate methods and available tools to adequately estimate uncertainties in the given context and to communicate them to scientific researchers, the clients (usually ministries), and other relevant stakeholders in the policy process, and the broader public. Drawing on experience with national and international emission inventories, [10] have reviewed the causes of uncertainty and other quality aspects in these inventories and provided recommendations on inventory quality management, also from a broad perspective of the suitability for the users applications [11].
4
Verification: comparison with other datasets
The assessments above assume that the calculation methodology used does not include systematic errors. It is well known that in practice this may well be the case. The IPCC Good Practice Guidance provides several options for a more independent verification of the emission level and emission trends, e.g. by comparison with atmospheric concentration measurements or by comparison of bottom-up collected data on consumption with national total apparent consumption data (i.e. a top-down calculation of production + import export). In the Netherlands these approaches have been studied for several years, funded by the National Research Programme on Global Air Pollution and Climate Change (NOP-MLK) or by the Netherlands Reduction Programme on non-CO2 Greenhouse Gases (ROB). Results of these studies can be found in, for example, [1, 18]. The inventory improvement programme for some of these sources, for example indirect emissions of N2 O, may result in adjustments of a few percent (i.e. several Tg CO2 -eq.) The impact of these methodological changes on emissions is not included in the uncertainty estimates presented here. For non-greenhouse gases, air quality measurements from the Dutch Air Quality Monitoring Network allow independent validation of emission trends. The decrease of emissions of NMVOC, NOx , SO2 , particulate matter (PM10 ), benzene, and ammonia is confirmed by the air quality measurements [9].
5
Conclusions and recommendations
We have briefly discussed the experience of the Netherlands with quality management of the national emission inventories, from which we draw the following conclusions: 1. Monitoring of industrial emissions. In principle, emissions reported by individual industrial companies may be more accurate when plant-specific
29
GHG Uncertainty Workshop - Warsaw, September 24-25, 2004
data is used and the quality of the calculation process is ensured. However, special attention is required, also in the IPCC Good Practice guidance, for transparency of reporting and for consistency in case supplemental emission estimates are needed for the non-reporting part of a sector to ensure completeness and to avoid double counting. Also, in periods of major transitions e.g. when shifting reporting responsibilities, errors can easily slip in. Comparison of company reports with total sectoral top-down estimates can be a means of verification of both estimates. 2. Monitoring protocols. Although initially a time-consuming activity, documenting and getting approval of the methodology and data sources used provides insight in the quality of the emission estimates as well as in the sources and sizes of uncertainty. The inventory compilation process will be more robust and results are less vulnerable to changes of project staff. Protocols also provide a clear start for discussions on where and why to improve the methods or data used. 3. General QA/QC. A general Quality Assurance system like ISO 9000 is a good basis for a National System under the Kyoto protocol, but it is not sufficient since the latter contains some specific organisational, procedural and documentation requirements. In addition, IPCC provides Good Practice recommendations on general QA and source-specific QC. Quality Control activities are an essential part of a QA system, as data entry mistakes or calculation errors can easily slip into these large emission datasets. Systematic checks as described are a powerful tool to flag possible errors in the dataset. This can be facilitated by specially designed spreadsheets. Sharing these amongst inventory teams would be a means of making this part of the inventory process more efficient. Documenting and archiving the extent and the main results of the QC activities is an essential part of QC as it makes transparent to users and reviewers of the inventory the effort that was made by the project team to ensure a good quality dataset. 4. Uncertainty assessments. These are a means either to provide the inventory users a quantitative judgement of the inventory quality or to direct the inventory preparation team to priority areas where improvements are warranted and can cost-effectively be made. A Tier 1 uncertainty assessment may be sufficient for this purpose, since experience with more detailed Tier 2 assessments resulted in similar magnitudes of overall uncertainty estimates. However, the IPCC Tier 1 standard error propagation calculation can be improved by taking out one of the three conditions for a valid application (that the error should be less than 60%). Focusing on the order of magnitude of the individual uncertainty estimates provides a reasonable first assessment of the uncertainty of key source categories. Applying default uncertainties, e.g. from IPCC or CLRTAP (EMEP-CORINAIR), can serve as a first start. The IPCC Good Practice provides good guidance for this process, but misses default uncertainties for number of sources. Also more specific guidance on which sub-categories to be analysed a potential key sources, in particular for fuel combustion sources, would be welcomed. When sources appear to be important for the overall uncertainty, their uncertainty estimates could be refined, in particular where regional or global defaults were used. However, one should 30
GHG Uncertainty Workshop - Warsaw, September 24-25, 2004
always keep in mind that uncertainty estimates are ultimately and unavoidably based on expert judgement of representativeness of emission factors for the circumstances of the particular source category. 5. Priority setting for inventory improvements. Besides the key source identification methodology of the IPCC Good Practice, where uncertainties are used in the Tier 2 key source identification, we showed that the so-called NUSAP analysis is a useful tool to direct improvement actions to those knowledge areas where investment are most efficient. For this analysis additional information is needed on the type of uncertainties. 6. Verification. Comparison with other, external datasets, e.g. emissions with atmospheric measurements or bottom-up activity data on consumption with apparent consumption at national level, is one of the few means to independently check for bias in the inventory. This may be useful, in particular when incompleteness or other systematic errors are suspected, but caution should be taken with respect to the precision of the conclusions drawn from the other datasets. Finally, we reiterate that uncertainty estimates and independent verification are means to identify the data quality for inventory users and to prioritise inventory improvement activities, rather than an objective in itself. Acknowledgment The improvement programme for PER project, the greenhouse gas inventory and the National System are funded by the Dutch Ministry of Housing, Spatial Planning and the Environment (VROM) and Novem. We also greatly appreciate the co-operation with various members in the Task Forces and the NIR writing team, in particular of CBS and TNO, in analysing the quality of the PER.
References [1] Berdowski, J.J.M., G.P.J. Draaijers, L.H.J.M. Janssen, J.C.Th. Hollander, M. van Loon, M.G.M. Roemer, A.T. Vermeulen, M. Vosbeek, and H. Visser (2001), Sources, Regional Scaling and Validation of Methane Emissions from the Netherlands and Northwest Europe, RIVM report 410200084, NOP, Bilthoven. [2] DHV (2002), Quality Assurance and Quality Control for the Dutch National Inventory Report. Report Phase 1, Report no. ML-BB-20010367, DHV, Amersfoort, January 2002. [3] Engelen, P.A.C., E.H.W. Pilage, E.J. Sneek, and J.H. Visser (2001), Uncertainty assessment of emissions [in Dutch], KEMA Power Generation & Sustainables, Arnhem, 25 July 2001. [4] Heslinga (2001), Investigation of the quality of Annual Environmental Reports for 2000 [in Dutch], TNO, Apeldoorn. [5] IPCC, (2000), Good Practice Guidance and Uncertainty Management in National Greenhouse Gas Inventories, IPCC-TSU NGGIP, Japan. [6] Janssen, P.H.M., A.C. Petersen, J.P. van der Sluijs, J.S. Risbey, J.R. Ravetz, (2003), RIVM/MNP guidance for uncertainty assessment and communication. Quickscan hints & actions list, Netherlands Environmental Assessment Agency (NMP), National Institute for Public Health and the Environment RIVM, Bilthoven, Available: http://www.nusap.net.
31
GHG Uncertainty Workshop - Warsaw, September 24-25, 2004
[7] Klein Goldewijk K., J.G.J. Olivier, J.A.H.W. Peters, P.W.H.G. Coenen and H.H.J Vreuls (2004), Greenhouse Gas Emissions in the Netherlands 1990-2002 - National Inventory Report 2004, RIVM report 773201008, Netherlands Environmental Assessment Agency, National Institute for Public Health and the Environment RIVM, Bilthoven, Available: http://www.greenhousegases.nl. [8] Kroeze, C. (1994), Nitrous oxide (N2 O). Emission inventory and options for control in the Netherlands, RIVM report 773001004, National Institute for Public Health and the Environment RIVM, Bilthoven. [9] MNP (2003), The Netherlands contribution to the EMEP air quality assessment report. Netherlands Environmental Assessment Agency, National Institute for Public Health and the Environment RIVM, Bilthoven, Available: http://www.emep.int/assessment/netherlands.pdf. [10] Olivier, J.G.J., and J.A.H.W. Peters (2002), Uncertainties in global, regional and national emission inventories, in: Van Ham, J., Baede, A.P.M., Guicherit, R., and WilliamsJacobse, J.F.G.M. (eds.), Non-CO2 greenhouse gases: scientific understanding, control options and policy aspects. Proc. of the Third International Symposium, Maastricht, Netherlands, 21-23 January 2002, pp. 525-540. Millpress Science Publishers, Rotterdam. ISBN 90-77017-70-4. [11] Olivier, J.G.J. (2002), On the Quality of Global Emission Inventories. Approaches, Methodologies, Input Data and Uncertainties. Thesis Utrecht University. Utrecht, Utrecht University. ISBN 90-393-3103-0, Available: http://www.library.uu.nl/digiarchief/dip/diss/2002-1025-131210/inhoud.htm. [12] Olivier, J.G.J., and L.J. Brandes (2004), Estimate of annual and trend uncertainty for Dutch sources of greenhouse gas emissions using the IPCC Tier 1 approach. Netherlands Environmental Assessment Agency, National Institute for Public Health and the Environment RIVM, Bilthoven, in prep. [13] Olivier, J.G.J., R. Thomas, L.J. Brandes, J.A.H.W. Peters and P.W.H.G. Coenen (2001), Greenhouse Gas Emissions in the Netherlands 1990-1999, Netherlands Environmental Assessment Agency, National Institute for Public Health and the Environment RIVM, Bilthoven. [14] Olsthoorn, X. and A. Pielaat (2003), Tier-2 uncertainty analysis of the Dutch greenhouse gas emissions 1999, IVM Report no. R03-06, Institute for Environmental Studies (IVM), Free University, Amsterdam. [15] Petersen, A.C., P.H.M. Janssen, J.P. Van der Sluijs, J.S. Risbey, and J.R. Ravetz (2003), Mini-Checklist & Quickscan Questionnaire RIVM/MNP, Available: http://www.rivm.nl/bibliotheek/digitaaldepot/Guidance MC QS-Q.pdf. [16] Pulles, T., and J. van Aardenne (2001), Good Practice Guidance for CLRTAP Emission Inventories, Draft chapter for the UNECE CORINAIR Guidebook on Emission Inventories, Available: http://reports.eea.eu.int/EMEPCORINAIR4/en/BGPG.pdf [17] Risbey, J, J. Van der Sluijs, and J. Ravetz, (2001), A Protocol for Assessment of Uncertainty and Strength of Emissions Data, NWS-E-2001-10, Dept. of Science, Technology and Society, Utrecht University,18pp., Available: www.nusap.net. [18] Roemer M., and O. Tarasova (2002), Methane in the Netherlands - an exploratory study to separate time scales, TNO report R2002/215. TNO, Apeldoorn. [19] Rypdal, K. and W. Winiwarter (2001), Uncertainties in greenhouse gas emission inventories evaluation, comparability and implications, Environmental Science & Policy 4, 107-116. [20] RIVM (1999), Measuring, Modelling and Uncertainty [in Dutch]. RIVM report 408129005 (main report and addendum), National Institute for Public Health and the Environment RIVM, Bilthoven, February 1999.
32
GHG Uncertainty Workshop - Warsaw, September 24-25, 2004
[21] RIVM (2001), Environmental Balance 2001. RIVM National Institute for Public Health and the Environment RIVM, Bilthoven, Available: http://www.rivm.nl/en/milieu/milieubalans verkenning/index.jsp. [22] Spakman, J., M.M.J. Van Loon, R.J.K. Van der Auweraert, D.J. Gielen, J.G.J. Olivier and E.A. Zonneveld (2003), Method for calculating greenhouse gas emissions, Report Emission Registration no. 37b, March 2003. Electronic update of original report No. 37 of July 1997, VROM-HIMH, The Hague, Available: http://www.greenhousegases.nl, electronic version only, in Dutch and English. [23] UNFCCC (1999), UNFCCC Guidelines for FCCC/CP/1999/7, UNFCCC Secretariat, Bonn.
reporting
and
review.
Doc.
no.
[24] UNFCCC (2000), Guidelines for National Systems for the estimation of anthropogenic greenhouse gas emissions by sources and removals by sinks under Article 5.1 of the Kyoto Protocol, Annex I in Doc. no. FCCC/SBSTA/2000/5, Available: http://unfccc.int/resource/docs/2000/sbsta/05.pdf. [25] Van Amstel, A.R., R.J. Swart, M.S. Krol, J.P. Beck, A.F. Bouwman and K.W. Van der Hoek (1993), Methane the other greenhouse gas; research and policy in the Netherlands, RIVM report 481507001, National Institute for Public Health and the Environment RIVM, Bilthoven. [26] Van Amstel, A.R., J.G.J. Olivier and P.G. Ruyssenaars (eds.) (2000a), Monitoring of Greenhouse Gases in the Netherlands: Uncertainty and Priorities for Improvement. Proceedings of a National Workshop held in Bilthoven, The Netherlands, 1 September 1999. WIMEK report/RIVM report 773201003, Bilthoven, May 2000. [27] Van Amstel, A.R. (ed.), (2000b), Monitoring CO2 Sinks in the Netherlands: Priorities for Improvement, Proceedings of a National Workshop held in Wageningen, The Netherlands, 24 November 1999, Wageningen University Environmental Sciences, Wageningen. [28] Van Asselt, M.B.A. (2000), Perspectives on uncertainty and risk-the PRIMA approach to decision-support, PhD thesis, Universiteit Maastricht, The Netherlands. [29] Van Gijlswijk, R., Coenen, P., Pulles, T., and Sluijs, J.P.Van der, (2004), Uncertainty assessment of NOx, SO2 and NH3 emissions in the Netherlands, TNO report R2004/100, TNO, Apeldoorn, Available: http://www.rivm.nl/bibliotheek/digitaaldepot/TNOreportRa2004.pdf. [30] Van der Most, P.F.J., M.M.J. Van Loon, J.A.W. Aulbers and H.J.A.M. van Daelen (1998), Methods for calculation of emissions to air and water (in Dutch). Report Series Emission Registration no. 44, July 1998, VROM-HIMH, The Hague. [31] Van der Sluijs, J.P., J.S. Risbey andJ. Ravetz (2002), Uncertainty assessment of VOC emissions from paint in the Netherlands. Department of Science Technology and Society, Utrecht University, Available: http://www.nusap.net. [32] Van der Sluijs, J.P., J.S. Risbey, P. Kloprogge (eds), (2003b), RIVM/MNP Guidance for Uncertainty Assessment and Communication, detailed guidance, Available at http://www.nusap.net. [33] Van der Sluijs, J.P., P. Kloprogge, J. Risbey and J. Ravetz (2003a), Towards a synthesis of qualitative and quantitative uncertainty assessment: applications of the numeral, unit, spread, assessment, pedigree (NUSAP) system, Paper for the International Workshop on Uncertainty, Sensitivity, and Parameter Estimation for Multimedia Environmental Modeling, August 19-21, 2003, Rockville, Maryland, USA, Available: http://www.nusap.net. [34] Van Oorschot, M.M.P., B.C.P. Kraan, R.M.M. Van den Brink, P.H.M. Janssen and R.M. Cooke (2003), Uncertainty analysis for NOx emissions from Dutch passenger cars in 1998. Applying structured expert elicitation and distinguishing different types of uncertainty, RIVM report 550002004, Netherlands Environmental Assessment Agency, National Institute for Public Health and the Environment RIVM, Bilthoven, Available: http://www.rivm.nl/bibliotheek/rapporten/550002004.html.
33