School of Public Health, The University of Michigan and Ann Arbor VA Medical Center, ... Resource Utilization Groups, Version III (RUG-III) is a case-mix system ...
ORIGINAL ARTICLE
Validity and reliability of Resource Utilization Groups (RUG-III) in Finnish long-term care facilities Magnus A. BjÎrkgren1, Unto HÌkkinen2, U. Harriet Finne-Soveri3 and Brant E. Fries4 1
National Research and Development Centre for Welfare and Health, Health Services Research Unit, Helsinki and Chydenius Institute, University of JyvÌskylÌ, Kokkola, Finland, 2National Research and Development Centre for Welfare and Health, Health Services Research Unit, Helsinki, 3Koskela Hospital, Helsinki, Finland, 4Institute of Gerontology and School of Public Health, The University of Michigan and Ann Arbor VA Medical Center, Ann Arbor, Michigan, USA
Scand J Public Health 1999; 27: 228^234 Resource Utilization Groups, Version III (RUG-III) is a case-mix system developed in the USA for classi¢cation of long-term care residents. This paper examines the validity and reliability of an adapted 22-group version of RUG-III (RUG-III/22) for use in long-term care facilities in Finland. Finnish cost weights for RUG-III/22 groups are calculated and di¡erent methods for their computation are evaluated. The study sample (1,964 residents) was collected in 1995 ^ 96 from ten long-term care facilities in Finland. RUG-III/22 alone explained 38.2% of the variance of total patient-speci¢c (nursing z auxiliary sta¡) per diem cost. Resource use within RUG groups was relatively homogeneous. Other predictors of resource use included age, gender and length of stay. RUG-III/22 also met the standard for good reliability (i.e. a kappa value of 0.6 or higher) for crucial classi¢cation items, such as activities of daily living and high correlation between assessments based on relative cost. Key words: case-mix, long-term care, nursing homes, patient classi¢cation, payment systems, resource use. Magnus BjÎrkgren, Chydenius Institute, PitkÌnsillankatu 1-3, FIN-67100 Kokkola, Finland. Tel: Tel: z358 6 8294226, fax: z358 6 8294 202. E-mail: magnus.bjorkgren@chydenius.¢
INTRODUCTION Case-mix classi¢cation systems describe resource utilization in healthcare. In acute care hospitals, case-mix measurement is based largely on applications of Diagnosis-Related Groups (DRGs) (1). DRGs have been implemented in the Nordic countries for management and policymaking throughout the 1990s, most recently as a payment method in health districts in southern Finland. In early applications of DRGs in the USA, it became clear that a system predicting cost of care episodes would not apply to long-term care provided to the elderly. In long-term care the variability of length of stay, and thereby of episode cost, is too great to be practical for case-mix classi¢cation and payment. Thus, another system, Resource Utilization Groups (RUGs), was developed for measuring case-mix of nursing home residents (2 ^ 4). It is based on a measure of per diem resource use. In the USA, RUG Version III (RUG-III) forms the basis for prospective payment of publicly reimbursed nursing home care. In USA Medicaid programs (public health insurance for persons with low income) accounting for about half of all nursing home expenditures, RUG-III is used for payment in one third of US states. Scand J Public Health 27
In the federal Medicare program (public health insurance for persons over 65 years), covering nearly 10% of total nursing home costs, RUG-III is being adopted for national prospective payment. RUG classi¢cations have been found to be valid across nations and healthcare systems. RUG-III has been tested successfully in long-term care facilities in England and Wales, Japan and Spain (5 ^ 7). An earlier version, RUG Version II, has been validated in Sweden and The Netherlands (8, 9). RUG-III is based on information in the Resident Assessment Instrument (RAI) and its Minimum Data Set (MDS). The RAI is a standardized assessment instrument implemented nationwide in the USA since 1990 for improving care planning and quality of care (10, 11). The RAI and the RUG-III classi¢cation are systems currently being tested in all the Nordic countries. In Iceland the RAI has been mandated by the government for use in all nursing homes since 1996 (12). We assess here the validity and reliability of an adapted, 22-group version of RUG-III (RUG-III/22) in long-term care facilities in Finland. By validity, we mean the criterion-related or predictive validity of the classi¢cation system to explain resource use in longterm care. Reliability is measured by the inter-rater # Scandinavian University Press. 1999. ISSN 1403-4948
RUG-III in Finnish long-term care facilities agreement of classifying a resident into a speci¢c RUG-III/22 group. The aim is also to derive Finnish cost weights, case-mix index, for RUG-III/22 to create a basis for a national case-mix measurement, and resource allocation in long-term care, e.g. for determining sta¤ng levels in facilities and for developing payment methods and as an output measure in studies of productivity in long-term care facilities. In Finland, local municipalities have the primary responsibility for providing institutional long-term care for the elderly. There are two basic settings for institutional care: residential homes and health centre hospitals (13). Residential homes are the most common form of long-term care facility, traditionally owned, managed, and administered through social services of single municipalities. Health centre hospitals provide care for the sickest and frailest long-term residents, although they also provide some acute care. They are owned and managed either by single municipalities or through federations of municipalities. RESOURCE UTILIZATION GROUPS, VERSION III (RUG-III) RUG classi¢cations, ¢rst developed in the USA in the mid-1980s, were produced to meet statistical, clinical and incentives criteria (2 ^ 4). The major statistical criteria included the power of the classi¢cation system to explain the cost of caring for long-term care residents, and the homogeneity of cost within the classi¢cation groups. The RUG system was also constructed to make clinical sense: that residents within groups had clinical a¤nity. Patient characteristics used to classify residents, were chosen that could be reliably assessed and which would provide incentives for appropriate care. Where possible, measures of need for service were used rather than the provision of the service itself. The latest version, RUG-III, was derived based on a sample of 7,658 residents in 203 nursing homes in seven US states (4). The system has been recently validated and slightly revised for the latest version of the MDS (Version 2.0) on an additional sample of over 2,000 residents. RUG-III classi¢es a resident into one of 44 distinct groups. The system incorporates three dimensions in describing and grouping a resident. The ¢rst dimension is represented by seven major clinical categories. These categories are devised as a hierarchy with decreasing cost intensity: 1) special rehabilitation: residents receiving di¡erent degrees of physical, occupational, or speech therapy; 2) extensive services: residents with respirator/ventilator care, parenteral feeding suctioning, or tracheostomy; 3) special care: e.g. residents with burns, coma, multiple sclerosis, pressure ulcers stage 3 or 4, quadriplegia, septicaemia, IV medications, or tube feeding; 4) clinically complex:
229
e.g. residents with aphasia, cerebral palsy, dehydration, hemiplegia, pneumonia, static ulcer, terminal illness, urinary tract infection, dialysis, or four or more physician visits per month; 5) impaired cognition: e.g. residents with impaired decision-making, orientation problems, short-term memory problems; 6) behaviour problems: e.g. residents with physical abuse, verbal abuse, or wandering; and 7) reduced physical functions: residents who do not meet the conditions of earlier categories. The second dimension, used to subdivide the major categories, is based on an ADL (Activities of Daily Living) Index, a summary measure of functional capability in four ADLs: bed mobility, transfers, eating and toilet use. The ADL Index ranges from 4 to 18, the lowest value (4) indicating independence in all four ADLs, and the highest value total dependency in these same four ADLs. The third dimension forms tertiary splits in the classi¢cation and incorporates particular services; rehabilitation provided by nurses, or problems, presence of depression. Depression is used as tertiary splits in the ``clinically complex'' category, and ``nursing rehabilitation'' as tertiary splits in ``impaired cognition'', ``behaviour problems'' and ``reduced physical functions''. Detailed information of the derivation process and RUG-III de¢nitions are provided elsewhere (4). The RUG-III/22 model Early in our empirical analysis it became clear that several groups of the original 44-group RUG-III model would be relatively rare in Finnish patterns of longterm care and the study sample. Thus, we decided to test a reduced model of RUG-III, consisting of only 22 groups. If a reduced model was supported by statistical criteria it would provide more stable estimates of the cost weights. The model we tested reduced the number of groups primarily by collapsing those groups formed by the tertiary splits (depression or nursing rehabilitation). These splits were initially constructed mainly to provide payment incentives, they added only 0.1% to the variance in cost of care explained by RUGIII. The di¡erences in relative cost between two groups formed by tertiary splits were also minimal (4). Collapsing the tertiary splits reduced the number of groups by a total of 13. Given the low numbers of heavy rehabilitation residents, we decided also to collapse the number of rehabilitation groups from 12 to 3. The task of providing special rehabilitation to elderly residents is subject to local variation in Finland, and is not only provided by their long-term care facilities. Residents were classi¢ed as ``special rehabilitation'' if they received a weekly total of 45 min or more, at least four days a week, of physical, occupational or speech Scand J Public Health 27
230
MA BjÎrkgren et al. tional 32 residents were assessed comparing a personal nurse and an outsider evaluator, nurse from other facility or building. Both samples represented patients with a range of care needs. Kappa statistics and Pearson correlations were used to represent the congruence between the judgements of two assessors. Kappa coe¤cients were calculated on RUG-III/22 group items with an average prevalence of between approximately 10% and 90%. A kappa of 1.0 denotes perfect agreement. According to Fleiss, kappa values lower than 0.40 indicate poor reliability, 0.40 ^ 0.75 adequate or good agreement, and values over 0.75 excellent agreement (14). We used weighted kappa statistics for categorical variables and simple kappa statistics for dichotomous variables; the kappa statistic then corresponds to the Spearman-Brown Intraclass Correlation Coe¤cient (ICC) (15). Validity analysis and deriving cost weights
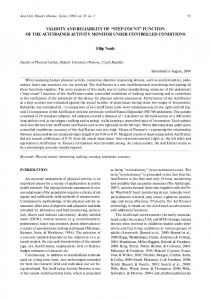
Fig. 1. RUG-III classi¢cation (original and adapted RUG-III/22 model). therapy. The revision of the ``special rehabilitation'' criteria increased the number of patients classi¢ed into this category from 38 to 80. We split this rehabilitation category into three rehabilitation groups by splitting based on the ADL Index. Beyond this, we made no structural changes to de¢nitions of other RUG-III categories. It should be noted that adopting a reduced model does not mean that residents cannot be classi¢ed according to the 44-group criteria if so desired. The advantages of our reduced model is that less information is required to classify a resident, and that the prediction of resource use is only marginally di¡erent. The classi¢cation algorithm for the original 44-group model and the adapted 22-group model with all of these changes are shown in Figure 1. MATERIALS AND METHODS Reliability analysis We tested the Inter-rater reliability of the MDS items necessary to classify a resident into a distinct RUGIII/22 group using data from two facilities: one residential home and one health centre hospital. A total of 41 subjects were assessed by two assessors operating independently who knew the resident equally well. Generally the assessors were a personal nurse and another nurse working on the same ward. An addiScand J Public Health 27
The validity analysis and calculation of cost weights were based on a sample of 1,964 residents selected from 67 wards in ten long-term care facilities in Finland. About 45% of the sample comprised residents from residential homes, with the remainder from health centre hospitals. More than half of the residents came from two large facilities in the city of Helsinki. Facilities were chosen on a voluntary basis, with a larger share of health centre hospital residents sought to assure adequate representation of heavy care residents. Wards providing care mainly for short-term residents were not included in the sample. All of the facilities operated in urban areas. Data were collected between May 1995 and February 1996. Members of the research group translated the instrument from English to Finnish. It should be noted that the sample is not necessarily representative of all residents in Finnish long-term care facilities, but for this research we only need it to be representative of the types of residents seen in these facilities. Sta¡ on the wards of eight of the facilities completed an abbreviated MDS assessment including the items necessary to classify each resident into a RUG-III/22 group; in two facilities the full MDS was used. Sta¡ members on a nursing unit/ward recorded their time caring for each resident, both in direct ``hands-on'' care and other care for the resident, such as charting, care planning meetings, etc. Care times were collected over a 24-h period. Therapist, physician and other auxiliary sta¡ time was recorded over a longer, 7-day, period as such time can be variable over a week, such as a Monday and Thursday rehabilitation schedule. Informal care time provided at the facility by family and friends was included only to the extent it replaced formal care time. To develop a cost measure, care time was weighted by cost using wage rates of respective sta¡
RUG-III in Finnish long-term care facilities Table 1.
231
Reliability estimates of the RUG-III/22 model Number of residents in test group
% agreement RUG-III/22 group
% agreement RUG-III/22 clinical category
Mean kappa RUG-III/22 all items
Mean kappa RUG-III/22 ADL items
Pearson correlation cost weights
Personal nurse vs. personal nurse
41
68%
78%
0.711
0.73
0.93
Personal nurse vs. outsider evaluator
32
44%
69%
0.592
0.68
0.78
NOTES: Kappa coe¤cient v0.40 poor agreement, 0.40 ^ 0.75 fair to good agreement, w0.75 excellent agreement (Fleiss, 1981). 1 Based on 44% of RUG-III/22 items (prevalence w10%). 2 Based on 39% of RUG-III/22 items (prevalence w10%).
category. Informal care time was weighted using the wage-weight for nursing assistant/aide. Our tests of the validity of the adapted RUG-III/22 model focused mainly on the statistical criteria, since the clinical and ``administrative'' criteria were regarded to be the same in the USA and Finland. For ¢tting RUG-III/22 models we used Analysis of Variance (ANOVA), applying regression analysis. Wageweighted patient speci¢c time served as the dependent variable. Initially, we examined four dependent variables: a wage-weighted time of nursing sta¡ only, and three others adding di¡erent categories of auxiliary sta¡. The results using di¡erent compositions of sta¡ care time did not di¡er greatly. We therefore report here only the results of wage-weighted total patient speci¢c nursingzauxiliary care time. The explanatory power of the system was measured by the percentage of variance in resource use explained by the classi¢cation (R-square). Indicator (dummy) variables represented membership in each of the RUG-III/22 groups, the basic independent variables of the analysis. In addition, we evaluated how age, gender, length of stay and ward identi¢ers increased the ¢t of the 22-group model. The homogeneity of resource use within groups was measured by each groups' coe¤cient of variation and by testing the di¡erence between group means. The cost weights for each RUG-III/22 group were calculated by dividing the group mean by total sample mean of wage-weighted patient speci¢c time. Re¢ned cost weights were calculated adjusting for factors found statistically signi¢cant in covariate analysis. The adjusted cost weights were calculated based on parameter estimates of RUG-III/22 dummy variables from regression models where the covariates were included. RESULTS Reliability analysis Overall, the agreement of two evaluators who knew the residents equally well was slightly better than the
agreement of a personal nurse and an outsider evaluator (Table 1). The percentage agreement reported indicates the proportion of residents classi¢ed by two evaluators into an identical RUG-III/22 group and main clinical category. For the comparison of two personal nurses, kappa values for each RUG-III/22 item with over 10% prevalence were statistically signi¢cant and greater than 0.40. The mean kappa 0.71 indicated good agreement. In the comparison of the personal nurse and outsider evaluator, two RUG-III/22 items in memory/recall ability were lower than 0.40 and the kappas of two additional items were not statistically signi¢cant. Overall, the mean kappa (0.59) indicated adequate or good agreement. Kappa values for ADL variables indicated high agreement in both test groups (0.73 and 0.68), ADLs are key items in determining the cost intensity of RUG-III/22 groups. It should be noted that disagreement on a single item often results in classi¢cation into a di¡erent RUG-III/ 22 group, although not necessarily with a very di¡erent resource use. For costing purposes, agreement based on cost weights is of more relevance than agreement on clinical group. The correlation coe¤cient, in comparison of cost weights from assessments performed by the evaluators who knew the residents equally well, indicated high agreement (r~0.93). The mean cost weights of each pair of assessments was 0.996 and 0.984, and the di¡erence was not statistically signi¢cant. For the other test group, the correlation was somewhat lower (r~0.78), but still acceptable. The outsider evaluator tended to grade a lower disability level than the personal nurse. The mean cost weight for the assessments by personal nurses was 0.945, while the corresponding mean by outsider evaluators was 0.864, but again the di¡erence was not statistically signi¢cant. Validity analysis and cost weights In the sample used to test the validity of the RUG-III/ 22 model, the median age of the residents was 83 years, Scand J Public Health 27
232 Table 2.
MA BjÎrkgren et al. Frequency, coe¤cient of variation (CV), and cost weights by RUG-III/22 groups
RUG-III/22 Group Name
Group code
Special rehabilitation REHAB 16 ^ 18 RFC REHAB 7 ^ 15 RFB REHAB 4 ^ 6 RFA Extensive services EXTENSIVE 2 SE2 EXTENSIVE 1 SE1 Special care SPECIAL 17 ^ 18 SSC SPECIAL 14 ^ 16 SSB SPECIAL 7 ^ 13 SSA Clinically complex COMPLEX 17 ^ 18 CD COMPLEX 11 ^ 16 CC COMPLEX 6 ^ 10 CB COMPLEX 4 ^ 5 CA Impaired cognition IMPAIRED 6 ^ 10 IB IMPAIRED 4 ^ 5 IA Behaviour problems BEHAVIOUR 6 ^ 10 BB BEHAVIOUR 4 ^ 5 BA Reduced physical functions PHYSICAL 16 ^ 18 PE PHYSICAL 11 ^ 15 PD PHYSICAL 9 ^ 10 PC PHYSICAL 6 ^ 8 PB PHYSICAL 4 ^ 5 PA All*
ADL range
16 ^ 18 7 ^ 15 4^6
17 ^ 18 14 ^ 16 7 ^ 13 17 ^ 18 11 ^ 16 6 ^ 10 4^5 6 ^ 10 4^5 6 ^ 10 4^5 16 ^ 18 11 ^ 15 9 ^ 10 6^8 4^5
CV
Cost weights
N
No adjustments
No adjustments
Adjusted for LOS, gender, age
Adjusted for ward
Adjusted for ward, LOS, gender, age
80 15 41 24 38 4 34 71 37 22 12 829 252 283 129 165 76 30 46 191 78 113 679 168 152 21 75 263 1964
0.63 0.54 0.50 0.47 0.42 0.41 0.43 0.48 0.44 0.42 0.42 0.52 0.38 0.43 0.66 0.65 0.71 0.55 0.79 0.78 0.62 0.82 0.67 0.34 0.47 0.46 0.56 0.84 0.65
1.59 2.52 1.62 0.98 1.55 1.40 1.57 1.59 1.87 1.31 1.26 1.10 1.31 1.26 0.90 0.68 0.57 0.76 0.45 0.65 0.90 0.48 0.86 1.29 1.15 1.04 0.77 0.42 1.00
1.61 2.66 1.67 0.86 1.63 1.46 1.65 1.67 2.00 1.36 1.25 1.11 1.35 1.30 0.88 0.60 0.54 0.74 0.40 0.62 0.90 0.42 0.85 1.34 1.19 1.02 0.76 0.34 1.00
1.58 2.57 1.64 0.86 1.53 1.39 1.55 1.70 2.00 1.42 1.30 1.10 1.35 1.25 0.90 0.62 0.56 0.70 0.47 0.67 0.92 0.50 0.85 1.27 1.15 0.99 0.71 0.42 1.00
1.61 2.68 1.69 0.78 1.61 1.43 1.63 1.77 2.11 1.46 1.28 1.11 1.39 1.28 0.88 0.56 0.53 0.67 0.43 0.64 0.92 0.45 0.83 1.31 1.18 0.97 0.69 0.36 1.00
*The adjusted cost weights are calibrated the same manner as the non-adjusted, i.e. the mean cost weight of all residents was set to 1.00.
females accounted for 77.5%, and the mean length of stay for the residents was 865 days. The mean sta¡ time caring for residents was 76.4 min per 24-h period, 72.3 min by nursing sta¡, and 4.1 min by auxiliary sta¡. The mean informal care time, substituting nursing care, was 8.9 min per 24 h. The case-mix adjusted mean sta¡ time was lower than that of other validation studies. (Case-mix adjusted mean sta¡ time per 24-h period using US cost weights, was 86 min for Finland, 92 min for Japan, 126 min for the USA and 148 min for England and Wales.) The average time for completing the MDS assessment form including only RUG-III items was 14 min. The distribution of residents into RUG-III/22 main clinical categories and ¢nal groups are presented in Table 2. The two largest clinical categories were ``clinically complex'' (829 residents or 42%) and ``reduced physical functions'' (679 or 35%). These two categories have similarly been the largest in other validation studies (5 ^ 7). Residents were classi¢ed into 21 of 22 posScand J Public Health 27
sible groups. The 22-group model explained 38.2% of the variance of total wage-weighted patient speci¢c time (Table 3). Our explanatory power was slightly higher than that in the England and Wales study (35.6%), which used a similar sample size, but was lower than the variance explained in the Japanese study (43.8%), and the original US derivation (55.5%). The high variance explanation in the US study has been shown to be partly due to input from rehabilitation sta¡, the variance explanation of nursing sta¡ cost alone was 41% (2). Adding dummy variables for wards to the RUG-III/22 model increased the explanatory power to 49.9%. Dummy variables for gender, age and length of stay (LOS) were all found statistically signi¢cant when added to the basic model. Adjusting for case-mix, residents with LOS of less than two weeks used about 22 min (29%) more care time than others, females used about seven min (10%) more than males, and residents under the age of 75 used six min (8%) more than those older. Interactions between gender,
RUG-III in Finnish long-term care facilities
233
Table 3. Variance explanation and covariate estimates of RUG-III/22 models RUG-III/22
Covariate estimates Length of stay (LOS) v2 weeks Female Age v75 years R-square
RUG-III/22 z LOS, gender, age
RUG-III/22 z ward
22.1*** 7.9*** 6.0* 0.382
0.400
RUG-III/22 zward LOS, gender, age 13.8*** 7.4*** 6.1**
0.499
0.508
Parameter estimates for RUG-III/22 groups and ward identi¢ers are not shown. *pv0.05. **pv0.01. ***pv0.001.
age and LOS were not statistically signi¢cant at the 0.05 level. Table 2 presents four models for calculating cost weights. In the basic non-adjusted model, the cost weights for RUG-III/22 spanned a six-fold range from PA~0.42 (low) to RFC~2.52 (high). The range between the least costly and most costly group increased somewhat in the three adjusted models. In the non-adjusted RUG-III/22 model ¢ve groups (PA, BA, IA, CA and CB) had a higher coe¤cient of variation (CV) of resource use than that of the whole sample (0.65). These less homogeneous groups were also the least costly. A majority (75%) of the group means differed statistically (pv0.05) from each other; when differences were not signi¢cant, one group was usually represented by only a few observations. Also, some overlap of cost weights was expected, as groups represent clinically di¡erent residents. The mean nonadjusted cost weight for residential home residents was 0.82, and for health centre hospital residents 1.15. Thus, the health centre residents were on average almost 30% more cost intensive than residential home residents. Within each RUG-III/22 clinical category residents of residential homes, not shown, were more concentrated into the lower ADL dependency groups than those of health centres.
DISCUSSION A simple algorithm of the Resource Utilization Groups, Version III appears to be a valid and reliable system in Finnish long-term care facilities. The interrater reliability of RUG-III/22 assessments was high, especially for crucial classi¢cation items, such as ADLs, and when comparing cost weights. The low kappa values found in memory/recall ability in the comparison of a personal nurse and outsider evaluator could be due to the fact that the ability to remember
can be highly variable for persons with impaired cognitive skills and may therefore be di¤cult to assess by an outsider evaluator. Our sample size did not allow assessment of inter-rater reliability of all individual RUG-III/22/MDS variables. Extensive reliability estimates of MDS items have been performed in the USA and in other countries (11, 16). The adapted RUG-III/22 classi¢cation alone explained a considerable amount of variation in cost (38.2%), comparable to that found in other countries. The exclusion of short-term wards may have resulted in a lower variance explanation and a lower proportion of rehabilitation residents. Resource use within groups was relatively homogeneous and the fact that the low cost groups were more heterogeneous also corresponds to results of other derivation and validation studies (4 ^ 7). The merging of original RUG-III groups to form the 22-group model did not signi¢cantly a¡ect the variance explanation and the homogeneity of groups. The adjustments and exclusion of groups in the ``special rehabilitation'' category were made based on Finnish practice patterns and the study sample. Whether the current provision of rehabilitation is adequate and e¡ective could not be determined. The cost weights of the adapted RUG-III/22 followed logical patterns increasing with higher dependency in ADLs. Health centre residents were as expected more costly than residential home residents. The cost weights computed for RUG-III/22 groups were based on relatively large group sizes. In only three groups were the number of observations less than 20. In particular, the cost weight for SE2, with only four observations, must be regarded highly unstable. Overall, the cost weights show patterns similar to those computed in other countries. Consistency of direct mean care time by RUG-III groups between ¢ve countries has been previously shown by Carpenter et al. (17). We do not know the potential bias caused by Scand J Public Health 27
234
MA BjÎrkgren et al.
including two large facilities, and only those in urban areas. It did not appear that sta¡ perceived the project as a ``time and motion study'' and that this in£uenced management decisions on sta¤ng levels. Feedback sessions indicated that the amount of training given for collecting the data was su¤cient in most, although not all, cases. The fact that age, gender and length of stay (LOS) were found to be statistically signi¢cant can be regarded as reasonable. It is plausible to assume that residents entering a facility receive more care time, controlling for case-mix, during the ¢rst few weeks due to greater service needed for ``settling in''. Younger residents (v75 years) may be more costly because of greater rehabilitation potential. It is not clear why females would be more costly than men, despite the fact that the vast majority of nursing home residents are female. If age, gender and LOS were to be used as separate outputs (e.g. for payment), it would be well founded to use the cost weights that adjust for these three variables. If ward di¡erences express productivity di¡erences, it would be reasonable to use cost weights adjusting for di¡erent sta¡ patterns. On the other hand, di¡erent sta¡ patterns may have also expressed di¡erent quality and outcomes of care, about which we had no information. Overall, the adjusted RUGIII/22 cost weights did not di¡er greatly from the non-adjusted. In conclusion, the results of this study support previous evidence on the transferability of the RUG system between healthcare systems. There appears to be good evidence of the feasibility of using the RUG classi¢cation in Nordic settings, building upon the work with the earlier version of RUGs (RUG-II) in longterm care facilities in Sweden (8). The RUG-III/22 model presented in this paper could be especially useful in applications such as information systems, as it requires fewer classi¢cation items. ACKNOWLEDGEMENTS We acknowledge the work of the Stakes' (National Research and Development Centre for Welfare and Health) project group including Timo Karjalainen, Annikki Korhonen, Mikko Nenonen, Anja Noro, Olli Nylander, Marja-Leena PerÌlÌ, Pekka Rissanen, Reijo Salmela, Reijo Tilvis, Matti Vuoristo, Mats Brommels and the administration and sta¡ of the long-term facilities participating in this e¡ort. The study was performed in collaboration with members of interRAI. The study was supported in part by the University of Kuopio, Academy of Finland, YrjÎ Jahnsson Founda-
Scand J Public Health 27
tion, PÌivikki and Sakari Sohlberg Foundation and interRAI. REFERENCES 1. Fetter RB, Brand DA, Gammache D. DRGs: Their Design and Development. Ann Arbor, Michigan: Health Administration Press, 1991. 2. Fries BE, Cooney LM. Resource Utilization Groups: a patient classi¢cation for long-term care. Med Care 1985; 23: 110 ^ 22. 3. Schneider DP, Fries BE, Foley WJ, Desmond M, Gormley W. Case mix for nursing home payment: Resource Utilization Groups, version II. Health Care Financing Review, Annual Supplement 1988; 9: 39 ^ 52. 4. Fries BE, Schneider DP, Foley WJ, Gavazzi M, Burke R, Cornelius E. Re¢ning a case mix measure for nursing homes: Resource Utilization Groups (RUG-III). Med Care 1994; 32: 668 ^ 85. 5. Carpenter IG, Main A, Turner GF. Casemix for the elderly inpatient: Resource Utilization Groups (RUGs) validation project. Age Aging 1995; 24: 5 ^ 13. 6. Ikegami N, Fries BE, Takagi Y, Ikeda S, Ibe T. Applying RUG-III in Japanese long-term care facilities. Gerontologist 1994; 34: 628 ^ 39. 7. Carrillo E, Garcia-Altes A, Peiro S, Portella E, et al. System for the classi¢cation of patients in mid and long-term care facilities: Resource Utilization Groups, version III. Validation in Spain. (in Spanish). Revista de Gerontologia 1996; 6: 276 ^ 84. 8. Ljunggren G, Fries BE, Winblad U. International validation and reliability testing of a patient classi¢cation system for long-term care. Eur J Gerontol 1992; 1: 48 ^ 59. 9. Frijters D, Van der Kooij C. Resource Utilization Groups for Nursing Home Patients in the Netherlands: SIG, Dutch Centre for Health Care Information, Utrecht, 1991. 10. Morris JN, Hawes C, Fries BE, et al. Designing the National Resident Assessment Instrument for nursing homes. Gerontologist 1990; 30: 293 ^ 307. 11. Hawes C, Morris JN, Phillips CD, Mor V, Fries BE, Nonemaker S. Reliability estimates for the Minimum Data Set for nursing home resident assessment and care screening (MDS). Gerontologist 1995; 35: 172 ^ 8. 12. Jo¨nsson PV. Letter from Reykjavik. Annals of Internal Medicine 1998; 128: 941 ^ 5. 13. Aro S, Noro A, Salinto M. Deinstitutionalization of the elderly in Finland 1981 ^ 91. Scand J Soc Med 1997; 25: 136 ^ 43. 14. Fleiss JL. Statistical methods for rates and proportions. 2nd edn, New York: John Wiley & Sons, 1981. 15. Fleiss JL, Cohen J. The equivalence of weighted kappa and the intraclass correlation coe¤cient as measures of reliability. Educ Psychol Meas 1973; 33: 613 ^ 19. 16. Sga¨dari A, Morris JN, Fries BE, et al. E¡orts to establish the reliability of the Resident Assessment Instrument. Age Aging, 1997; Suppl 26: 2:27 ^ 31. 17. Carpenter GI, Ikegami N, Ljunggren G, Carrillo E, Fries BE. RUG-III and Resource allocation: Comparing the relationship of direct care time with patient characteristics in ¢ve countries. Age Aging 1997; 26: 61 ^ 5.