Journal of Educational Psychology 2006, Vol. 98, No. 4, 891–901
Copyright 2006 by the American Psychological Association 0022-0663/06/$12.00 DOI: 10.1037/0022-0663.98.4.891
Validity and Reliability of Scaffolded Peer Assessment of Writing From Instructor and Student Perspectives Kwangsu Cho
Christian D. Schunn and Roy W. Wilson
University of Missouri—Columbia
University of Pittsburgh
Although peer reviewing of writing is a way to create more writing opportunities in college and university settings, the validity and reliability of peer-generated grades are a major concern. This study investigated the validity and reliability of peer-generated writing grades of 708 students across 16 different courses from 4 universities in a particular scaffolded reviewing context: Students were given guidance on peer assessment, used carefully constructed rubrics, and were provided clear incentives to take the assessment task seriously. Distinguishing between instructor and student perspectives of reliability and validity, the analyses suggest that the aggregate ratings of at least 4 peers on a piece of writing are both highly reliable and as valid as instructor ratings while (paradoxically) producing very low estimates of reliability and validity from the student perspective. The results suggest that instructor concerns about peer evaluation reliability and validity should not be a barrier to implementing peer evaluations, at least with appropriate scaffolds. Future research needs to investigate how to address student concerns about reliability and validity and to identify scaffolds that may ensure high levels of reliability and validity. Keywords: peer review of writing, reliability and validity, peer evaluation and instructor evaluation, writing support, the SWoRD system Supplemental data: http://dx.doi.org/10.1037/0022-0663.98.4.891.supp
1992; Magin, 2001; Rushton et al., 1993; Stefani, 1994; Swanson, Case, & van der Vlueten, 1991). They worry about the possibility of low reliability (Would the same grade be generated if it were regraded by the same grader?) and low validity (Is the grade actually reflecting deep paper quality or other, more superficial features?) of peer assessments. These worries have considerable face validity: (a) Student peer reviewers are novices in their disciplines with respect to both content knowledge and writing genre of the discipline; (b) students are inexperienced in assessing disciplinary writing quality; (c) students are prone to bias due to uniformity, race, and friendship (Dancer & Dancer, 1992); and (d) subgroups of students may form pacts to inflate their grades (Mathews, 1994). On the other hand, there are theoretical and practical reasons to suspect that peer evaluations are just as reliable and valid as instructor ratings. First, instructor ratings can have reliability problems because of shifting criteria over time as a large stack of papers are graded and a desire to rush the evaluation process when the stack of papers is large. Peers are typically given a much smaller set to evaluate and thus can spend more time on the evaluation of a given paper and not worry about shifting criteria over time. Second, the instructor usually must grade each paper alone, perhaps with the help of a single rating by a teaching assistant, whereas each paper can be assigned to multiple peers for evaluation. The reliability of several evaluators’ combined ratings is higher than the reliability of a single evaluator’s ratings (Rosenthal & Rosnow, 1991), and this multiple-ratings factor may overcome differences in the reliability of instructors versus students. Third, instructor ratings can have validity problems due to certain biases. Instructor grading in holistic assessment tasks like
Despite progress made in the past 2 decades through the Writing in the Disciplines (WID) movement, subject-matter courses rarely include serious writing tasks (National Commission on Writing in American Schools and Colleges, 2003). In part, this is an instructor workload issue: Writing evaluation is extremely time and effort intensive (National Commission on Writing in American Schools and Colleges, 2003; Rada, Michailidis, & Wang, 1994). One possible solution to the writing evaluation problem is to use peers in the class to grade papers rather than the instructor (Rada et al., 1994). In addition to reducing the workload of instructors, peer assessment might help students (a) develop evaluation skills that are usually ignored in formal education, (b) develop responsibility for their own learning (Haaga, 1993), and (c) learn how to write (Rushton, Ramsey, & Rada, 1993). However, students and instructors are leery of peer grading schemes (Boud, 1989; Cho & Schunn, in press; Lynch & Golen, Kwangsu Cho, School of Information Science & Learning Technologies, University of Missouri—Columbia; Christian D. Schunn and Roy W. Wilson, Learning Research and Development Center, University of Pittsburgh. This project was funded by grants from the University of Pittsburgh Provost Office and the Andrew Mellon Foundation. We thank Melissa Nelson for preparing the supplemental materials. SWoRD is free to use for noncommercial purposes. It is available at http://sword.lrdc.pitt.edu. Potential users are encouraged to visit the site or contact Kwangsu Cho or SWoRD at
[email protected]. Correspondence concerning this article should be addressed to Kwangsu Cho, School of Information Science & Learning Technologies, University of Missouri—Columbia, 303 Townsend Hall, Columbia, MO 65211. E-mail:
[email protected] or
[email protected] 891
892
CHO, SCHUNN, AND WILSON
writing evaluation may be influenced by performance expectations the instructor has for particular students, whereas peers in a large content class are unlikely to have performance expectations for randomly selected peers. Fourth, the performance expectations and knowledge levels of instructors are sometimes so much higher than those of students (Cho, Chung, King, & Schunn, in press; Hinds, 1999; Kelley & Jacoby, 1996) that an instructor can have trouble distinguishing among performance levels at the low end of the scale. Students who themselves are in the middle of that distribution may, however, have an easier time perceiving differences. In other words, there may be a floor effect on instructor perceptions of student writing quality that reduces the validity of their ratings. Finally, in course settings in which student writing quality is very heterogeneous, this heterogeneity may be obvious to students. Objects that differ greatly in quality need not require great sensitivity. Indeed, Falchikov and Goldfinch (2000) found that peer assessments were more valid when global assessments rather than individual dimension assessments were used.
Literature Review of Reliability and Validity of Peer Assessments of Writing A search through ERIC and PsycINFO databases of peerreviewed journals found only six prior studies that collected unbiased measures on the validity or reliability of peer assessments of writing (Cheng & Warren, 1999; Falchikov, 1986; Haaga, 1993; Marcoulides & Simkin, 1995; Mowl & Pain, 1995; Stefani, 1994). Validity is sometimes misreported in the literature as reliability (Topping, 1998). This review reports what was actually studied, rather than what was claimed to have been studied, which should clarify what in fact the previous literature has found. All studies investigated performance in a single course and had sample sizes between 45 and 63 participants. Each study pertained to a different discipline (biology, geography, electrical engineering, psychology, and computer science). All but one involved firstor second-year undergraduates, with the remaining study (Haaga, 1993) having involved graduate students. All of the studies focused on validity or reliability from the instructor perspective. None of the studies investigated the student’s (objective) view of validity or reliability even though students are one of the stakeholders of peer-generated grading. Four of the six articles investigated validity (Cheng & Warren, 1999; Falchikov, 1986; Mowl & Pain, 1995; Stefani, 1994). Falchikov (1986) looked at percentage agreement between a single peer rating and a single faculty member rating. This approach is not optimal because it confuses agreement with real ability to detect quality. Three articles did not describe exactly how validity was evaluated, but it is likely that the validity was computed in the usual way by comparing the mean of peer assessments against instructor assessments. Mowl and Pain (1995) and Cheng and Warren (1999) reported low validity (r ⫽ .22 in geography and r ⫽ .29 in electrical engineering), and Stefani (1994) found high validity (r ⫽ .89 in biology). None of the four studies investigated reliability of peer assessments, and so it is not known whether the problems were really ones of validity (i.e., Did students know what to look for?) or actually problems of reliability (i.e., Did the students agree with one another?).
Two of the six articles investigated reliability but used very different metrics. Haaga (1993) looked at the Pearson product– moment correlation between pairs of graduate students assessing common papers and found a relatively high correlation (r ⫽ .55). Marcoulides and Simkin (1995) looked at undergraduate performance by using a percentage-of-variance approach. They found that 69% of the variance in individual ratings could be explained by overall paper quality effects, 31% by the interaction of reviewers with paper quality (i.e., the noise in student ratings), and 0% by main effect differences in reviewer ratings (i.e., bias). In summary, the literature review reveals that there are good theoretical reasons both for and against the reliability and validity of peer-generated grades. The previous empirical work is not large, has ignored reliability, and has had mixed results. In addition, the past research focused on the perspective of the instructor concerning reliability and validity: Should the instructor trust the grades? Although the literature on peer assessment concludes that peer assessment appears valid (for reviews, see Falchikov & Goldfinch, 2000; Topping, 1998), the validity and reliability of peer assessments of writing are still open questions that need to be addressed in a larger scale study using a common metric, across many courses and levels of students, looking at both reliability and validity. Considering that students are also key stakeholders and may have a different perspective from instructors (Cho, Schunn, & Charney, 2006), the current study addresses the validity and reliability of peer-generated grades from the instructor perspective and also from the student perspective. Any instructional activity that causes deep concern in students is less likely to be adopted, especially in university settings in which teaching quality is primarily evaluated by students rather than by direct learning measures.
Instructor Versus Student Views Instructors and students are two different stakeholders in grading, and they may have very different views regarding reliability and validity. It is possible that peer grades are reliable and valid from the instructor’s perspective while being perceived as unreliable and invalid from the students’ perspective (Rushton et al., 1993). After surveying student perceptions before and after participation in peer assessment, Rushton et al. (1993) found that Prior to the exercise, a large majority of students considered peer assessment to be less fair, accurate, informed and stringent than teacher assessment. Following the exercise, the students were even less favorable towards [peer] assessment. . . . [Yet] contrary to the student expectations, there was little difference between those marks awarded by the students and those by the tutor. (pp. 78 –79)
Thus, even if an instructor finds that the validity of peer grades is high, the experience of students may lead them to doubt the validity of peer-generated grades. Consistently, Topping, Smith, Swanson, and Elliot (2000) wrote, “acceptability to students is various and does not seem to be a function of actual reliability” (p. 152). Why would instructors and their students have different perspectives on reliability and validity in the same setting? The answer to this question likely lies in the observation that the instructor has access to grades for all papers, whereas the students only see grades on their own papers (and perhaps one or two more by social comparisons with friends). This macro- versus micro-
PEER ASSESSMENT
difference in perspective has consequences for how each stakeholder estimates validity and reliability.
Validity Normally validity is calculated across papers. The instructor could compare the rank ordering or Pearson product–moment correlation of his or her own judgments with peer-generated ratings across papers. By contrast, students would be forced to look only at how the peer-generated grades for their paper deviate from the one instructor-generated grade for their paper. The deviation measure used by the student is influenced by bias and consistency factors, whereas the instructor measure of validity allows for the separation of consistency and bias. In addition, the student frequently does not have an instructor-generated grade as a point of reference: One common goal of peer-generated grades is to relieve the instructor of that burden. In this situation, the student must assess the validity of peer-generated grades by comparison with a self-assessment of paper quality. However, unknown to most students, self-assessments are generally less accurate than peer assessments (Stefani, 1994) and tend to be influenced more by self-esteem than actual performance (Hewitt, 2002).
Reliability Regarding the reliability of the peer-generated grades, students focus on the distribution of grades they receive: The greater the spread of grades, the less reliable (they may reason) is the grading. Of course, this perspective confuses inconsistency with bias—it is possible that all graders were highly reliable, but peers used different anchor points for their ratings. Instructors can examine consistency within the peer grades separately from threshold differences and thus have a more accurate measure of reliability. A second difference regarding instructor versus student views of reliability is that the instructor can, as we shall describe, take into account the effective reliability of ratings generated by a set of
893
peers, whereas each student is restricted to a consideration of the reliability of individual peer ratings. As the number of peer reviews per paper increases, the difference between the instructor view of reliability (as effective reliability) and the student view of rating reliability can become more extreme.
Overview of the Study In the present study, peer assessments were carried out under so-called scaffolded peer review: Students were given guidance on peer assessment, they used carefully constructed rubrics, and they were provided clear incentives to take the assessment tasks seriously. The question of this study was whether this approach to peer review generally provides highly reliable and valid peer assessments across different university settings of peer review of writing. The research question was examined from the instructor perspective and also from the student perspective to discover why instructors improve their perception on peer assessment, whereas student perception tends to be worse over peer assessment experiences. The analysis of the question was carried out with data gathered across 16 different courses, across many disciplines at the graduate and undergraduate level, using a common Web-based system for implementing a particular approach to scaffolded peer evaluation of writing. Although reliability was assessed in all of the courses, validity was assessed in five courses: those for which we were able to obtain instructor ratings of paper quality.
Method Participants Data were collected from 708 students (61% female) across 16 courses over a 3-year span (see Table 1). Four of the courses were graduate courses (3 lower level and 1 upper level), and 12 were undergraduate courses (7 lower level and 5 upper level). The covered disciplines were most commonly Cognitive Psychology (n ⫽ 7), and three of them were those for
Table 1 Participant Information Course ID G01 G02 G03 G04 U01 U02 U03 U04 U05 U06 U07 U08 U09 U10 U11 U12
Course level Graduate low Graduate low Graduate low Graduate high Undergraduate Undergraduate Undergraduate Undergraduate Undergraduate Undergraduate Undergraduate Undergraduate Undergraduate Undergraduate Undergraduate Undergraduate
high low low low low high low low high high high low
Note. G ⫽ graduate; U ⫽ undergraduate. Courses for nonmajors.
a
Discipline
University
No. of students in course
Cognitive Psychology Cognitive Psychology Psychological Methods Health Psychology Psychological Methods Cognitive Psychologya Cognitive Psychologya Cognitive Psychology Cognitive Psychologya Education Honors Course History Cognitive Science Rehabilitation Leisure Studies Cognitive Psychology
A A C A A A A A A B B A A A B D
12 23 12 11 32 103 79 78 80 13 13 102 26 10 17 97
% female
No. of reviewers per paper
Instructor review?
58 57 67 64 75 68 72 69 61 85 69 35 54 100 41 58
6 6 4 4 6 6 6 3 6 6 6 6 6 6 3 4
Yes Yes No No Yes Yes No No No No No Yes No No No No
894
CHO, SCHUNN, AND WILSON
nonmajors but also included two Psychology Research Methods courses and one course each from Health Psychology, Cognitive Science, Education, Rehabilitation Sciences, Leisure Studies, History, and the (interdisciplinary) Honors College. The 16 courses came from four different universities. University A is a mixed public–private, midsized, Tier 1 research university (11 courses). Universities B and C are large public, Tier 3 research universities (3 and 1 courses, respectively). University D is a small private, primarily teachingfocused university (1 course). The courses varied in size. Ten were small, varying from 10 to 32 students. Six were large, varying from 78 to 103 students. Not surprisingly, the graduate courses were small, although there were several undergraduate courses that were also quite small. In all cases, the participants were taking a regular content course that also required some peer-assessed writing. Course grades were partly determined by the writing and reviewing work. Courses varied in the particular weight assigned to writing–reviewing work and whether grades were entirely determined by peers or by combining peer and instructor evaluations together. The weightings used in the courses were not all available, but typically writing and reviewing together accounted for approximately 40% of the final course grade. Instructor evaluations of the papers were obtained in five courses. These evaluations made it possible to assess the validity of peer assessments in three small courses in psychology (two graduate and one undergraduate) and two large undergraduate courses (one in psychology and one in history). In small courses, instructors produced assessments during the course that counted toward the writing grade of students. In large courses, instructors produced assessments during the summer break for pay because these large courses were considered to be too large to normally involve instructor-graded writing assignments. All instructors had had significant prior experience in grading papers of the type assigned in their course. None of the other course instructors produced assessments.
Writing Task The exact writing task assigned to students varied across the courses, as one would expect across content courses from many different disciplines. The required length of the assigned papers varied from shorter (5– 8 pages) to longer (10 –15 pages) papers. Paper genres included (a) the introduction section to a research paper, (b) a proposal for an application of a research finding to real life, (c) a critique of a research paper read for class, and (d) a proposal for a new research study.
Peer Assessment System: SWoRD All courses used SWoRD (scaffolded writing and rewriting in the discipline; Cho & Schunn, in press), a system for implementing peer review of writing. SWoRD is a Web-based application (http://sword.lrdc.pitt.edu) that (a) helps manage the distribution of papers to reviewers and reviews back to authors (similar to current online conference, journal, and grant reviewing systems) and (b) includes evaluation mechanisms that force students to take their reviewing task seriously. Revision is a core feature of SWoRD that distinguishes it from other Web-based peer review systems (e.g., calibrated peer review or http://TurnItIn.com): Students must submit two drafts, and peers evaluate both drafts. Here we provide a detailed overview of the SWoRD (Version 3) process, focusing on the aspects of scaffolding that pertain to review consistency. For more detailed information on the SWoRD system, see Cho and Schunn (in press) or visit the SWoRD Web site at http://sword.lrdc.pitt.edu. The instructor can adjust several parameters of the process, including the number of papers each student must write, the number of peer reviews each paper will receive (and thus how many reviews each student must complete), and the amount of time given to students for writing a first draft, evaluating first drafts, rewriting a first draft, and evaluating final drafts.
Typically, students write one paper (with two drafts), each draft paper receives five or six peer reviews, and students are given 2 weeks for each phase. As noted in Table 1, the most common deviation from this default is in the number of reviews required for each paper. SWoRD processing consists of the following eight steps. In Step 1, students create an account in the system and specify a pseudonym. Papers are later distributed to authors under this pseudonym in order to reduce any status biases that may occur in peer review. Reviewers are only identified to authors by number (e.g., Reviewer 1, Reviewer 2, etc.) to ensure there is no retribution between particular authors and reviewers. In Step 2, authors upload their draft paper sometime before the first draft deadline. Any file type is allowed, but usually Microsoft Word, Rich Text Format, or PDF are uploaded. Once the submission deadline has passed, each author’s draft is assigned to n peers, where n is prespecified by the instructor (usually five or six). A moving window algorithm is used to ensure that no two drafts are assigned to the same set of n peers. In Step 3, reviewers log in sometime during the review period and download the n papers assigned to them. They also download a Microsoft Word version of the fixed rubric to guide their evaluation. Sometime before the end of the review period, reviewers again log into the system and paste their written comments into html forms associated with the evaluation rubric. In addition, they rate each draft on three 7-point evaluation dimensions with a grading rubric for each scale point (described below). Ratings are used to determine the grade for the draft, and the comments are meant to serve as helpful feedback to guide authors in their revisions. SWoRD requires written comments to be entered for each evaluation dimension before the evaluation rating is made: This procedure order encourages reviewers to base ratings on substance rather than intuition. When the review deadline has passed, these evaluations and comments are made available to authors. In Step 4, when the review deadline has passed, SWoRD automatically determines grades for authors and numerical evaluations for reviewers; grades for the quality of written comments are determined later. Reviewer evaluation grades are based on three automatically determined measures of review consistency. The audience of the paper assignments is typically set to be peers in the class, so it is assumed that the average rating assigned a paper is the most correct rating. As a result, reviewers are penalized for systematic deviations from this average rating. The three consistency measures separately diagnose (a) problems in relative ordering of paper quality, (b) systematically high or low evaluations, and (c) systematic problems in how broadly or narrowly evaluations are made. The goal of the consistency grades is to force some accountability on the peer-grading task and to encourage reviewers to consider a broader audience than just themselves. The grade assigned to a paper is a weighted average of the peer ratings of that paper, with the weighting factor being the overall consistency grade assigned to each reviewer. In this way, authors are shielded from atypically incompetent or unmotivated reviewers. In Step 5, students log into the system to view the evaluations of their first draft and begin the draft revision process. At this point, each student sees the full set of comments on his or her draft paper, the ratings assigned to that paper by each reviewer, the system’s assessment of each reviewer’s consistency, his or her overall writing grade so far in relation to the class mean, the system’s assessment of his or her own reviewing consistency, and his or her overall reviewing grade so far relative to the class mean. In Step 6, prior to the final draft deadline, each student logs in to the system and uploads his or her final draft. That draft is distributed to the same peer reviewers as used in the first round of reviewing. Once the draft has been submitted, each author is asked to rate the helpfulness of each review he or she received, using a 7-point helpfulness scale, from 1 (not helpful at all) to 7 (very helpful). These ratings constitute the other half of the reviewer’s reviewing grade and serve to encourage reviewers to take the written review task seriously.
PEER ASSESSMENT In Step 7, each reviewer logs in, downloads the final drafts assigned to him or her, and begins the final draft review process. The same rating rubric is used as for the first draft, but the comment-giving task focuses on evaluating the changes made rather than providing suggestions for further improvements. Reviews of final drafts must be turned in by a specified deadline, at which point reviewing consistency grades for the final draft round and final draft writing grades are computed using the same approach described in Step 4. In the final step, authors see the grade assigned to their final draft and comments. They are asked to grade the helpfulness of the final draft comments using the 7-point scale noted earlier. These helpfulness ratings constitute the final element in a student’s grade. The instructor assigns the relative (typically equal) weight given to writing and reviewing grades. SWoRD automatically places equal weight on first and final draft activities, and equally weights reviewing rating consistency and comment helpfulness.
Writing Evaluation Dimensions Papers are evaluated on three dimensions, using for each a 7-point scale ranging from 7 (excellent) to 1 (disastrous). The default dimensions in SWoRD are flow, logic, and insight. The flow dimension, the most basic, concerns the extent to which the prose of a paper is free of flow problems (Flower, Hayes, Carey, Schriver, & Stratman, 1986). The logic dimension addresses the extent to which a paper is logically coherent (i.e., Is a text structure that links arguments and evidence in a well-organized fashion?). The insight dimension accounts for the extent to which each paper provides new knowledge to the reviewer, where new knowledge is operationally defined as knowledge beyond course texts and materials. For each point on the 7-point scale associated with each dimension, there is a sentence that describes the nature of a paper deserving that rating.
895
The focus of the current study was on the validity and reliability of the overall paper ratings, defined as the summed score across dimensions. With respect to grades, it is these ratings that most concern instructors and students. However, because grading rubrics likely influence the reliability and validity of reviewing, the rubric details are presented in Table 2.
Statistical Method Measure of validity. The instructor view of validity can be measured as a linear association between the vector of instructor ratings and the vector of mean student ratings, where the rating of each paper is one element of each vector. In keeping with the approach typically taken in the literature, we use the Pearson product–moment correlation between the arithmetic mean of peer ratings and the instructor rating. Large positive correlations indicate high validity. Pearson product–moment correlations are less influenced by distributional patterns of ratings (i.e., whether some ratings are especially common) than are percentage agreement measures and thus more appropriate as an assessment of validity that generalizes across settings (Hunter, 1983). Some prior researchers have been concerned that peer-generated grades are systematically too high or too low. In SWoRD, grades are curved and thus systematic deviations are irrelevant. Moreover, the review consistency measures discourage grade inflation, and the overall mean of student ratings is usually within a 10th of a standard deviation of the overall mean of instructor ratings. The student view of validity (SV) is estimated as the root-mean-squared distance between the peer ratings of a given paper and the instructor rating of that paper. In other words, the student measure of validity is the square root of the sum of the squared differences divided by the number of peer ratings minus 1 (to produce an unbiased estimate). Squaring amplifies the discrepancy between the instructor rating and peer ratings: Highly discrep-
Table 2 Anchor Points for Each of the Three Evaluation Dimensions Used in the SWoRD Paper-Reviewing Task Dimension Flow
Logic
Insight
Rating
Rubric
7. Excellent 6. Very good 5. Good
All points were clearly made and very smoothly ordered. All but 1 point was clearly made and very smoothly ordered. All but 2 or 3 points were clearly made and smoothly ordered. The few problems slowed down the reading, but it was still possible to understand the argument. All but 2 or 3 points were clearly made and smoothly ordered. Some of the points were hard to find or understand. Many of the main points were hard to find and/or the ordering of points was very strange and hard to follow. Almost all of the main points were hard to find and/or very strangely ordered. It was impossible to understand what any of the main points were and/or there appeared to be a very random ordering of thoughts. All arguments were strongly supported and there were no logical flaws in the arguments. All but one argument was strongly supported or there was one relatively minor logical flaw in the argument. All but two or three arguments were strongly supported or there were a few minor logical flaws in arguments. Most arguments were well supported, but one or two points had major flaws in them or no support provided. A little support presented for many arguments or several major flaws in the arguments. Little support presented for most arguments or obvious flaws in most arguments. No support presented for any arguments or obvious flaws in all arguments presented. I really learned several new things about the topic area, and it changed my point of view about that area. I learned at least one new, important thing about the topic area. I learned something new about the topic area that most people wouldn’t know, but I’m not sure it was really important for that topic area. All of the main points weren’t taken directly from the class readings, but many people would have thought that on their own if they would have just taken a little time to think. Some of the main points were taken directly form the class readings; the others would be pretty obvious to most people in the class. Most of the main points were taken directly form the class readings; the others would be pretty obvious to most people in the class. All of the points were stolen directly from the class readings.
4. 3. 2. 1.
Average Poor Very poor Disastrous
7. 6. 5. 4. 3. 2. 1. 7. 6. 5.
Excellent Very good Good Average Poor Very poor Disastrous Excellent Very good Good
4. Average 3. Poor 2. Very poor 1. Disastrous
Note. SWoRD ⫽ scaffolded writing and rewriting in the discipline.
CHO, SCHUNN, AND WILSON
896
ant ratings are psychologically salient and suggest to the student lower validity. For this measure, the higher the score, the lower the perceived validity. Measures of reliability. The instructor’s perspective on reliability focuses on the consistency of individual student ratings of papers. As with validity, it is desirable to use measures that are uninfluenced by distributional features, so correlation measures are preferred to percentage agreement measures. One cannot rely, however, on Pearson product–moment correlations. Each student evaluates only a small, unique subset of all of the papers, thereby generating a Reviewer ⫻ Paper interaction. The solution to this problem is to use intraclass correlations (ICC), a common measure of reliability of either different judges or different items on a scale (Shrout & Fleiss, 1979). ICC is computed by an analysis of variance calculation in which ratings are the dependent variable, with both reviewers and papers as independent variables. ICC has different forms (McGraw & Wong, 1996), depending on whether the same reviewers evaluate the same paper, whether the papers are considered fixed or random, whether the reviewers are considered fixed or random, whether one is interested in consistency among reviews or exact agreement of reviews, and whether one wants to estimate the reliability of a single reviewer or the reliability of the full set of reviews of a given paper taken together. Essentially, ICC increases as the mean square of the papers effect increases, and it goes down as the mean square of the interaction of papers with reviewers increases. ICC can measure agreement or consistency. Agreement concerns the extent of exact consensus among reviewers on writing evaluation, whereas consistency concerns the extent to which reviewers consistently apply a scoring rubric to writing evaluation (Stemler, 2004). Consistency measures were used rather than agreement measures because consistency is the core issue in this setting. In the formal terms of McGraw and Wong (1996), the analyses here use ICC(C, 1) Case 2 (consistency of a single reviewer, the case of random reviewers and random papers), and ICC(C, k) Case 2 (consistency of k reviewers combined, the case of random reviewers and random papers), referred to here as single-rater reliability (SRR) and effective reliability (EFR), respectively. When the variance of judgments across reviewers is equal, the SRR is equal to the Pearson product–moment correlation; when variances of judgments differ by reviewer, it becomes lower than the Pearson product–moment correlation. Using SRR allowed us to evaluate the effect of student level (undergraduate vs. graduate) and course discipline independently of the number of reviewers. The EFR of the set of reviews for a paper places a limit on the validity of peer reviews (given our use of the mean of peer assessments to assess the instructor view of validity). The formula for estimating SRR, which has also been called norm-referenced reliability or Winer’s (1971) adjustment for anchor points, is
MSP ⫺ MSR⫻P , MSP ⫹ (n ⫺ 1)MSR⫻P where P is the total set of papers, R is the total set of reviewers, n is the total number of reviewers (not the number of reviewers per paper), and MSP and MSR ⫻ P are, respectively, the mean square terms for the paper effect and the Reviewer ⫻ Paper interactions in the analysis of variance calculation. The formula for estimating EFR, which is equivalent to Cronbach’s alpha, is MSP ⫺ MSR⫻P . MSP Essentially, the EFR is a simplified form of the SRR equation, looking at how much the interaction term (noise in ratings) reduces the signal of paper quality. The student view of reliability (SR) is a simple variation of the SV. Rather than comparing individual peer ratings with an instructor rating, they are compared with the mean peer rating. This measure is essentially the standard deviation of the peer ratings as a whole population. The higher the dispersion of peer ratings around the mean, the less reliable a student will consider the peer ratings. To show how instructor and student views of reliability and validity can differ from one another, we present an example case in Table 3. In the example, 5 writers received evaluations from five peer evaluators and one instructor. Using the MSP and MSR ⫻ P associated with the peer ratings shown in Table 3 yields an SRR of .60, which is quite reasonable, and an EFR of .88, which is impressive. On the right margin of Table 3 are the correlations of each reviewer’s ratings with the instructor’s ratings and the correlations of the mean peer rating with instructor rating. For these hypothetical data, the overall validity of peer ratings from the instructor’s perspective is quite high (r ⫽ .89); in fact, the validity of the individual raters is reasonable from the instructor viewpoint as well (ranging from r ⫽ .69 to r ⫽ .94). As noted above, the EFR (of .88) provides an upper bound on the average of the individual rater validities (.80). Thus, from the instructor’s perspective, the peer ratings are both reliable and valid. The SV and SR may in this case be quite different. Writers 4 and 5 may view their ratings as unreliable because the standard deviations in the ratings are quite high: That is, they are higher than the standard deviation of paper quality as judged by instructor (namely, 1.3) and higher than the standard deviation of paper quality as judged by students (namely, 1.2). Moreover, Writers 3, 4, and 5 may regard their ratings as invalid because their SVs, the standard distances of their ratings from the instructor rating, are all high. For Writers 4 and 5, the deviation is due to low reliability; for Writer 3, the deviation is due to bias. Therefore, 3 out of 5 students in this example are likely to conclude that peer assessments are unreliable or not
Table 3 An Example Illustrating Differences Between the Student and Instructor Views of Validity and Reliability Rater
Writer 1
Writer 2
Writer 3
Writer 4
Writer 5
SD
Instructor Reviewer 1 Reviewer 2 Reviewer 3 Reviewer 4 Reviewer 5 Mean peer ratings
6 7 6 7 6 6 6.4
6 6 6 7 5 7 6.2
4 6 6 6 5 4 5.4
5 4 5 7 2 6 4.8
3 3 4 5 1 4 3.4
1.3
Student views of reliability Student views of validity
0.6 0.7
0.8 0.8
0.9 1.8
1.9 1.9
1.5 1.6
1.2
Instructor view of validity (r) .72 .73 .94 .69 .91 .89
PEER ASSESSMENT valid when, at the same time, the instructor may view the reviewing task as reliable and valid.
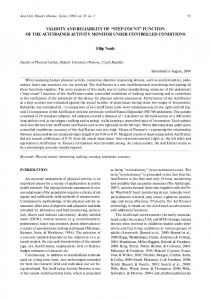
Results Instructor Perspective on Validity Figure 1 shows the validities, from the instructor viewpoint, of the mean ratings, with 95% confidence interval bars, generated by peer assessment in two graduate and three undergraduate courses, along with the effective reliability of peer ratings in each course. Overall, the validities are quite high, quite similar, and there was no evidence that graduate student ratings were more valid than undergraduate student ratings. Because all five of these courses used six reviewers per paper, the effective reliabilities were uniformly high and not a source of variability in the obtained validities. In addition, to provide a benchmark, we asked a writing expert to evaluate all of the papers in two of the courses: U01 and U08. The correlations between their ratings are noted with dotted lines in Figure 1. It appears that student ratings are as valid as instructor ratings, at least from the instructor perspective of validity.
Instructor Perspective on Reliability Figure 2 presents the SRR, with 95% confidence intervals, and the EFR for each of the 16 courses described earlier, showing graduate versus undergraduate status and number of reviews per paper, and journal reviewers’ SRR as a benchmark. The SRR ranged from .17 to .56 (M ⫽ .39, SD ⫽ .16) for graduate courses and from .20 to .47 (M ⫽ .34, SD ⫽ .09) for undergraduate courses. Although the SRR was higher for graduate courses, the difference was far from statistically significant, t(4) ⬍ 1. As a benchmark for the overall reliability of peer evaluations, the SRR of professionals in peer-reviewed journals was .27 (SD ⫽ .12), based on a metareview of various journals by Marsh and Ball (1989). This comparison suggests that in all 16 SWoRD-supported courses, peer evaluation was acceptably reliable from the instructor perspective. The effective reliabilities associated with three to six peer reviewers ranged from .45 to .84 (M ⫽ .70, SD ⫽ .19) in undergraduate courses and from .45 to .88 (M ⫽ .71, SD ⫽ .12) in
1
Validity
0.9
EFR
r / ICC(C,k)
0.8 0.7 0.6 0.5 0.4 0.3 0.2 0.1 0 G01
G02
U01
U02
U08
n=11
n=23
n=30
n=88
n=102
Figure 1. Validity of peer assessment from an instructor point of view (defined as Pearson product–moment correlation of mean peer ratings with instructor ratings), with 95% confidence interval bars. Dotted lines indicate the correlations between the expert ratings. ICC ⫽ intraclass correlation; EFR ⫽ effective reliability; G ⫽ graduate course; U ⫽ undergraduate course.
897
graduate courses. There was noticeable variability across courses, the primary factor being the number of reviewers per paper. The correlation between EFR and the number of reviewers per paper was .78 (95% confidence interval ⫽ 0.46, 0.92). In the 11 courses that used six reviewers per paper, the EFR was .78, whereas for the other five courses that used three or four reviewers, the mean EFR was .55, t(5) ⫽ 4.2, p ⬍ .01. Thus, from an instructor perspective, three or four peers produce middling effective reliabilities, whereas six peer reviewers produce excellent effective reliabilities.
SV (Student Perspective on Validity) The SV was examined on the basis of either instructor ratings (two graduate courses and one large undergraduate course) or ratings obtained from a writing expert paid to rate the papers after the class was over. SV was computed between individual peer ratings for a paper and the instructor ratings for that same paper. Figure 3 shows mean SVs, with standard error bars, as measured by the root-mean-squared distance between instructor ratings and individual peer ratings: Higher mean distances indicate weaker validity. For comparison, the standard deviations of the mean ratings of paper quality are shown in the overlay line graph. As a benchmark of relevance to the students, the standard deviations in the mean ratings of paper quality for each course are indicated on the figure with solid lines. In four out of five courses, SV was greater than the standard deviation in paper quality. Even in the one graduate course with relatively low SV from instructor ratings, the papers in that class did not vary much in quality, and the SV was extremely close to the standard deviations of paper quality. These results suggest that students in all of these courses would find the peer ratings they received to be of low validity.
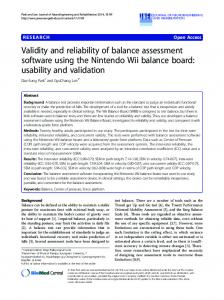
SR (Student Perspective on Reliability) The SR was examined by computing standard deviations with respect to the peer ratings of each draft as a population. Figure 4 presents the SR plotted as the mean standard deviation in peer ratings, with standard error bars in each course. For comparison, the standard deviations of paper quality in each class are shown in the overlay line graph. Overall, the variability typically sits between .6 and .8 (i.e., just under 1 point on the 7-point scale). Graduate students have a slightly lower variability (M ⫽ .60, SD ⫽ .14) than undergraduates (M ⫽ .68, SD ⫽ .09), although this difference is not statistically significant, t(4) ⫽ 1.1, p ⬎ .3. Although this absolute level of variability may not seem high, one needs to compare it against the variability found in papers, as students tend not to use the lower half of the 7-point scale. Figure 4 also plots the standard deviations in mean paper quality in each course. For 75% of the courses, the mean standard deviation in ratings received by each student was larger than the standard deviation of the overall quality of each paper. Thus, if students compare the variability in the ratings they receive with the variability in quality of papers they review, they will generally see the peer ratings as unreliable. Were there some papers that students found it easier to agree on? We examined the relationship between author performance and the convergence of peer ratings. As shown in Figure 5, extremely poor and extremely good writing tended to receive converging evaluations, whereas middling papers received more
CHO, SCHUNN, AND WILSON
898 1.0
Single Reviewer Reliability Effective Reliability
0.9
Journal Reviewer's SRR
Intraclass correlation
0.8 0.7 0.6 0.5 0.4 0.3 0.2 0.1 0.0 G01 G02 G03 G04 U01 U02 U03 U04 U05 U06 U07 U08 U09 U10 U11 U12 6
6
4
4
6
6
6
3
6
6
6
6
6
6
3
4
Figure 2. Single reviewer reliabilities, with 95% confidence intervals, and effective reliabilities. The values of 6, 4, and 3 represent the number of reviewers assigned per author in each class. SRR ⫽ single-rater reliability; G ⫽ graduate course; U ⫽ undergraduate course.
divergent evaluations. Although this effect is likely due to floor and ceiling effects, it has the interesting consequence of leading average students to greater doubts in the reliability of peer reviews.
Discussion Overall, the present study extends past research by providing a clearer picture of reliability and validity of peer reviews in the
Far from instructor rating
1.8 1.6 1.4 1.2 1 0.8 0.6 0.4
Close to 0.2 Instructor rating
0 G01
G02
U01
U02
U08
Course
Figure 3. Mean validities of peer assessment from the student perspective, with standard error bars. The standard deviations of the mean ratings of paper quality are shown in the overlay line graph. G ⫽ graduate; U ⫽ undergraduate.
context of scaffolded reviewing of writing. First, scaffolded peer reviewing of writing appears to have moderate SRR and quite high ERR when at least four peer reviewers are used. This finding appears to hold across undergraduate and graduate courses and across many different disciplines. Thus, this finding extends researchers’ knowledge about the reliability of scaffolded peer review of writing and shows that multiple peers are necessary to ensure high levels of reliability, which may be especially important given the controversial nature of using peer-generated grades. Second, the validity (of aggregate student ratings) appears moderate to high and at least as high as the validity of single instructor ratings. Again, this finding appears to hold across graduate and undergraduate settings and across disciplines, although the set of courses for which validity has been examined is small. Future research should examine to what extent the various scaffolds found within SWoRD produce these high levels of peer review validity. Third, the obtained results provide an explanation for why the student and instructor perspectives on reliability and validity are often quite different. Most of the graduate and undergraduate courses examined yielded very low reliabilities and validities as viewed from the student perspective. From the student perspective, the ratings they received probably appeared to be more noise than signal. This finding helps explain the finding of Rushton et al. (1993) and Topping et al. (2000) that students sometimes lower their estimates of the reliability of peer reviewing after experiencing a peer review process that is objectively reliable and valid from the instructor perspective.
PEER ASSESSMENT
899
Figure 4. Student perspective of reliability plotted as mean standard deviations in peer ratings, with standard error bars. The standard deviations of the mean ratings of paper quality are shown in the overlay line graph. G ⫽ graduate course; U ⫽ undergraduate course.
Assuming that each peer only evaluates a small subset of all peer papers, instructor and student views of validity differ in terms of both relative and absolute scale variability. The instructorgenerated perspective is scale independent, the only important factor being the amount of variance in student ratings that is attributable to differences in paper quality. In contrast, students would have a more absolute, scale-dependent view of validity, as they would not know as much about how other student papers
varied on the scale (i.e., Is a 0.5-point deviation on a ratings scale significant?). In addition, there is also the possibility of differences in the comparison point. The instructor always has the option of assessing some or all of the papers and comparing peer assessments against instructor assessments. In contrast, the student assesses the validity of peer-generated grades by comparison with a selfassessment of paper quality because the student does not have an instructor grade. Thus, the perceived validity of peer-generated grades is likely to further decline because of inaccurate selfassessments (Stefani, 1994) rather than actual performance (Hewitt, 2002). The instructor and the student view reliability from different perspectives as demonstrated in this study. The instructor may examine the effective reliability of ratings generated by a set of peers across all student writing, whereas individual students are restricted to considering the reliability of individual peer ratings given on their own writing. Moreover, variability among individual ratings affects student perception on peer ratings. Higher inconsistency among peer ratings seems associated with lower reliability perception, leading to lower acceptance of peer assessment.
Supporting Interview Anecdotes Figure 5. The mean standard deviations of peer ratings per paper (with standard error bars) as a function of mean paper quality, grouped into ranges of paper quality.
To supplement the quantitative analyses, we carried out structured interviews with 10 students in a large undergraduate course and 5 students in a small graduate course about their experiences
CHO, SCHUNN, AND WILSON
900
with the scaffolded peer review process— both courses were ones in which instructor-view validity and reliability were high. Of note, half of the undergraduates and 4 out of 5 graduate students were uncomfortable with being graded by peers. A typical undergraduate comment comes from Student SC: Yeah I, I think that’s . . . it’s very difficult to see another student grading and everyone comes from a different major, they have a different background, they see things differently, they came from different schools, and, I mean, you know the way their mind works is different so, I mean. . . . And writing is such a subjective thing that how can you expect them to be accurate? I mean, obviously they’re not experts in their field or anything right now; they’re still undergraduate students. Some of them are freshmen, so this is still very new to them. I’m a sophomore, but some of them are freshmen.
In a comment typical of graduate students, Student DB said, I think they might not grade as accurately. And again not on purpose, I don’t think they’re out to doom their peers or anything, but I would think the same thing about myself. You know, I don’t know how adequate my grade would be to someone else because I don’t know that much about the topic.
In other words, both undergraduates and graduate students cited poor face validity of peer reviews as the basis for their suspicion of peer-generated grades. It is important to note, however, that students had a fairly positive view of peer reviewing as it related to writing improvement. With respect to impact on writing, 8 of 10 undergraduates and 4 of 5 graduate students reported positive effects of peer reviews on their own writing, especially the act of being a reviewer. For example, a graduate student, KZ, mentioned, I guess seeing how other people attack and trying to figure out ways that might help them. Like, if you see something that doesn’t work for you as a reader and flow, trying to figure out and help them figure out how they would rearrange it is always a good exercise in terms of your own ability to have good flow and . . . also in this case, because of content knowledge, I may get some good ideas out of other people’s papers that I may have overlooked not having the same depth of knowledge that they do if they’re in this field of study.
Similarly, an undergraduate student, JL, mentioned, “Oh yeah definitely, I got a better understanding of how other people are going to view my paper by reviewing other people’s papers. So I knew what to watch out for before I have to do it.”
Implications for Classroom Settings There are many implications of the current work for the use of peer-generated grades of writing in university settings. First and foremost, the current work provides stronger evidence that peergenerated grades can be sufficiently reliable and valid to be used widely in university settings. In other words, concerns about reliability and validity (at least the instructor’s perspective on them) are probably not a good reason for preventing instructors from implementing this approach, at least when appropriate scaffolds for peer review are included. Second, the current work suggests that multiple reviewers should be used to ensure high reliability. The reliability of individual students is only modest and lower than that of instructors.
However, a collection of four to six peers produces very high levels of reliability. To both this point and the one above, however, it is important to add the caveat that the scaffolding provided to reviewers in the SWoRD context is likely to be important, and not all approaches to peer review will be as reliable and valid. In particular, the use of detailed grading rubrics and an incentive structure for reviewers are likely to be important. It should also be noted that the multiple-peer reviewer approach is consistent with the current view of writing instruction (Cho et al., 2006).
Caveats It is important to acknowledge that although this study involved a large number of students from various courses, the sampled set may not reflect all disciplines. Future studies should sample disciplines more systematically. In addition, this study did not address various writing-related factors such as subject knowledge, writing skills, evaluation skills, writing length, and writing genre that may affect the reliability and validity of peer evaluations. The current study also does not examine the impact of peerevaluation activities on student learning, either from the perspective of the students receiving the comments or the students providing the comments. Some instructors assign peer-evaluation tasks to increase the amount of feedback that authors receive, to encourage metacognitive reflection on writing on behalf of the reviewers, or to learn feedback skills. Future studies should examine each of these learning issues. It should be also noted that younger students (e.g., elementary and secondary students) may produce ratings that are less valid and less reliable or that writing assignments that are much shorter or much longer may also produce different results. In addition, some instructors in this study were paid a flat summer salary for their grading. Regular instructors not paid for grading, especially in large courses, may have produced lower validity estimates because of lowered reliability issues. Finally, we want to note that reliability resides on the other side of the diversity coin. Because reliability is a measure of consistency of peer evaluations, higher consistency means lower diversity and vice versa. Therefore, the task of improving peer reviewing systems should not have high reliability of grades as the only goal, to the detriment of other important factors (e.g., learning about different reactions to a given piece of prose). Finally, future research needs to investigate how to improve student perceptions of the reliability and validity of peer-generated grades. Because it is the noise in the individual ratings that gives the impression of low reliability, we are exploring the effect of showing only average paper ratings instead of individual ratings to authors. This approach is similar to the way reviews are presented by the National Institutes of Health (aggregate scores) and unlike the approach taken by the National Science Foundation (individual ratings). In this aggregate rating scheme, one could still present comments generated by each individual reviewer. The open question is whether variability in comments produced by different reviewers will also call into question the reliability of the ratings.
References Boud, D. (1989). The role of self-assessment in student grading, assessment and evaluation. Studies in Higher Education, 14, 20 –30.
PEER ASSESSMENT Cheng, W., & Warren, M. (1999). Peer and teacher assessment of the oral and written tasks of a group project. Assessment & Evaluation in Higher Education, 24, 301–314. Cho, K., Chung, T., King, W., & Schunn, C. D. (in press). Peer-based computer-supported knowledge refinement: An empirical investigation. Communications of the ACM. Cho, K., & Schunn, C. D. (in press). Scaffolded writing and rewriting in the discipline. Computers & Education. Cho, K., Schunn, C. D., & Charney, D. (2006). Commenting on writing: Typology and perceived helpfulness of comments from novice peer reviewers and subject matter experts. Written Communication, 23, 260 – 294. Dancer, W. T., & Dancer, J. (1992). Peer rating in higher education. Journal of Education for Business, 67, 306 –309. Falchikov, N. (1986). Product comparisons and process benefits of collaborative self and peer group assessments. Assessment & Evaluation in Higher Education, 11, 146 –166. Falchikov, N., & Goldfinch, J. (2000). Student peer assessment in higher education: A meta-analysis comparing peer and teacher marks. Review of Educational Research, 70, 287–322. Flower, L. S., Hayes, J. R., Carey, L., Schriver, K., & Stratman, J. (1986). Detection, diagnosis, and the strategies of revision. College Composition and Communication, 37, 16 –55. Haaga, D. A. F. (1993). Peer review of term papers in graduate psychology courses. Teaching of Psychology, 20(1), 28 –32. Hewitt, J. P. (2002). The social construction of self-esteem. In C. R. Snyder & S. J. Lopez (Eds.), Handbook of positive psychology (pp. 135–147). Oxford, England: University Press. Hinds, P. J. (1999). The curse of expertise: The effects of expertise and debiasing methods on predictions of novice performance. Journal of Experimental Psychology: Applied, 5, 205–221. Hunter, J. E. (1983). A causal analysis of cognitive ability, job knowledge, job performance, and supervisor ratings. In F. Landy, S. Zedeck, & J. Clevelands (Eds.), Performance measurement and theory (pp. 257–266). Hillsdale, NJ: Erlbaum. Kelley, C. M., & Jacoby, L. L. (1996). Adult egocentrism: Subjective experience versus analytic bases for judgment. Journal of Memory and Language, 35, 157–175. Lynch, D. H., & Golen, S. (1992, September/October). Peer evaluation of writing in business communication classes. Journal of Education for Business, 44 – 48. Magin, D. (2001). Reciprocity as a source of bias in multiple peer assessment of group work. Studies in Higher Education, 26(1), 53– 63. Marcoulides, G. A., & Simkin, M. G. (1995). The consistency of peer review in student writing projects. Journal of Education for Business, 70, 220 –223.
901
Marsh, H. W., & Ball, S. (1989). The peer review process used to evaluate manuscripts submitted to academic journals: Interjudgmental reliability. Journal of Experimental Education, 57, 151–169. Mathews, B. (1994). Assessing individual contributions: Experience of peer evaluation in major group projects. British Journal of Educational Technology, 25, 19 –28. McGraw, K. O., & Wong, S. P. (1996). Forming inferences about some intraclass correlation coefficients. Psychological Methods, 1, 30 – 46. Mowl, G., & Pain, R. (1995). Using self and peer assessment to improve students’ essay writing—A case study from geography. Innovations in Education and Training International, 32, 324 –335. National Commission on Writing in American Schools and Colleges. (2003). The neglected “R”: The need for a writing revolution. Retrieved August 28, 2006, from http://www.writingcommission.org/prod_downloads/writingcom/neglectedr.pdf Rada, R., Michailidis, A., & Wang, W. (1994). Collaborative hypermedia in a classroom setting. Journal of Educational Multimedia and Hypermedia, 3, 21–36. Rosenthal, R., & Rosnow, R. L. (1991). Essentials of behavioral research: Methods and data analysis (2nd ed.). New York: McGraw Hill. Rushton, C., Ramsey, P., & Rada, R. (1993). Peer assessment in a collaborative hypermedia environment: A case study. Journal of ComputerBased Instruction, 20, 75– 80. Shrout, P. E., & Fleiss, J. L. (1979). Intraclass correlations: Uses in assessing rater reliability. Psychological Bulletin, 86, 420 – 428. Stefani, L. A. J. (1994). Peer, self and tutor assessment: Relative reliabilities. Studies in Higher Education, 19(1), 69 –75. Stemler, S. E. (2004). A comparison of consensus, consistency, and measurement approaches to estimating interrater reliability. Practical Assessment, Research & Evaluation, 9(4). Retrieved August 28, 2006, from http://PAREonline.net/getvn.asp?v⫽9&n⫽4 Swanson, D., Case, S., & van der Vlueten, C. (1991). Strategies for student assessment. In D. Boud & G. Feletti (Eds.), The challenge of problembased learning (pp. 260 –273). London: Kogan Page. Topping, K. (1998). Peer assessment between students in college and universities. Review of Educational Research, 68, 249 –276. Topping, K. J., Smith, E. F., Swanson, I., & Elliot, A. (2000). Formative peer assessment of academic writing between postgraduate students. Assessment & Evaluation in Higher Education, 25, 149 –169. Winer, B. J. (1971). Statistical principles in experimental design (2nd ed). New York: McGraw-Hill.
Received November 16, 2005 Revision received July 6, 2006 Accepted July 12, 2006 䡲