Center in St. Louis, George Warren Brown School of Social. Work, Dept of ... of accelerometer data and total telephone-administered IPAQ score (P < .001). The Spearman ... call, interviewers visited the household and adminis- tered the same ...
Journal of Physical Activity and Health, 2010, 7, 402-409 © 2010 Human Kinetics, Inc.
Validity and Reliability of the Telephone-Administered International Physical Activity Questionnaire in Brazil Pedro C. Hallal, Eduardo Simoes, Felipe F. Reichert, Mario R. Azevedo, Luiz R. Ramos, Michael Pratt, and Ross C. Brownson Purpose: To evaluate the validity and reliability of the telephone-administered long IPAQ version. Methods: The questionnaire was administered by telephone to adults on days 1 and 6. On day 1, the same questionnaire was administered by face-to-face interview, and accelerometers were delivered to subjects. Reliability was measured by comparing data collected using the telephone questionnaire on days 1 and 6. Validity was measured by comparing the telephone questionnaire data with (a) face-to-face questionnaire and (b) accelerometry. Results: Data from all instruments were available for 156 individuals. The Spearman correlation coefficient for telephone interview reliability was 0.92 for the leisure-time section of IPAQ, and 0.87 for the transport-related section of IPAQ. The telephone interview reliability kappa was 0.78. The Spearman correlation between the telephone-administered and the face-to-face questionnaire was 0.94 for the leisure-time and 0.82 for the transport-related section. The kappa was 0.69. There was a positive association between quartiles of accelerometer data and total telephone-administered IPAQ score (P < .001). The Spearman correlation was 0.22. Conclusions: The telephone-administered IPAQ presented almost perfect reliability and very high agreement with the face-to-face version. The agreement with accelerometer data were fair for the continuous score, but moderate for the categorical physical activity variables. Keywords: accelerometry, measurement, physical activity, exercise, physical activity assessment Measuring physical activity in large-scale studies has always been a challenge.1 Even though objective measures of physical activity (eg, accelerometers) are often assumed state-of-the-art, they are expensive and not always feasible in large-scale evaluations. Numerous instruments were previously used in large-scale surveys on physical activity, hampering comparability across studies.2 To minimize these problems, the International Physical Activity Questionnaire (IPAQ) was developed in 1998.3 A short and a long version of the instrument were created; each version could be administered by telephone or self-administered. The original validity study of the questionnaire concluded that the telephone and self-administered versions tended to provide similar results.3
Hallal and Azevedo are with the post-graduate program in Epidemiology, Federal University of Pelotas, Brazil. Simoes and Pratt are with the Centers for Disease Control and Prevention, Atlanta, GA. Reichert is with the Universidade Estadual de Londrina, Brazil. Ramos is with the Universidade Federal de São Paulo, Brazil. Brownson is with the Prevention Research Center in St. Louis, George Warren Brown School of Social Work, Dept of Surgery, and Siteman Cancer Center, Washington University School of Medicine, Washington University in St. Louis, MO.
402
In developing countries, self-administration of questionnaires in epidemiologic and intervention studies is complex, given the relatively high rates of illiteracy (in Brazil, for example, it is around 10% according to 2008 data of the Brazilian Institute of Geography and Statistics). In addition, telephone interviews were rare until recently because the coverage of telephone lines was still low. To help solve this problem, researchers have administered the IPAQ by means of face-to-face interviews.4,5 However, because of its logistic advantages and lower costs, utilization of the telephone IPAQ is important for enabling researchers in developing countries to efficiently assess physical activity in populations. Validation of telephone survey measures of physical activity in these settings is rare. In Brazil, a recent publication showed very high agreement between face-to-face and telephone questionnaires for categorization of individuals into physical activity groups (kappa = 0.80), but lower agreement for sedentary behaviors such as hours per day watching television (kappa = 0.53).6 The aim of the current study was to test the validity and reliability of the leisure-time and transport-related sections of the telephone-administered long version of the IPAQ, by comparing it with the face-to-face version of the same questionnaire and with accelerometer data. We opted not to validate the occupational and housework sections of the IPAQ because our primary aim was to evaluate volitional physical activity.
Validity Study of IPAQ in Brazil 403
Methods The study was carried out in Pelotas, a medium-sized (~340,000 inhabitants) city in the extreme south of Brazil, near the border with Uruguay and Argentina. Subjects were selected through a multistage random procedure. The primary sampling units were the 404 census tracts (delimited areas, each covering approximately 300 households) of the city. The secondary sampling units were households, which were randomly selected in each sampled tract. Individuals aged 20 years or older, living in the sampled households, were eligible for the study. Data collection started in July and was ended in November 2007. Individuals were visited by the research team on day 0 to obtain the telephone number and a list including sex and age of all residents in that household. On day 1, the leisure-time and transport-related sections of the IPAQ were administered by telephone (telephone interview 1). Data on the validity of the Portuguese version of the IPAQ are available elsewhere.3 At least 2 hours after the call, interviewers visited the household and administered the same questionnaire in a face-to-face interview, but respondents were not aware that another interview would take place. Interviewers were trained to state a standardized sentence to subjects before administering the face-to-face questionnaire: “Earlier today, I asked you some questions about physical activity. I will now ask some more questions on the same topic.” After the interview, an Actigraph model GT1M accelerometer was given to each subject, and he/she was told to use it during the following 4 days, with the exception of the time he/she would be in contact with water (bath, swimming, and other activities). The device was worn on the waist and the epoch was set up at 5 seconds. Five days later, the telephone questionnaire was administered again (telephone interview 2). Both in the telephone and in the face-to-face administered questionnaires, physical activity scores were created as the sum of minutes spent on moderate-intensity activities (including walking) per week, and twice the number of minutes spent on vigorous-intensity activities.5 For categorical analyses, including calculation of kappa statistics and percent of agreement, a cutoff point of 150 minutes was used to classify subjects as sufficiently active or not, in accordance with current physical activity guidelines.7 In addition, we created physical activity categories in accordance with the IPAQ website guidelines.8 Accelerometer data were initially analyzed as a continuous variable (counts). Next, data were categorized into quartiles for specific analyses. Finally, separate scores of minutes spent on moderate-intensity and on vigorous-intensity activities were computed, using the cutoffs proposed by Freedson and colleagues.9 Independent variables analyzed were sex, age, and socioeconomic level. We used the standardized socioeconomic classification of the Brazilian Association of Research Institutes, which divides families into 5 groups, from A (wealthiest) to E (poorest). The classification is based
on the possession of household assets and the education of the family head. The reliability analyses were performed using 3 strategies. First, due to the asymmetrical data, the Spearman correlation coefficient between the continuous scores obtained in telephone interviews 1 and 2 was calculated. Second, the Bland and Altman method10 was used to assess agreement between the scores of physical activity from telephone interviews 1 and 2 and from the face-to-face interview. Third, we calculated the percentage of agreement and the kappa value when comparing the proportion of subjects classified as sufficiently active in telephone interviews 1 and 2. The kappa statistic measures agreement after correcting for chance.11 The Landis and Koch categories were used to express kappa values with adjective ratings.12 In the comparison of telephone and face-to-face questionnaires, we employed the same statistics used in the reliability analyses. For comparing data between the telephone interview 1 and the accelerometer, we first compared the physical activity score generated by the telephone questionnaire (leisure-time and transportrelated sections) across quartiles of accelerometer counts. Secondly, we calculated the Spearman correlation coefficient between total physical activity score (leisure-time + transport-related sections) based on the telephone questionnaire and accelerometer counts. Finally, we categorized both variables and calculated the percent of agreement and the kappa value.
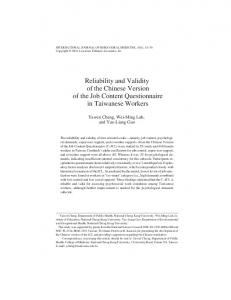
Results The sample comprised 192 individuals, of whom 156 had data from all instruments (telephone interviews 1 and 2, face-to-face interview, and accelerometry). Table 1 describes the sample with complete data (N = 156) in terms of age and socioeconomic level stratified by sex. There were slightly more women (51.9%) than men (48.1%) in the sample. Mean age was 40.3 years (SD 15.1), and 78.5% of the subjects were from socioeconomic levels B or C. Table 2 shows the analyses comparing the first and second telephone interviews using the leisure-time and transport-related sections of the long IPAQ. Regardless of the domain investigated, results were very similar between the 2 interviews. The percent agreement for the total score was 89.8% and the kappa value was 0.78. Spearman correlation coefficients for analyses presented in Table 2 ranged from 0.80 (min/wk of leisure-time moderate-intensity physical activities) to 0.94 (min/wk of cycling). The prevalence of insufficiently active subjects in the first and second telephone interviews was 38.1% and 38.2%, respectively. Table 3 presents categories of physical activity according to the IPAQ classification in the first and second telephone interviews. Agreement was very high and was not affected by interviewee gender, age group or socioeconomic class (data not shown). The Bland & Altman plot (Figure 1) showed no evidence of bias between the interviews; the mean difference was 3 minutes.
Table 1 Description of Sample in Terms of Age and Socioeconomic Level, Stratified by Sex; Brazil, 2007 Men Variable Age (years) 20–29 30–39 40–49 ≥50 Socioeconomic levela A (wealthiest) B C D+E
Women
N
%
N
%
27 20 13 15
36.0 26.7 17.3 20.0
19 19 22 21
23.5 23.5 27.1 25.9
16 35 14 6
22.5 49.3 19.7 8.5
4 29 38 5
5.3 38.1 50.0 6.6
Based on the Brazilian Association of Research Institutes. This classification takes into account number of household assets, schooling of the household head and presence of domestic servants.
a
Table 2 Comparison Between Telephone Interviews 1 and 2, Using the Leisure Time and Transport-Related Sections of the Long Version of International Physical Activity Questionnaire (IPAQ); Brazil, 2007 Telephone interview 1 Mean (SD) min/wk
Telephone interview 2 Mean (SD) min/wk
SCC
Min/wk of walking Min/wk of moderate-intensity PA Min/wk of vigorous-intensity PA Total score Transport-related section
71.5 (169.3) 30.8 (91.9) 52.3 (119.7) 206.9 (313.2)
74.6 (169.5) 28.2 (82.6) 46.6 (109.1) 193.3 (298.0)
0.86 0.80 0.91 0.92
Min/wk of walking Min/wk of cycling Total score Leisure time + transport-related sections
133.3 (209.2) 31.9 (107.4) 165.3 (245.6)
146.3 (246.2) 38.4 (121.1) 185.0 (285.8)
0.85 0.94 0.87
Total score
373.4 (432.9)
376.9 (460.6)
0.90
Variable Leisure time section
Abbreviations: SCC, Spearman correlation coefficient; PA, physical activity.
Table 3 Comparison Between Telephone Interviews 1 and 2, According to IPAQ-Based Leisure Time Physical Activity Categories; Brazil, 2007 Physical activity level Low Moderate High
404
Telephone interview 1 N (%) 135 (71.1) 32 (16.8) 23 (12.1)
Telephone interview 2 N (%) 135 (71.1) 35 (18.4) 20 (10.5)
Agreement 90.0%
Kappa 0.78
Validity Study of IPAQ in Brazil 405
Figure 1 — Bland & Altman plot comparing the combined score (leisure time + transport-related physical activity) in telephone interviews 1 and 2 using the International Physical Activity Questionnaire (IPAQ); Brazil, 2007.
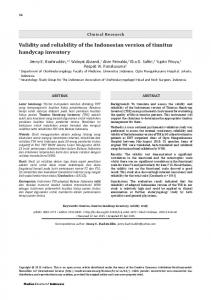
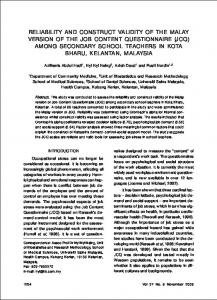
Table 4 demonstrates the analyses comparing the telephone and face-to-face interviews. Agreement between these interviews, although noticeably high, was slightly lower than that observed between the 2 telephone interviews, particularly for high scores. The mean difference was 30 minutes (Figure 2). Each of the physical activity scores derived from the face-to-face interview was slightly higher than that of the telephone interview. Thus, the mean total score of the telephone interview was 373 min/wk, whereas it was 403 min/wk in the face-to-face interview. The percent agreement was 85.5% and kappa was 0.69. As in Table 2, the leisure-time moderate-intensity physical activities showed the lowest Spearman correlation (r = 0.72). The highest correlation was observed for leisure-time vigorous activities (r = 0.94). The prevalence of sedentary lifestyle in the telephone and face-to-face interviews was 38.1% and 36.0%, respectively. Table 5 shows results for physical activity categories based on the IPAQ classification. Agreement was again high and was not affected by interviewee gender, age groups or socioeconomic class (data not shown). Figure 3 shows the lack of agreement between the questionnaire data (phone interview 1) and accelerometers counts. The degree of error tends to increase with increasing physical activity scores. Spearman correlation coefficients between accelerometer data and IPAQ scores were statistically significant, but moderate (Table 6). For
example, the correlation coefficient between the total IPAQ score and accelerometer counts was 0.22. However, we observed a positive association between quartiles of accelerometer data and IPAQ total scores. Physical activity scores generated using IPAQ were 263, 332, 352, and 524 minutes per week for subjects in the first, second, third, and fourth quartiles of accelerometer data, respectively (P < .001).
Discussion Measuring physical activity is challenging, particularly in large-scale studies, which cannot rely on more sophisticated measurement techniques because of logistic and cost constraints. This report presents results of a validation study in Brazil, aimed at testing the reliability and validity of the leisure-time and transport-related sections of the long IPAQ administered by telephone. In Brazil, the Ministry of Health has recently launched the VIGITEL,13 a system for surveillance of chronic disease risk factors based on telephone interviews. Physical activity is included in VIGITEL; thus, the results of our study may also have practical implications on national tracking and policy initiatives. Despite the instrument used by the VIGITEL to estimate physical activity being different from IPAQ, the kappa statistic for reliability between 2 telephone interviews was similar to ours (kappa = 0.80).6 Our study is also important for the evaluation of public
406 Hallal et al
Table 4 Comparison Between Face-To-Face and Telephone Interviews Using the Leisure-Time and Transport-Related Sections of the Long Version of International Physical Activity Questionnaire (IPAQ); Brazil, 2007 Telephone interview
Face-to-face interview
Mean (SD) min/wk
Mean (SD) min/wk
SCC
Min/wk of walking Min/wk of moderate-intensity PA Min/wk of vigorous-intensity PA Total score Transport-related section
71.5 (169.3) 30.8 (91.9) 52.3 (119.7) 206.9 (313.2)
57.6 (123.3) 43.3 (129.0) 56.4 (129.6) 213.7 (357.8)
0.82 0.72 0.93 0.94
Min/wk of walking Min/wk of cycling Total score Leisure time + transport-related sections
133.3 (209.2) 31.9 (107.4) 165.3 (245.6)
152.0 (295.0) 36.2 (125.4) 188.3 (326.2)
0.78 0.93 0.82
Total score
373.4 (432.9)
403.1 (527.9)
0.87
Variable Leisure time section
Abbreviations: SCC, Spearman correlation coefficient.
Figure 2 — Bland & Altman plot comparing the combined score (leisure-time + transport-related physical activity) in the first telephone and face-to-face interviews using the International Physical Activity Questionnaire (IPAQ); Brazil, 2007.
health strategies to promote physical activity in Brazil whenever IPAQ is used.14 One should keep in mind, however, that our sample was drawn from a city located in the richest part of the country, in which subjects have relatively high schooling levels. Validation exercises in poorer areas of the country are therefore encouraged.
Overall, reliability of the telephone questionnaire was very high, as well as was validity in comparison with the face-to-face questionnaire. It is important to note that a high agreement between the telephone and face-to-face interviews does not ensure a high criterion validity of the questionnaire. However, low agreement
Table 5 Comparison Between Telephone and the Face-To-Face Interviews According to IPAQBased Leisure Time Physical Activity Categories; Brazil, 2007 Physical activity Low Moderate High
Telephone interview 1 N (%) 135 (71.1) 32 (16.8) 23 (12.1)
Face-to-face interview N (%) 144 (75.7) 25 (13.2) 21 (11.1)
Agreement 87.4%
Kappa 0.70
Figure 3 — Bland & Altman plot comparing the combined score (leisure-time + transport-related physical activity) in the first telephone interview with the weekly number of minutes spent on moderate-to vigorous physical activity (MVPA) according to accelerometry; Brazil, 2007.
Table 6 Comparison Between Telephone Interview Using the Leisure-Time and Transport-Related Sections of the Long Version of International Physical Activity Questionnaire (IPAQ) and Accelerometer Counts; Brazil, 2007 Comparison Accelerometer-based moderate-intensity counts vs. telephone IPAQ-based moderate-intensity minutes per week Accelerometer-based vigorous-intensity counts vs. telephone IPAQ-based vigorous-intensity minutes per week Accelerometer-based total score (moderate + vigorous-intensity counts) vs IPAQ-based total score
SCC 0.23 0.30 0.22
Abbreviations: SCC, Spearman correlation coefficient.
407
408 Hallal et al
between the 2 versions would indicate that at least one of them is not valid. In fact, the agreement between the telephone interview 1 and accelerometer counts was low, and correlation coefficients, although statistically significant, were low to moderate (all ≤ 0.30). The correlation coefficients between accelerometer counts and the long form of the IPAQ (last 7days; self-administered) reported by Craig et al3 were slightly higher than ours. However, one should bear in mind that domestic and occupational activities were not investigated in the current study, whereas the accelerometer measured all physical activities, regardless of the domain. This may account for part of the difference between our study and others, and it is possible that our correlation coefficients are conservative if the interviewees’ score rank in the domains investigated (ie, leisure time and transport) differs from the domains not addressed here. Statistical approaches applied in validity and reliability studies have been a concern because they usually are based solely on correlation coefficients.10 Recent studies have used appropriate statistical methods, and thus allow the readers to draw conclusions with greater confidence. The Bland & Altman plot presented by Johnson-Kozlow et al15 showed poor agreement between IPAQ (long version; telephone interview) scores and accelerometer counts in a sample of American women. The IPAQ scores overestimated total physical activity by as much as 247%. In contrast, Maddison et al16 found good agreement at lower levels of physical activity between the IPAQ and energy expenditure determined by doubly labeled water among New Zealand adults. However, there was a marked underestimation of questionnaire-derived energy expenditure at high levels of physical activity. Deng et al 17 found a Spearman correlation of 0.33 between the short version of the IPAQ and pedometer-measured activity among Chinese persons older than 50 years of age. Another methodological issue in validation studies of the IPAQ and other physical activity questionnaires is whether analyses should be based on continuous or categorical variables. This is important because the IPAQ might generate biased means or medians for continuous scores of metabolic equivalents (METs) or minutes per week of physical activity, but might be valid and reliable to appropriately categorize individuals into groups (low, moderate, or highly active, for example). For public health surveillance and most epidemiologic and intervention studies, having a correct classification of individuals into groups of activity level is sufficient to test associations. In our study, we presented analyses based on both continuous and categorical variables. The categorization of subjects into 4 quartiles of accelerometer counts was consistent with physical activity levels based on the telephone questionnaire. Subjects at the top quartiles of accelerometry were more likely to have higher physical activity scores, although agreement was moderate. This finding is consistent with the study of
Johnson-Kozlow,15 which found a kappa value between the IPAQ and accelerometer of only 0.21. The transport-related and leisure-time sections of the long version of the IPAQ/telephone-based interview provide a useful tool to correctly classify Brazilian individuals into different groups of physical activity level (high, moderate or low, for example). The application of the IPAQ is indicated for surveillance purposes and for epidemiologic studies that use contrast of these levels. However, it is not a good instrument to accurately measure absolute population levels of physical activity (mean or median MET/min/wk of physical activity), and use of its continuous score in epidemiologic studies is questionable. Acknowledgments This study was funded through the Centers for Disease Control and Prevention contract U48/DP000060-01 (Prevention Research Centers Program). The findings and conclusions in this report are those of the authors and do not necessarily represent the official position of the Centers for Disease Control and Prevention.
References 1. LaPorte RE, Montoye HJ, Caspersen CJ. Assessment of physical activity in epidemiologic research: problems and prospects. Public Health Rep. 1985;100:131–146. 2. Hallal PC, Dumith Sde C, Bastos JP, Reichert FF, Siqueira FV, Azevedo MR. [Evolution of the epidemiological research on physical activity in Brazil: a systematic review] Rev Saude Publica. 2007;41:453–460. 3. Craig CL, Marshall AL, Sjostrom M, et al. International physical activity questionnaire: 12-country reliability and validity. Med Sci Sports Exerc. 2003;35:1381–1395. 4. Hallal PC, Azevedo MR, Reichert FF, Siqueira FV, Araujo CL, Victora CG. Who, when, and how much? Epidemiology of walking in a middle-income country. Am J Prev Med. 2005;28:156–161. 5. Hallal PC, Victora CG, Wells JC, Lima RC. Physical inactivity: prevalence and associated variables in Brazilian adults. Med Sci Sports Exerc. 2003;35:1894–1900. 6. Monteiro CA, Florindo AA, Claro RM, Moura EC. Reliability and validity of indicators of physical activity and sedentariness obtained through telephone survey. Rev Saude Publica. 2008;42:575–581. 7. Haskell WL, Lee IM, Pate RR, et al. Physical activity and public health: updated recommendation for adults from the American College of Sports Medicine and the American Heart Association. Med Sci Sports Exerc. 2007;39:1423–1434. 8. Guthold R, Ono T, Strong KL, Chatterji S, Morabia A. Worldwide variability in physical inactivity a 51-country survey. Am J Prev Med. 2008;34:486–494. 9. Freedson PS, Melanson E, Sirard J. Calibration of the Computer Science and Applications, Inc. accelerometer. Med Sci Sports Exerc. 1998;30:777–781.
Validity Study of IPAQ in Brazil 409
10. Bland JM, Altman DG. Statistical methods for assessing agreement between two methods of clinical measurement. Lancet. 1986;1:307–310. 11. Cohen JA. A coefficient of agreement for nominal scales. Educ Psychol Meas. 1960;20:37–46. 12. Landis JR, Koch GG. The measurement of observer agreement for categorical data. Biometrics. 1977;33:159–174. 13. Monteiro CA, de Moura EC, Jaime PC, et al. [Surveillance of risk factors for chronic diseases through telephone interviews] Rev Saude Publica. 2005;39:47–57. 14. Simoes E, Hallal P, Pratt M, et al. Effects of a communitybased, professionally supervised intervention on physical activity levels among residents of Recife, Brazil. Am J Public Health. 2009;99:68–75.
15. Johnson-Kozlow M, Sallis JF, Gilpin EA, Rock CL, Pierce JP. Comparative validation of the IPAQ and the 7-Day PAR among women diagnosed with breast cancer. Int J Behav Nutr Phys Act. 2006;3:7. 16. Maddison R, Ni Mhurchu C, Jiang Y, et al. International Physical Activity Questionnaire (IPAQ) and New Zealand Physical Activity Questionnaire (NZPAQ): a doubly labeled water validation. Int J Behav Nutr Phys Act. 2007;4:62. 17. Deng HB, Macfarlane DJ, Thomas GN, et al. Reliability and validity of the IPAQ-Chinese: the Guangzhou Biobank Cohort study. Med Sci Sports Exerc. 2008;40:303–307.