Aug 31, 2015 - traits viz., plant height, branches plant-1, capsules plant-1 and seed yield .... produces greater genetic gain than the direct selection of the ... The selection in segregating generations (F2-F5) was for adaptive traits of ideal lines as ..... The following traits used to compute of twelve conventional ..... 80 | Page.
Journal of Agri-Food and Applied Sciences Available online at jaas.blue-ap.org ©2015 JAAS Journal. Vol. 3(4), pp. 68-84, 31 August, 2015 E-ISSN: 2311-6730
Validity of conventional and restricted selection indices in selecting promising lines of sesame R. Shabana1, A. A. Abd El-Mohsen1*, A. K. Abd El-Haleem2 and A. A. Saber2 1. Department of Agronomy, Faculty of Agriculture, Cairo University, Giza, Egypt 2. Field crops Department, Biology and Agricultural Science Division-National Research Centre, Giza, Egypt Corresponding Author: A. A. Abd El-Mohsen Received: 15 July, 2015
Accepted: 31 July, 2015
Published: 31 August, 2015
ABSTRACT To determine potential traits and selection criteria for yield improvement, twenty seven sesame lines and two checks were grown in two successive seasons of 2011 and 2012 to assess the presence of variability for desired traits and amount of variation for different parameters. The two experiments were grown in the Agricultural Production and Research Station of National Research Center, El Nubaria Province, El-Behera Governorate, Egypt, respectively. The data collected on 10 characters were subjected to three different analyses. Variability among the lines were determined with respect to the studied parameters. The results showed significant genetic variances and covariances among lines for all studied traits for all characters except, days to maturity in F6 and fruiting zone length in F7, indicating the existence of variability and the potential for selection and improvement within characters. A considerable amount of variability among lines for the traits studied also indicated the usefulness of selection for these traits in the genetic material used for future improvement in sesame. In variability analysis, high heritability was accompanied by a high genetic advance and a high genotypic coefficient of variation (GCV) for number of branches plant -1, stem height to 1st capsule, number of capsules plant-1 and seed yield plot-1. In correlation analysis, the genotypic correlation coefficient was generally higher than the corresponding phenotypic correlation coefficient which indicated that the apparent association might be due to genetic reason. In selection indices analysis, twelve conventional selection indices (Ii) and two restricted selection indices with different number of traits were evaluated. Selection index was constructed to help selecting for several important traits simultaneously. Judicious use of conventional and restricted selection indices is of a great importance to the breeder. Selection of F6 line (s) that combine high seed yield with one or more desired agronomic or seed yield component trait in a new cultivar was practiced via 12 conventional and two restricted selection indices. These lines were evaluated in the next generation in an evaluation experiment. Heritability values ranged from 23.2 % for days to maturity to 92.2% for stem height to 1st capsule in F6 and from 45.3% for fruiting zone length to 93.9% for oil % in F7. There are no discrepancies between expected (GE) and actual (GA) genetic advances reported for four traits viz., fruiting zone length, branches plant -1, capsules plant-1 and seed yield plot-1 when direct selection for individual traits was applied. Seed yield plot -1 was significantly and positively correlated with plant height, stem height to 1st capsule, branches plant -1, capsules plant-1 and yield plant-1. Contradictory, seed yield plot-1 was significantly and negatively correlated with both seed index and oil%. Besides, the highest relative efficiency (591) was calculated in the conventional selection experiment that contained four traits viz., plant height, branches plant-1, capsules plant-1 and seed yield plot-1. Two restricted indices were applied for the characters that showed negative association with seed yield plot-1. Holding seed index and/or oil content of selected sesame plants to the means of unselected plants in a restricted selection index increased the seed yield plot-1 by 3.0 and 1.3% of lines mean while conventional selection index decreased seed yield plot-1 by 5.0 and 3.0% of lines mean, respectively in the selection experiment. A rank correlation between F 6 either for direct selection for seed yield or among all selection indices used (conventional and restricted) and rank of seed yield plot-1 in F7 was positive and significant or highly significant. The line C3.8 recorded the highest seed yield plot-1 and higher resistance for foliar disease amongst the 27 elite lines in F6 and F7. It was higher than the mean of the
J. Agri-Food & Appl. Sci., 3 (4): 68-84, 2015
population of lines by 28.4 and 44% and than the two checks cultivar by 48 and 100 % in 2011 and 2012, respectively Keywords: Sesame, Phenotypic variances and covariances, Genotypic variances and covariances, Heritability, Correlations, Direct selection, Expected and actual genetic gains, Conventional selection index, Restricted selection index, Rank correlation. ©2015 JAAS Journal All rights reserved.
INTRODUCTION Sesame (Sesamum indicum L), is probably the most ancient oil seed crop. It is known under different names in different countries viz: simsim, benniseed, til, gingelly and a jonjoli (Khidir, 1997). Because of its high oil quality and a wide use in raw foods, confectioneries and bakery industries, the demand of sesame seed is increasing in the global market (Ashri, 1989). It is a self pollinated crop, under the family of pedaliacea. The importance of sesame lies in its high quality oil which is often referred to as the “queen” of vegetable oil. The outstanding characteristic of sesame oil is its stability and keeping quality as well as resistance to rancidity. Plant breeders use biometrical techniques to assess genetic variability among and within genotypes, to develop selection criteria, heterotic parents for hybridization, effective breeding procedures and varietal stability (Singh, 1990). Variability plays an important key role in plant breeding program and observed the limit of selection for different plant properties. Hence, it becomes necessary to partition the observed variability into heritable and non-heritable components measured as genotypic and phenotypic coefficients of variation (GCV and PCV) and heritability. The mathematical genetic theory, in the form of selection index, developed by Smith (1936) is the basis for simultaneous selection of several traits. A selection index most often aims at giving appropriate weight to the components maximizing gains from selection (Falconer, 1983). The selection index technique can theoretically determine the genotypic worth of individuals or families in an objective manner (Subandi and Empig, 1973). First, Smith (1936) developed the conventional index to improve several quantitative characters simultaneously. These characters may not be equally important or may not be independent from each other, but all affect the real value of any line in different levels. This method has shown to be efficient for maximum aggregate genetic progress but has some limitations. Of these limitions;1) the difficult in obtaining reliable estimates of phenotypic and genotypic variances and covariances;2) assigning the appropriate economic importance to each trait; and 3) the need to wait until measurements are made for all traits. Besides, several time consuming computations are needed for the construction of the index. Unfortunately, the use of the conventional method did not produce simultaneous improvement. Some traits may be changed in the desired direction whereas others may be changed in undesired directions. This problem was recognized by Kempthorne and Nordskog (1959). They developed the theory of restricted selection indices. The objective of restricted selection is to maximize one (or more) trait while holding one or more correlated traits at the level of the population mean or at some pre-chosen optimum level. In that context, Rosielle . (1977) revealed that direct selection in oat lines derived from a bulk population, for either seed yield or straw yield (economic traits) resulted in lines with high seed yield or straw but, selected lines were tall and late due to the high correlations between heading date and /or plant height with the economic traits. They tested 4 unrestricted and 8 restricted methods by holding heading date and height to the means of the unselected population to remove correlated responses in heading date and height. Severe restriction on unfavorable traits reduced the advance in economic value to near zero. This prevented them from selecting short, early cultivars with high economic seed yield. They added that it is difficult to select an ideal cultivar in most crop species when acceptance is conditioned by several traits. In general, selection indices provide a useful method for quantifying selection potential as well as providing a good chance for more efficient selection. For more accurate calculations and explanation of the results, correlated response between a primary and a secondary trait can be exploited to increase the expression of the primary trait when the selection of the secondary trait produces greater genetic gain than the direct selection of the primary trait (Hallauer ., 2010). Consequently, direct selection for a primary trait, such as seed yield or oil in sesame, is not sufficient to generate sesame genotypes useful as commercial cultivars. The application of the selection index to improve the lines of sesame was rare. Although most researcher in the developed world made benefit from the restricted selection index, research on sesame in developing countries like Korea and Egypt used only the conventional selection index. Lee and Chang (1986) in Korea, practiced conventional selection index to 14 traits including yield plant -1 using 82 cultivars. He stated that the highest genetic advance was for index that included all traits. However, for reasons of expensive and time consumed. He suggested only 3 characters to be included in the index (days to maturity, length of stem with capsules and capsules plant-1) for future selection indices. In Egypt, El-Shimy (1995) used 9 conventional selection indices and reported that after two cycles of selection improved yield plant-1 by 46.34% of the overall mean of the selected families from the better parent. Samar . (2002) applied only one conventional index and compared it to direct selection for yield plant -1. They found that the selection index improved seed yield by 16.1% of F5-derived families.
69 | P a g e
J. Agri-Food & Appl. Sci., 3 (4): 68-84, 2015
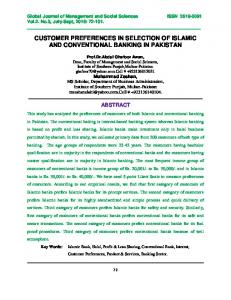
Most recently, Hidalgo-Countreras (2014) in Nebraska, USA used a multi–trait genomic selection index. He used the principle component analysis via 250 principle components which, in his opinion, explained approximately 99% of the total variability. His method could represent a new era in the use of selection indices to increase selection efficiency in self – pollinated crops. In view of the above, the objectives of the present study were: i) To generate new forms of sesame cultivars having high seed yield potential and one or more desired by using either conventinoal or restricted selection indices in advanced breeding generations ; ii) Estimation of variances and covariances analysis for each variable and /or each pair of variables to caculate phenotypic (rp) and genotypic (rg) correlation coefficients and efficiency of each selection index compared to direct selection for yield; iii) Estimation of heritability percentages, expected and actual genetic advances when selecting for a single trait and expected advance from conventional and restricted selection indices to detect the optimum selection procedures. MATERIALS AND METHODS Description of experimental area The two experiments were grown at Agricultural Production and Research Station at National Research Center, El-Nubaria Province, El-Behera Governorate, Egypt, during the two successive summer seasons of 2011 and 2012 (latitude 30 o 30\ N, and longitude 30o19\ E, and mean altitude 21 m above sea level) as shown in Fig. (1).
Figure 1. Location of the Experimental Farm in EL-Nubaria Region, Egypt Physical and chemical characters of soil (0-30 depth ) in the experimental site were as follows: sand 91.2%, silt 3.7%, clay 5.1%, PH 7.3, organic matter 0.3 %, CaCO3 ,1.4%, EC 0.3 ds/m, soluble N 8.1 ppm and available P 3.2 ppm. The experimental area has an arid climate with cool winters and hot dry summers prevailing in the experimental area. There was not rainfall can be take in to consideration through the two seasons, because the amount was very small and the duration wasn't exceed a few minutes. Means of temperature and relative humidity through the growing seasons are presented in Table (1). Table 1. Means of temperature and relative humidity through period from April to August in the selection and the evaluation experiments Month
April May June August
Selection Experiment (2011) Temperature (C0) Relative means humidity% 18.3 62.1 21.1 62.8 23.4 66.0 25.6 67.2
Evaluation Experiment (2012) Temperature (C0) Relative means humidity.% 19.5 61.6 23.1 60.7 26.0 66.0 27.2 72.0
Source: The Climate Lab National Research Centre, Giza, Egypt
Experimental materials: Breeding materials used in this investigation were 27 elite derived lines of sesame in F6 - and F7, obtained via pedigree selection from a continuous breeding program that was initiated at the Agronomy Department, Faculty of Agriculture, Cairo University (Dalia 2001). The program compromised a half diallel mating among six diverse parents (Table 2). In addition, two check cultivars of sesame (Giza 32 and Shandaweel 3) were obtained from the Agric. Res. Center, Ministry of Agriculture, Egypt. The selection in segregating generations (F2-F5) was for adaptive traits of ideal lines as suggested in sesame by (Baydar, 2005). These traits were tri capsules per axil, extra capsule setting, a branching type and segregates with high seed yield. Thus, the traits contributing to high sesame lines were developed sequentially from F 2, whether the same alleles (gene or groups of genes) influenced each trait independently, or whether the same alleles influenced one component directly and another indirectly is conjectural.
70 | P a g e
J. Agri-Food & Appl. Sci., 3 (4): 68-84, 2015
Table 2 . The origin breeding status and description for parents Genotypes P1(HM19) P2 (EUL90) P3 ( Mutant 48)
Breeding status F8hybrid pop. Mutant line
Seed source*
Specific characters
Cairo Univ.*
Early maturity, non branching first capsule set low, 3 capsules/axil.
Cairo Univ.*
Early maturity, non-branching, first capsule set low, 3 capsule/axil.
Mutant line
Cairo Univ.*
Branching, 3 capsules/axil. capsules/axil.
P4 (Giza 32)
Local cultivar Exotic line
Ministry of Agric.& Land Reclamation, Egypt India through IAEA**
Heavy seed weight, medium branching, one capsule/axil, long capsule, late maturity Stiff stem, late maturity, one capsule/axil.
P5 (NM59) P6 (Babil)
Exotic variety
Iraq through IAEA**
Low branching, 1-3 capsules/axil, semi- shattering capsules.
* Advanced breeding materials resulted from the breeding program conducted at Agronomy Department, Faculty of Agriculture, Cairo University. * * Inter. Atomic Energy Agency.
Treatments and experimental design The lines were grown in two categories: selection and evaluation experiments in two successive seasons of 2011 and 2012. In the selection experiment, two types of selection indices were practiced (i.e., conventional and restricted selection indices) and compared to direct selection for seed yield plot-1 using F6 lines in 2011 summer season. In next generation the F6:7 selected lines together with the unselected lines and two check cultivars (Shandaweel 3 and Giza 32) were grown for evaluation in the evaluation experiment (2012). Both (selection and evaluation) experiments were grown in a randomized complete blocks design (RCBD) with four replications. Each block contained 27 sesame lines plus two check cultivars. Each plot was consisted of a single- ridge for each line or a check cultivar to minimize environmental variations associated with large plots. Each ridge was 3 m long and 50 cm width and seeds were sown in hills 10 cm apart. Agricultural practices: The land was ploughed, harrowed and later marked out into blocks and plots according to the design of the experiment. Organic fertilizer was added at the rate of 20 m3/feddan (one feddan =4200 m2 = 0.42 hectare), before planting. Calcium super phosphate (15.5 % P2O5) was applied during soil preparation at the rate of 100 kg/feddan. The two season experiments were sawn at April, 12 and April, 17 during 2011 and 2012 seasons, respectively. Sesame seeds were hand sown 3-5 seeds/hill using dry sowing method on one side of the ridge in hills 10 cm apart during the aforementioned dates in the first and second seasons, respectively. The plots were irrigated immediately after sowing directly. Sprinkler irrigation was applied every week. Potassium fertilizer was added as potassium sulfate (48% K2O) at 200 kg/feddan after 45 days from sowing. Nitrogen fertilizer was added as ammonium nitrate (33.5% N) in three equal doses at 15, 30 and 45 days after sowing. Plants were kept free from weeds, which were manually controlled by hand hoeing at two times. Sprinkler irrigation was applied every week. Thinning was done after appearing three leaves on main stem to secure two plants per hill. The common agricultural practices for growing sesame according to the recommendations of Ministry of Agriculture were followed. All other agronomic practices were kept normal and uniform for all the treatments. No foliar disease was observed during the two growth seasons under natural field conditions. Therefore, no spraying with fungicide was applied. However, a separate experiment was done in Field Crops Department, Biology and Agricultural Science Division, National Research Center, Giza, Egypt in July 2012 to quantify the artificial resistance or susceptibility of lines cope with the selection and evaluation experiments before any recommendation was done (Shabana . 2014). Observations and Data Collection At maturity when the pods turned from green to golden yellow, the capsules were harvested. The observations were recorded on 10 quantitative characters. Ten randomly selected plants were tagged in each row and used for recording the observations of characters. Biometrical data were collected on days to maturity; plant height (cm); stem height to the 1 st capsule (cm); fruiting zone length (cm); number of branches plant-1; number of capsules plant-1; seed index (g); seed yield plant -1 (g); seed yield plot1 (kg) and oil percentage: oil content (%) was determined for individual plants, on dried seeds, by a Soxhlet extraction method according to AOAC (2002) by using the following formula:
Oil content ( percent)
Weight oil extracted ( g ) .100 Weight of sample
Statistical procedures
71 | P a g e
J. Agri-Food & Appl. Sci., 3 (4): 68-84, 2015
Keeping in view the objectives set out for the study, the following statistical tools and methods have been deployed. Analysis of variance (ANOVA) The mean values of each lines in each replication for all the traits were subjected to statistical analysis. Data were analyzed statistically using analysis of variance according to Gomez and Gomez (1984) procedure for a randomized complete block design (RCBD), using the computer program MSTAT-C (MSTAT-C, 1991). The differences among genotypes , was considered significant if the P-values were ≤ 0.05. Estimation of variance components and estimation of magnitude of variation Variance and covariance analyses were computed for each variable and each pair of variables, respectively, in all experiments. The variance component expectations (Table 3) for mean squares and mean cross -products from these analyses are as follows: Table 3. The analysis of variance (ANOVA) showing expected mean squares Source of variation Replications Among lines Error
Degree of Freedom r-1 ℓ-1 (r-1) ( ℓ-1)
Mean Squares (MS)
Expected Mean Squares (EMS)
Mℓi j Me i j
σ2e i j +rσ2g i j σ2 e i j
Where: σ2 e i j = experimental error variance when i=j and covariance when i ≠ j σ2g i j = genotypic variance when i=j and covariance when i ≠ j Mℓi j = phenotypic variance among lines when i=j and covariance when i ≠ j Me i j = σ2 e i j , ℓ and r are the number of lines and replicates, respectively. To estimate the extent of magnitude of variation among all traits, all data were subjected to analysis of variance for two separate years. Hence, variance components (genotypic, phenotypic and error variance) were estimated using the formula of Wricke and Weber (1986) and Prasad . (1981) as follows:
Vg [MSG MSE / r] , V p [MSG / r] , Ve [MSE / r] Where MSG, MSE and r are the mean squares of genotypes, mean squares of error and number of replications, respectively. Estimation of genotypic and phenotypic coefficient of variability Phenotypic (PCV) and genotypic (GCV) coefficient of variation were evaluated according to the methods of Burton (1952), Johnson . (1955) and Kumar . (1985) as:
PCV
Vp x
. 100 , GCV
Vg x
. 100
Where Vp, Vg and x are the phenotypic variances, genotypic variances and grand mean of lines per season, respectively for the characters under consideration. GCV and PCV values were categorized as low (0–10%), moderate (10–20%), and high (20% and above) as indicated by (Shivasubramanian and Menon, 1973). Estimation of heritability in broad sense The broad sense heritability (h2b) was calculated as the ratio of the genotypic variance (Vg) to the phenotypic variance (Vp) (Allard, 1960).
Heritabili ty (h 2 b)
g2 .100 p2
Where h2b = % Broad sense heritability. The heritability percentage was categorized as low (0–30%), moderate (30–60%), and high ≥60% as given by ( Johnson ., 1955). Heritability percentages (h2%) were calculated by using the method of moment as described by Lunch and Walsh (1998). Because sesame lines in this study were essentially homozygous, the primary genetic effects being expressed in the various traits would be additive in nature and additive x additive (the inbreeding coefficient of F 5:6 lines is theoretically 0.968).
72 | P a g e
J. Agri-Food & Appl. Sci., 3 (4): 68-84, 2015
Estimation of genetic advance Expected genetic (GE) and actual genetic (GA) advances under 10% direct selection for individual traits were calculated as applied by Shabana . (1980) by using the following formula: GE = ( s - p) h2 / heritability.
p
× 100 , GA = (
s
-
p)
/
p
× 100, Where
s
is mean of selected lines ,
p
is overall for lines and h2 is
Estimation of phenotypic and genotypic correlation coefficients For calculating the phenotypic (rp) and genotypic (rg) correlation coefficients for all possible combinations the formula suggested by Miller . (1958), Hanson . (1956) and Johnson . (1955) were adopted. The genotypic co-variance components between two traits and the phenotypic co-variance component were derived in the same way as for the corresponding variance components. These co-variance components were used to compute genotypic and phenotypic correlation between the pairs of characters as follows: Phenotypic correlation coefficient
rp rp
Co v p x. y
p2 x p2 y
= Phenotypic correlation coefficient
Cov p x. y
x 2 p
p2 y
= Phenotypic covariance of traits (x & y)
= Phenotypic variance of trait (x). = Phenotypic variance of traits (y).
Genotypic correlation coefficient
rg
rg
Co v g x. y
g2 x g2 y
= Genotypic correlation coefficient
Cov g x. y
x 2 g
= Genotypic covariance of traits (x & y)
= Genotypic variance of trait (x).
y 2 g
= Genotypic variance of traits (y). The coefficients of genotypic correlation were tested using ‘r’ tabulated value at n-2 degrees of freedom at 5 and 1 % probability level, where n denote as number of lines studied.
Selection index procedures The 27 elite lines were dissected for the adaptive traits contributing to seed yield per plot. The means of traits across the four replicates in an experiment were used for the calculation of various selection indices. The equation of the these indices were of the form: I= bi ×1 + b2 ×2 .……… + bn ×n, Where: bi represents the regression coefficient (index weight ) for trait i, ×i is the phenotypic value for the individual trait and i = 1 …..n, respectively, are number of traits that are used in formulating the index (I).The theoretical procedures used were: the conventional for selection index of Smith (1936) and the restricted index as suggested by Kempthorne and Nordskog (1959) and construction of both indices were as follows: 1.Conventional selection index:
73 | P a g e
J. Agri-Food & Appl. Sci., 3 (4): 68-84, 2015
Smith (1936) defined the genetic worth (H) of an individual as :H= a 1G1+a2G2+….+ anGn, Where, G1, G2,….Gn are the genotypic values of individual characters and a1,a2,…,an signify their relative economic importance. Another function (I), based on the phenotypic performance of various characters, is defined as: I=b 1 p1+b2 p2+…+bn pn , Where, b1, b2,…..bn are to be estimated such that the correlation between H and I, i.e, r (H, I),becomes maximum. The maximization of r (H, I) leads to a set of simultaneous equations which upon solving give the desired estimate of b i values. The simultaneous equations look like as follows: b1 x11 + b2 x12 +…+ bn x 1n= a1 G11+ a2 G12+…+ an G1n b1 x21 + b2 x22 +…+bn x2n= a1 G 21+ a2 G 22+…+ an G2n b1 xn1 + b2 xn2 +…+bn xnn= a1 G n1+ a2 G n2+…+ an G nn Which in matrix form become: X11
x12
…..
x1n
x21 . . . xn1
x22 . . . xn2
…… . . . .
x2n . . . xnn
b1
.
b2 . . . bn
=
G11
G12
……
G1n
G21 . . . Gn1
G22 . . . Gn2
……..
G2n . . . Gnn
a1
.
a2 . . . an
The solution of these equations gave the estimates of b i values in the following manner: b= x-1Ga, where b is the column vector, x-1 is the inverse of phenotypic variance and covariance matrix, G is the genotypic variance and covariance matrix and a is the column vector for economic weights. The following traits used to compute of twelve conventional selection indices (Table 4). Table 4. The traits used to compute of twelve conventional selection indices Index No. 1 2 3 4 5 6 7 8 9 10 11 12
Content of the index Direct selection for seed yield plot Days to maturity + Seed yield plot -1 Plant height + Seed yield plot -1 Stem height to 1st capsule + Seed yield plot -1 Fruiting zone length+ Seed yield plot -1 Branches plant-1 + Seed yield plot -1 Capsules plant-1 + Seed yield plot -1 Yield plant -1 + Seed yield plot -1 Plant height + Stem height to 1st capsule + Seed yield plot -1 Number of branches plant-1 + Number of capsules plant-1 + Seed yield plot -1 Plant height +Stem height to 1st capsule + Number of branches plant-1 + Seed yield plot -1 Plant height+ Number of branches plant-1 + Number of capsules plant-1 + Seed yield plot -1 Stem height to 1st capsule + Number of branches plant-1 + Number of capsules plant-1 + Seed yield plot-1
2. Restricted selection indices: Under certain situations (such as oil % and seed index of sesame that showed negative association with seed yield plot-1 such that a zero advance of any of them has no effect on the price of seed used in food processing) the breeder might like to effect change in means of several favorable traits while keeping the means of one or two traits unchanged. This is restricted selection index where the coefficients were estimated according to Kempthorne and Nordskog (1959). The equation of this index was of form: b= [Inn – P-1GC (C′ GP-1GC)-1 C′ G] P-1Ga, where: Inn is the n x n unit matrix, P-1 is the inverse of phenotypic variance and covariance matrix. G is the genotypic variance and covariance matrix. C is coefficient vector matrix. C′ is transposed coefficient vector, which is defined as follows: C' = The traits used to compute of two restricted
1 0
0 1
0 0
0 0
selection indices were as follows:
74 | P a g e
J. Agri-Food & Appl. Sci., 3 (4): 68-84, 2015
Index 1
No.
Traits inc Traits included Seed index +Seed yield plot-1 Oil % + Seed yield plot-1
2
Restriction in the two above selection indices aimed to maximize seed yield plot-1 while holding seed index in the first one and oil% in the second at level of the mean of the 27 F6 lines or less such that no advance in both characters might happen. The expected genetic advance from straight selection for seed yield plot-1 was obtained from the formula given by Falconer (1960). AE = i × VG/σp , Where: σp is the phenotypic standard deviation of the selected character. The expected genetic advance for each index was obtained from the formula given by Brim . (1959). AE = i (∑bi Giy)1/2, Where: AE is the expected gain for an index, bi represents the regression coefficient (index weight ) for trait i and Giy are genotypic covariance of the various characters with seed yield plot -1. Selection indices were statistically analyzed using excel software (2010). Spearman's Rank Correlation Coefficient Rank correlation was calculated according to Spearman (1904) as follows: 6 D 2 rs 1 n (n 2 1) Where D is rank x – rank y (i.e. the difference in the ranks) and n is the number of data pairs. RESULTS AND DISCUSSION The knowledge of genetic variation and association between agronomic traits is regarded to support considerable help to maintain genetic improved to breeding programme. This will assist plant breeders in choosing which agronomic traits should be used in their breeding programme. In the programme, high range of variability, heritability, genetic advance and positive correlation coefficient among traits could be an excellent tool for improving or selection genotype (Akbar ., 2003). Sesame is the crop of small holders and devoted to soils that are not suitable for main summer crops such as maize or rice. Having this in mind (consciously or unconsciously) we had an idoetype in mind that is suitable to the conditions of growing sesame in Egypt. When the 27 elite sesame lines were selected in the segregating generations (from F 2-F5), and as described by Baydar (2005), the traits contributing to high sesame lines were developed sequentially from F 2. But, whether the same alleles (gene or groups of genes) influenced each trait independently or whether the same alleles influenced one component directly and a subsequent indirectly in each trait selected was conjectural. 1. Analysis of Variance (ANOVA) The results of analysis of variance for the studied traits under investigation are presented in Table (5). The result of the analysis of variance showed that there was significant (p