International Journal of COPD
Dovepress open access to scientific and medical research
O r i g i n al R e s e a r c h
Open Access Full Text Article
Value of procalcitonin, C-reactive protein, and neopterin in exacerbations of chronic obstructive pulmonary disease This article was published in the following Dove Press journal: International Journal of COPD 25 February 2011 Number of times this article has been viewed
Alicia Lacoma 1,4 Cristina Prat 1,4 Felipe Andreo 2,4 Luis Lores 3 Juan Ruiz-Manzano 2,4 Vicente Ausina 1,4 Jose Domínguez 1,4 Servei de Microbiologia, 2Servei de Pneumologia, Hospital Universitari Germans Trias i Pujol, Fundació Institut d’Investigació en Ciències de la Salut Germans Trias i Pujol, Universitat Autònoma de Barcelona, Badalona, Spain; 3Servei de Pneumologia, Hospital de Sant Boi, Sant Boi de Llobregat, Spain; 4 CIBER Enfermedades Respiratorias (CIBERES), Instituto de Salud Carlos III, Madrid, Spain 1
Objective: The identification of biological markers in order to assess different aspects of COPD is an area of growing interest. The objective of this study was to investigate whether levels of procalcitonin (PCT), C-reactive protein (CRP), and neopterin in COPD patients could be useful in identifying the etiological origin of the exacerbation and assessing its prognosis. Methods: We included 318 consecutive COPD patients: 46 in a stable phase, 217 undergoing an exacerbation, and 55 with pneumonia. A serum sample was collected from each patient at the time of being included in the study. A second sample was also collected 1 month later from 23 patients in the exacerbation group. We compared the characteristics, biomarker levels, microbiological findings, and prognosis in each patient group. PCT and CRP were measured using an immunofluorescence assay. Neopterin levels were measured using a competitive immunoassay. Results: PCT and CRP showed significant differences among the three patient groups, being higher in patients with pneumonia, followed by patients with exacerbation (P , 0.0001). For the 23 patients with paired samples, PCT and CRP levels decreased 1 month after the exacerbation episode, while neopterin increased. Neopterin showed significantly lower levels in exacerbations with isolation of pathogenic bacteria, but no differences were found for PCT and CRP. No significant differences were found when comparing biomarker levels according to the Gram result: PCT (P = 0.191), CRP (P = 0.080), and neopterin (P = 0.109). However, median values of PCT and CRP were high for Streptococcus pneumoniae, Staphylococcus aureus, and enterobacteria. All biomarkers were higher in patients who died within 1 month after the sample collection than in patients who died later on. Conclusions: According to our results, biomarker levels vary depending on the clinical status. However, the identification of the etiology of infectious exacerbation by means of circulating biomarkers is encouraging, but its main disadvantage is the absence of a microbiological gold standard, to definitively demonstrate their value. High biomarker levels during an exacerbation episode correlate with the short-term prognosis, and therefore their measurement can be useful for COPD management. Keywords: C-reactive protein, exacerbation, neopterin, procalcitonin, prognosis
Introduction Correspondence: J Domínguez Servei de Microbiologia, Fundació Institut en Ciències de la Salut Germans Trias i Pujol, Carretera del Canyet s/n, 08916 Badalona, Spain Tel +34 93 497 88 94 Fax +34 93 497 88 95 Email
[email protected]
submit your manuscript | www.dovepress.com
Dovepress DOI: 10.2147/COPD.S16070
Acute exacerbations of COPD can be precipitated by bacterial and viral infections, and by common pollutants such as tobacco and air pollution. But in up to 30% of cases, the etiological diagnosis of an exacerbation cannot be achieved.1 On the other hand, several factors have been suggested to predict the overall prognosis of COPD, such as the decline in FEV1, the BODE index, the frequency and severity of exacerbations, and the influence of systemic inflammation.2–5
International Journal of COPD 2011:6 157–169 157 © 2011 Lacoma et al, publisher and licensee Dove Medical Press Ltd. This is an Open Access article which permits unrestricted noncommercial use, provided the original work is properly cited.
Dovepress
Lacoma et al
An area of growing interest is to identify biological markers that could assess different aspects of COPD. Pulmonary biomarkers have been measured mainly in bronchoalveolar lavage, induced sputum, and exhaled breath condensate with promising results, but the sampling procedure is invasive and for some assays the variability is very high.6 A recent approach is also the measurement of systemic biomarkers that may provide additional information.7 Several studies have attempted to examine different inflammatory markers during stable state and during exacerbations,8,9 in order to correlate their levels with different factors, such as the inflammatory basal status, the etiological origin of the exacerbation, as well as its prognosis, and the risk of mortality.7 In this regard, we have evaluated 3 biomarkers: procalcitonin (PCT), C-reactive protein (CRP), and neopterin. PCT is a specific marker of systemic bacterial infection and its levels correlate with the etiology and s everity of pneumonia.10,11 Several interventional trials on lower respiratory tract infections, including acute COPD exacerbations, have also suggested that measuring PCT might help to reduce antibiotic prescriptions by means of identifying bacterial infections without affecting patient recovery.12 CRP is a sensitive acute phase reactant, levels of which increase in the presence of infection and during chronic inflammatory conditions.13 It has been evaluated in different settings of COPD patients, in order to establish possible association with basal systemic inflammation in the stable period, presence of cardiovascular risk events, disease prognosis and identification of infectious exacerbations.14,15 Neopterin acts as a mediator of cell immunity against intracellular pathogens16 and in lower respiratory tract infections it has shown to improve the discrimination between bacterial and viral origin.17 In patients with community acquired pneumonia, neopterin levels have also been shown to correlate with the severity of the infection.10 Therefore, these three biomarkers have been shown to be associated with the etiology of lower respiratory tract infections and may be of interest in the identification of exacerbation episodes that could benefit from antibiotic treatment. These biomarkers have also been reported as markers of severity and prognosis. The objectives of this study are 3-fold: first to determine the levels of inflammatory markers in COPD patients in a clinically stable period, during an exacerbation and during pneumonia; second, to establish if the biomarker levels, together with the presence of clinical symptoms, can help to identify the etiological origin of the exacerbations; finally, to
158
submit your manuscript | www.dovepress.com
Dovepress
examine whether biomarkers can be used to predict short- and long-term prognosis after an exacerbation episode.
Patients and methods Setting and study population We included 318 consecutive adult COPD patients from September 2001 to September 2005, who were admitted to the Hospital Universitari Germans Trias i Pujol and the Hospital de Sant Boi de Llobregat (Spain). Ethical approval was given by the Ethics Committee from both institutions and written informed consents were obtained. The diagnosis of COPD was based on clinical history, physical examination and spirometric criteria according to the Spanish Society of Pneumology and Thoracic Surgery (SEPAR) guidelines.18 The severity of the disease was categorized into mild (80% , FEV1, 60%), moderate (59% , FEV1 , 40%) and severe (FEV1 , 40%).18 Exclusion criteria were as follows: patients with history of asthma, cystic fibrosis or active pulmonary tuberculosis, and patients with no adequate clinical samples available (serum samples). The study population consisted of 46 COPD patients during a clinically stable phase (without exacerbation or pneumonia within at least 1 or 2 months, respectively); 217 undergoing an exacerbation; and 55 COPD patients diagnosed with pneumonia. Stable patients were recruited during scheduled visits, in order to define a baseline inflammatory response and for comparison with the exacerbation group. Exacerbation was defined as an acute worsening of the patient’s condition from stable state and beyond normal day-to-day variations, which presents with worsened dyspnea; worsened sputum volume and/or change in its color; or any combination of these symptoms, and requires a change in regular medication.19 Pneumonia was defined by clinical (presence of fever, cough, dyspnea) and radiographic signs (pneumonic infiltrate in the chest radiograph), as well as clinical evolution, assessed by expert clinicians and radiologists.20 We collected sputum samples and blood cultures for microscopic examination and standard bacteriological culture, and urine for antigen detection from those patients in the pneumonia and exacerbation groups, in order to identify the etiological origin.21 A total of 272 sputum samples (217 from exacerbated patients and 55 from patients with pneumonia) was collected (1 sample per patient). Sputum samples were transported immediately to the microbiology laboratory or refrigerated until transport. After microscopic examination, only those samples with ,25 squamous epithelial cells
International Journal of COPD 2011:6
Dovepress
and .25 polymorphonuclears per low-power field were cultured.22 Pneumococcal pneumonia was diagnosed by isolation of Streptococcus pneumoniae from blood culture or by detection of pneumococcal capsular polysaccharide antigen in urine samples by counterimmunoelectrophoresis.23–25 Legionella pneumonia was diagnosed by urinary antigen detection of Legionella pneumophila serogroup 1 by enzyme immunoassay (Bartels EIA Legionella urinary antigen. Bartels Inc., Trinity Biotech Company, Wicklow, Ireland). Epidemiological (age, gender) and clinical history data (presence of comorbidities, smoking status, COPD status, FEV1, chronic oxygen therapy, previous steroid and antibiotic therapy) were collected. We also collected information from the exacerbated patients on the characteristics of the exacerbation episodes (Anthonisen criteria, individual clinical symptoms, microbiological findings, length of hospitalization).
Patient follow-up A blood sample was collected from each patient at the time of inclusion into the study: hospital admission (for the exacerbation and pneumonia group) or during the scheduled visit (for the stable group). Two years later, clinical files were retrospectively reviewed and the patient follow-up was recorded in order to assess clinical outcome (readmission, days until next episode, number of exacerbations within 1 year, and days until death, when that occurred). Among the 217 exacerbated patients, from 23 we also collected a second serum sample 1 month later, when the patient was in the recovery phase. All serum samples were stored at –20°C until biomarkers were measured.
Biomarker measurement PCT and CRP were measured with an immunofluorescent assay (Kryptor Brahms AG, Hennigsdorf, Germany) with functional sensitivities of 0.06 ng/mL and 0.15 µg/mL, respectively. The intra- and inter-assay coefficients for PCT at a sample concentration of 0.2 ng/mL were 10%. The intraand inter-assay coefficients for CRP at a sample concentration of 1.03 µg/mL were 5.1% and 14.2%, respectively. Neopterin levels were measured with a competitive immunoassay following the manufacturers’ instructions (Neopterin ELISA, IBL, Hamburg, Germany). The assay lower limit of detection was 0.7 nmol/L. The intra-assay coefficient at a sample concentration of 7.7 to 48 nmol/L was 3.6% to 6.8%, and inter-assay coefficient at a sample range of 7.4 to 59 nmol/L was 7.6% to 10.3%.
International Journal of COPD 2011:6
Biomarkers in COPD
Statistical analysis Discrete variables are expressed as counts (percentages) and continuous variables as mean ± standard deviation (SD) or median (interquartile range [IQR]). The comparison of groups was performed using the Mann–Whitney U test, Kruskal–Wallis test or Wilcoxon matched-pair test, as appropriate. Mann–Whitney was applied when assessing if biomarker levels varied significantly when considering the presence of several variables (comorbidities, steroid/ antibiotic/oxygen treatment, smoking status) at baseline and at exacerbation (Table 2). This test was also applied for comparing biomarker levels according to the characteristics of the exacerbation episode (Anthonisen criteria, presence of individual symptoms and sputum culture result), the need for readmission, and patient survival. Kruskal–Wallis was applied when assessing if there were differences in biomarker levels between the 3 patient groups (stable vs exacerbated vs pneumonia). The Wilcoxon matched-paired test was applied when comparing biomarker levels for the subgroup of 23 patients with second samples. Pearson’s chi-square test was applied when comparing baseline characteristics between the 3 patient groups and between the exacerbated patients according to the sputum culture result. Correlation analyses were performed using Spearman’s correlation. The use of biomarkers and symptoms in identifying probable bacterial origin was investigated by receiver operating characteristic (ROC) analysis. Sample size was calculated in order to find differences in the biomarker levels between exacerbated patients with probable bacterial origin and those of noninfectious origin. In order to detect statistically significant differences between these 2 groups and supposing a standardized size effect of 0.60, a significance level of 5% (unilateral), and a beta risk of 20%, 97 patients are needed in both groups. To assess the influence of PCT, CRP, and neopterin levels, age and COPD severity on 2-year survival, Cox-regression univariate and multivariate analyses were performed. The time to death up to 2 year was analyzed by Kaplan–Meier survival curves, and compared by the log-rank test. Associations were considered statistically significant if P value was ,0.05. The commercial statistical software packages used were SPSS 15.0 (SPSS Inc, Chicago, IL) and GraphPad Prism 5 (Graph Pad Inc, San Diego, CA).
Results Study population The characteristics of the 318 patients included in the study, according to their corresponding group are shown in
submit your manuscript | www.dovepress.com
Dovepress
159
Dovepress
Lacoma et al
Table 1. FEV1 measurement at the time of study inclusion was recorded for 248 patients (78%). For the remaining 70 patients, FEV1 was not available, but all of them were clinically and spirometrically diagnosed with COPD. Overall, it was a predominantly male COPD population with a mean age of 71.21 years (SD: 10.10). Comparison of baseline characteristics according to patient group showed statistical differences for, smoking status, presence of congestive heart failure, severity of COPD, and use of chronic oxygen therapy and steroid treatment (Table 1). Some of the differences found can be explained by the fact that exacerbated patients have a more severe COPD, with higher frequencies of chronic oxygen therapy and steroid treatment.
Interestingly exacerbated patients also had a higher frequency of congestive heart failure. When considering only exacerbated patients, and comparing population characteristics according to sputum culture results (normal flora/negative or pathogenic bacteria), we found statistical differences only for the presence of renal disease (Table 1). We also assessed whether PCT, CRP, and neopterin levels could be affected by the presence of comorbidities, smoking status, chronic oxygen therapy, and previous steroid and antibiotic treatment in the following 2 groups: patients at stable state (baseline) and patients undergoing an exacerbation (Table 2). Spearman’s correlations were 0.087 (P = 0.219) for PCT, –0.035 (P = 0.621) for CRP, and 0.055
Table 1 Study population characteristics according to patient group: calculation of p values for the comparison of clinical and demographical characteristics for the 3 patient groups and for exacerbated patients according to the sputum culture result Characteristic
Study population
Exacerbated patients
Stable n = 46 (%)
Exacerbated n = 217 (%)
Pneumonia n = 55 (%)
p value
Normal flora/neg n = 85 (%)
Pathogenic bacteria n = 76 (%)
P value
Age Mean ± SD
70.9 ± 10.3
71.4 ± 9.9
69.3 ± 10.5
0.329
72.6 ± 8.8
72.3 ± 8.7
0.88
Gender Female Male
1 (2.2) 45 (97.8)
13 (6) 204 (94)
1 (1.8) 54 (98.2)
0.290
4 (4.7) 81 (95.3)
4 (5.3) 72 (94.7)
0.260
Current smoker Yes Ex-smoker Nonsmoker Not available
15 (32.6) 23 (50) – 8 (17.4)
38 (17.5) 150 (69.1) 23 (10.6) 6 (2.8)
14 (25.5) 38 (69.1) 1 (1.8) 2 (3.6)
0.004*
13 (15.3) 60 (70.6) 9 (10.6) 3 (3.5)
8 (10.5) 9 (11.8) 58 (76.4) 1 (1.3)
0.633
Comorbidities Neoplasia Liver disease Congestive heart failure Arterial hypertension Cerebrovascular disease Renal disease Diabetes Not available
8 (17.4) – 5 (10.9) 14 (30.4) 2 (4.3) 4 (8.7) 12 (26.1) 8 (7.4)
29 (13.4) 10 (4.6) 61 (28.1) 82 (37.8) 18 (8.3) 14 (6.5) 52 (24) 3 (1.4)
9 (16.4) 5 (9.1) 9 (16.4) 17 (30.9) 3 (5.5) 5 (9.1) 8 (14.5) –
0.525 0.107 0.047* 0.634 0.725 0.513 0.132
12 (14.5) 2 (2.4) 24 (28.9) 39 (47) 10 (12) 9 (10.8) 24 (28.9) –
9 (11.8) 4 (5.3) 25 (32.9) 27 (35.5) 5 (6.6) 1 (1.3) 18 (23.7) –
0.627 0.346 0.587 0.143 0.239 0.013* 0.45
Severity COPD (FEV1) ,40% 40%–59% 60%–80% Not available
11 (24) 22 (47.8) 3 (6.5) 10 (21.7)
102 (47) 51 (23.5) 17 (7.8) 47 (21.7)
25 (45.5) 13 (23.6) 4 (7.3) 13 (23.6)
0.005*
44 (51.8) 19 (22.3) 5 (5.9) 17 (20)
38 (50) 16 (21) 8 (10.6) 14 (18.4)
0.241
Chronic oxygen therapy Yes Not available
2 (4.3) –
61 (28.1) 5 (2.3)
13 (23.6) 1 (1.8)
0.009*
29 (34.1) 1 (1.2)
22 (29) 1 (1.3)
0.420
Steroid treatment Yes
7 (15.2)
121 (55.8)
28 (50.9)
0.001*
50 (58.8)
48 (63.1)
0.592
Inhaled/oral Inhaled Oral Not specified
– 4 (8.7) 3 (6.5)
103 (85.1) 10 (8.3) 8 (6.6)
25 (45.5) 2 (3.6) 1 (1.8)
0.001*
39 (78) 6 (12) 5 (10)
43 (89.6) 3 (6.3) 2 (4.2)
0.295
Note: *P was considered significant if the value was ,0.05. Abbreviation: SD, standard deviation.
160
submit your manuscript | www.dovepress.com
Dovepress
International Journal of COPD 2011:6
Dovepress
Biomarkers in COPD
Table 2 Values of P for each biomarker when considering the presence of confounding variables at baseline and at exacerbation PCT
Neopterin
CRP
Baseline
Exacerbation
Baseline
Exacerbation
Baseline
Exacerbation
Presence of comorbidities Arterial hypertension Diabetes Neoplastic disease Liver disease Congestive heart failure Cerebrovascular disease Renal disease
0.315 0.918 0.351 – 0.325 0.945 0.886
0.032* 0.047* 0.835 0.256 0.917 0.216 0.101
0.830 0.986 0.171 – 0.909 0.032* 0.510
0.006* 0.063 0.704 0.890 0.389 0.741 0.001*
0.987 0.345 0.568 – 0.225 1 0.886
0.636 0.662 0.613 0.299 0.149 0.720 0.820
Steroid therapy Yes vs no Oral vs inhaled
0.533 –
0.049* 0.347
0.901 –
0.031* 0.322
0.135 –
0.086 0.099
Smoking status Current smokers vs never smokers Current smokers vs ex-smokers Never smokers vs ex-smokers
– 0.311 –
0.659 0.253 0.096
– 0.322 –
0.861 0.964 0.694
– 0.897 –
0.935 0.497 0.581
Previous antibiotic therapy Yes vs no
1
0.664
0.615
0.554
0.308
0.274
Home oxygen Yes vs no
0.307
0.060
0.291
0.104
0.174
0.674
Severity COPD Mild-moderate-severe
0.548
0.146
0.799
0.179
0.900
0.688
Note: *P was considered significant if the value was ,0.05. Abbreviations: CRP, C-reactive protein; PCT, procalcitonin.
(P = 0.434) for neopterin, when considering COPD severity classified according to FEV1.
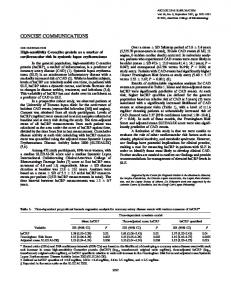
Biomarkers and clinical state Circulating biomarker levels in the stable population, at exacerbation, and during pneumonia are shown in Figure 1. PCT and CRP levels showed significant differences among the 3 groups of patients, being lower during clinical stability and higher during pneumonia (P , 0.0001). In contrast, neopterin levels did not show any significant difference. When considering the subgroup of patients with paired samples, PCT (P = 0.0788) and CRP (P = 0.0181) levels decreased at 1 month after the exacerbation episode (recovery phase), while neopterin levels increased significantly (P = 0.0325) (Figure 2).
Biomarkers and exacerbation episodes Etiology of the exacerbation
The characteristics of the 217 exacerbation episodes are shown in Table 3. According to the classification of Anthonisen,26 none of the biomarker levels differed significantly: PCT (P = 0.085), CRP (P = 0.495), and neopterin (P = 0.383). When considering the presence of individual symptoms, such as fever and impairment of respiratory failure (defined as ratio of the partial pressure of oxygen in arterial blood
International Journal of COPD 2011:6
to the inspired oxygen fraction [PaO 2/FiO2] ,250 with respiratory rate .30/min), no biomarker showed significant difference: PCT (P = 0.370 and P = 0.827), CRP (P = 0.350 and P = 0.708), and neopterin (P = 0.325 and P = 0.837). When mucopurulent expectoration was present, neopterin levels were significantly lower (P = 0.039) while CRP levels were higher with almost statistical significance (P = 0.058), and no significance was found for PCT (P = 0.533). Among the sputum samples collected from the exacerbated patients, 163 were valuable for microbiological culture according to Murray’s criteria.22 In 85 cases the result was normal flora or a negative culture result; in 76 cases potential pathogenic bacteria were isolated, and for the remaining 2 cases, information was missing. Normal flora was defined as microorganisms belonging to oropharyngeal or gastrointestinal flora not usually involved in respiratory infections in nonimmunocompromised patients.22 Interestingly, neopterin (P = 0.018) levels were significantly higher when the culture result was normal flora or negative (18.85 ng/mL; IQR 10.48–36.79) in comparison to isolation of predominant bacteria (14.9 ng/mL; IQR 8.58– 20.9). In contrast, PCT (P = 0.620) and CRP (P = 0.568) levels did not show any significant differences. For exacerbations with normal flora or negative culture results, PCT and CRP levels were 0.10 ng/mL (IQR 0.06–0.21) and 88.66 µg/mL
submit your manuscript | www.dovepress.com
Dovepress
161
Dovepress
Lacoma et al
3.2 0.3
1
CRP [µg/mL log10]
10 1 0.1
PCT [ng/mL log10]
10 31.6 300 316.2
B 100
A
Stable
Exacerbated
Pneumonia
Stable
Exacerbated
Pneumonia
316.2 100 31.6 10 3.2
Neopterin [ng/mL log10]
C
Stable
Exacerbated
Pneumonia
Figure 1 Distribution of procalcitonin (PCT) (ng/mL) (A), C-reactive protein (CRP) (µg/mL) (B), and neopterin (ng/mL) (C) levels according to patient group. PCT levels during stable state, exacerbation, and pneumonia are as follows: 0.06 ng/mL (0.04–0.08), 0.10 ng/mL (0.06–0.22), and 0.24 ng/mL (0.1–1.32). CRP levels during stable state, exacerbation and pneumonia were as follows: 11.83 µg/mL (5.07–44.90), 88.66 µg/mL (31.69–184.5), and 140.4 µg/mL (67.1–252.5). Neopterin levels during stable state, exacerbation, and pneumonia are as follows: 17.09 ng/mL (12.53–25.36), 17.43 ng/mL (9.85–27.84), and 22.26 ng/mL (13.31–35.34). Values of PCT and CRP showed significant differences among the 3 groups of patients (P , 0.0001), being lower during clinical stability. Neopterin did not show any significant differences.
(IQR 38.04–164.35), respectively. For exacerbations with pathogenic bacteria isolation, PCT and CRP levels were 0.10 ng/mL (IQR 0.07–0.22) and 88.61 µg/mL (IQR 34.89–201.12), respectively. Regarding only those sputum culture results with pathogenic bacteria isolated, Gram-negative bacteria accounted for 73.7% of all microorganisms recovered; with Haemophilus influenzae, Pseudomonas aeruginosa, and Moraxella catarrhalis being most frequently isolated (48.2%, 25%, and 16% respectively). Gram-positive bacteria accounted for 22.3%, with S. pneumoniae being the most frequent (88.2%). Aspergillus fumigatus was isolated twice (2.6%), and in the last case there was co-infection of S. pneumoniae and H. influenzae (1.3%). Levels of PCT, CRP, and neopterin according to the microorganism isolated are shown in Table 4. No significant differences were found when comparing biomarker levels according to the Gram result: PCT (P = 0.191), CRP (P = 0.080) and neopterin (P = 0.109). However, the median values of PCT and CRP were high for S. pneumoniae, Staphylococcus aureus, and enterobacteria. In order to assess if it was possible to clinically identify the etiological origin of the exacerbations, we examined a combination of biomarker levels together with the following 162
submit your manuscript | www.dovepress.com
Dovepress
variables: Anthonisen criteria, presence of fever, respiratory failure, and mucopurulent expectoration. Areas under the ROC curve (AUC) for each biomarker were higher when the combination of symptoms and biomarker levels was taken into account than when considering biomarker levels alone (Figure 3).
Exacerbation severity and prognosis For the 217 patients with an exacerbation, the mean length of hospitalization was 12.92 days (SD: 29.20). Spearman’s correlations were 0.171 (P = 0.022) for PCT, 0.150 (P = 0.046) for CRP, and 0.148 (P = 0.045) for neopterin. Among these patients, 147 (67.7%) had to be readmitted in the following year at least once due to a new exacerbation episode and no significant differences were found for PCT (P = 0.258), CRP (P = 0.778), and neopterin (P = 0.255). The mean number of days until the next hospitalization was 210.86 (median 78). Only neopterin correlated significantly with the time until next hospitalization. Thus, the correlations were −0.021 (P = 0.803) for PCT, −0.015 (P = 0.863) for CRP, and 0.209 (P = 0.012) for neopterin. The number of exacerbations within the following year was also recorded for each patient. The mean number of exacerbations was 2.27 International Journal of COPD 2011:6
Dovepress
Biomarkers in COPD B
A
400
0.3
CRP [µg/mL]
PCT [ng/mL]
300 0.2
0.1
200
100
0
0.0 Exacerbation
Stable
Exacerbation
Stable
C 50
Neopterin [ng/mL]
40
30
20
10
0
Exacerbation
Stable
Figure 2 Levels of procalcitonin (PCT) (ng/mL) (A), C-reactive protein (CRP) (µg/mL) (B) and neopterin (ng/mL) (C) for the 23 patients with 2 samples, the first collected during an exacerbation and the second collected 1 month later. Each patient is represented individually. Levels of PCT (P = 0.0788) and CRP (P = 0.0181) decreased in one month. Neopterin levels increased significantly (P = 0.0325).
(SD: 2.06) and did not correlate with any of the biomarkers. Spearman’s correlations were −0.029 (P = 0.730) for PCT, −0.0675 (P = 0.434) for CRP, and −0.115 (P = 0.170) for neopterin. Fifty-five patients died, 41 in the following 2 years, and the remaining 14 later on. There were no significant differences in biomarker levels between survivors and nonsurvivors: PCT (P = 0.061), CRP (P = 0.176), and neopterin (P = 0.264), although higher PCT and CRP levels were seen in those patients who died than in the survivors. The time elapsed between the time the sample was collected and the time the patient died was also recorded. There was no significant correlation between the time of the death and the biomarker levels. Spearman’s correlations were −0.150 (P = 0.290) for PCT, 0.048 (P = 0.738) for CRP, and −0.222 (P = 0.111) for neopterin. Nevertheless, the values of all biomarkers were higher in the group of patients who died within 1 month, decreasing whenever the time of death occurred later on (Figure 4). Indeed, PCT (P = 0.046) and neopterin (P = 0.044) levels were significantly higher in the International Journal of COPD 2011:6
group of patients who died within 1 month than in patients dying later on. Kaplan–Meier survival curves showing patients according to PCT, CRP, and neopterin quartiles are shown in Figure 5. In the multivariate Cox regression model analysis, age and neopterin levels were the only predictive factors independently associated with 2-year survival (P = 0.01 and P = 0.048, respectively).
Discussion Influence of comorbidities and previous treatment In recent years, COPD has been described as an inflammatory disease with systemic consequences.4 Circulating biomarkers might be influenced by several factors, such as the medical treatment or the underlying diseases, which play an important role in COPD management. When assessing the influence of smoking status, previous treatments, presence of comorbidities, and COPD severity itself, it is essential to take into account that COPD patients are very heterogeneous. submit your manuscript | www.dovepress.com
Dovepress
163
Dovepress
Lacoma et al
Table 3 Characteristics of the 217 exacerbation episodes AECOPD characteristics Type of AECOPD according to the Anthonisen criteria I (increased dyspnea, sputum purulence, sputum volume) II (2 of the above) III (1 of the above and 1 or more minor findingsa) Unknown Symptoms Fever Respiratory failure Mucopurulent sputum Sputum culture result (according to Murray criteria) Poor quality or culture not done Normal flora Pathogenic bacteria Unknown Previous antibiotherapy (before sample collection)
n
%
114 25 67 11
52.3 11.5 30.9 5.1
100 119 150
46.1 54.8 69.1
54 85 76 2 45
24.9 39.2 35 0.9 20.7
diseases is common and can affect COPD disease progression and prognosis.30 In our experience, PCT and neopterin levels showed significant differences when taking the presence of arterial hypertension into account. Higher neopterin levels have been found in patients with cardiac and renal diseases.16 To our knowledge, PCT levels are not related to chronic disorders.31
Biomarkers and clinical status Although PCT and CRP levels showed significant differences among the three patient groups, there is some overlap between the stable and the exacerbation groups. In exacerbated COPD patients, PCT levels are higher than in stable patients, although the infection might be locally restricted and too unspecific to show a notable increase in PCT. This may be due to the fact that not all patients might have the same basal levels in the stable state, so the increase in individual biomarker levels during an exacerbation episode might be different. This is one of the reasons that might explain why the ideal approach is probably not to establish biomarker cut-off levels for the overall COPD population, but to individually monitor patients and assess the intra-individual biomarker variation in the long term. In the COPD stable group, biomarker levels reflect a basal local and systemic inflammation. During an exacerbation episode, there is an amplification of this basal inflammation, and thus there is an increase in inflammatory markers.32 It is also important to point out that the severity of the exacerbation episodes could be different for each patient. Parenchymal damage in pulmonary tissue may also be present during exacerbations, even if not detected by conventional methods, such as X-ray. In these cases, biomarker levels may be higher than in those without evidence of parenchymal damage. And, finally, it is also possible that some patients might underestimate their symptoms, so in these individuals the early detection of high levels of biomarkers could be beneficial. When comparing the levels of biomarkers for the 23 patients with 2 consecutive samples individually, we
Note: aMinor findings include fever (.38°C) without other cause; increased wheezing; increased cough; or increased respiratory rate compared with stable baseline condition. Abbreviation: AECOPD, acute exacerbations of COPD.
Secondly, it is also important to focus on how these factors might influence biomarker levels. Our results showed that the smoking habit did not statistically influence levels. But we found similar PCT, neopterin, and CRP levels in exsmokers and current smokers, being higher in both groups than in nonsmoker patients. This reinforces the fact that the smoking habit causes a low-grade inflammatory response.27 It has been reported that corticosteroid therapy decreases the levels of inflammatory markers, with the exception of PCT,28,29 although we found statistically lower values of PCT in exacerbated patients treated with corticosteroids. Interestingly, exacerbated patients undergoing corticosteroid therapy also had significantly lower levels of neopterin. COPD can also predispose individuals to the presence of other comorbidities, such as arterial hypertension, diabetes, and cardiovascular diseases that can potentially influence the outcome of COPD itself. So, the coexistence of associated
Table 4 Number of isolates and levels of PCT, CRP, and neopterin according to the microorganism isolated Microorganism isolated
Number isolates (%)
PCT (ng/mL) median (IQR)
CRP (μg/mL) median (IQR)
Neopterin (ng/mL) median (IQR)
Haemophilus influenzae Pseudomonas aeruginosa Moraxella catarrhalis Enterobacteria Streptococcus pneumoniae Staphylococcus aureus Aspergillus fumigatus Co-infection S. pneumoniae and H. influenzae
27 (35.6) 14 (18.4) 9 (11.8) 6 (7.9) 15 (19.8) 2 (2.6) 2 (2.6) 1 (1.3)
0.09 (0.08–0.14) 0.11 (0.05–0.23) 0.07 (0.04–0.09) 0.20 (0.07–0.44) 0.14 (0.07–0.42) 0.44 0.15 0.34
69.8 (23.89–160.9) 78.75 (19.42–181.5) 77.63 (46.8–157.9) 101.6 (27.83–364.92) 133.4 (74.77–285.97) 307.95 172.73 310.7
15.7 (8.34–23.19) 15.02 (11.39–17.89) 9.87 (6.32–15.64) 18.02 (12.89–30.17) 12.42 (6.8–20) 10.83 16.81 21.07
Abbreviations: CRP, C-reactive protein; IQR, interquartile range; PCT, procalcitonin.
164
submit your manuscript | www.dovepress.com
Dovepress
International Journal of COPD 2011:6
Dovepress
Biomarkers in COPD
PCT, AUC = 0.663
B
CRP, AUC = 0.683
0.0
0.0
0.2
0.2
0.4
0.4
0.6
0.6
0.8
0.8
1.0
1.0
A
0.0
0.2
0.4
0.6
0.8
0.0
1.0
0.2
0.4
0.6
0.8
1.0
Neopterin, AUC = 0.699
0.0
0.2
0.4
0.6
0.8
1.0
C
0.0
0.2
0.4
0.6
0.8
1.0
Figure 3 Receiver operating characteris (ROC) for each biomarker [procalcitonin (PCT) (A), C-reactive protein (CRP) (B), and neopterin (C)] when considering the combination of clinical symptoms and biomarker levels with respect to the prediction of exacerbation of probable bacterial origin. The areas under the curve (AUC), standard error (SE), and 95% confidence interval (CI) when considering PCT, CRP, and neopterin levels alone were 0.523 (0.168, 0.712–1.38), 0.527 (0.205, 0.721–1.61), and 0.609 (0.215, 0.389–0.904) respectively. When adding the information provided by all the variables above to the biomarker levels all the AUC increased: 0.663 (0.198, 0.652–1.42) for PCT, 0.683 (0.253, 0.6530–1.76) for CRP, and 0.699 (0.267, 0.305–0.867) for neopterin.
found that not all biomarkers had the same behavior over time. PCT and CRP decreased in 1 month (recovery phase), presumably to individual basal levels. The decrease in PCT and CRP has also been reported previously.33 In contrast, neopterin levels increased significantly. One possible explanation for this increase is the influence of the corticosteroid treatment. Indeed, when analyzing the exacerbated population alone, patients who were not on corticosteroid therapy had statistically higher levels of neopterin. Of the 23 patients with 2 samples, 7 were having corticosteroid therapy and in 6, levels of neopterin increased in 1 month.
Biomarkers and exacerbation It is difficult and challenging to identify the exacerbations of infectious origin. In fact, between 25% and 50% of COPD patients are colonized with potential respiratory pathogens,1 so the isolation of a predominant microorganism in the sputum is not sufficient to determine the etiological origin of the exacerbation. In stable COPD patients it is possible to isolate potential pathogenic bacteria in sputum samples, so the presence of bacteria during an exacerbation does not
International Journal of COPD 2011:6
prove its direct involvement in the episode. According to the culture result, it is not possible to differentiate between infection and colonization. So, a negative result or a normal flora result also does not exclude the presence of the microorganism responsible of the exacerbation. Therefore, in the absence of a gold standard, there is need for new tools to identify etiological origin of the episode. Even if there are no significant differences in PCT and CRP among patients with pathogenic bacteria and normal flora culture results, it is interesting that AUC values for both biomarkers increased when considering variables suggesting infectious origin. Therefore, a relationship between biomarkers and infectious etiology is likely.12,34 Although in our study, PCT did not show significant differences with the probable etiology of the exacerbation, several pieces of evidence reinforce its correlation with bacterial origin. Firstly, in an interventionist study conducted by Stolz and colleagues,35 PCT guided antibiotic therapy in a group of patients undergoing an acute exacerbation, significantly reduced the antibiotic prescription without negative consequences in the short- and long-term follow-up.
submit your manuscript | www.dovepress.com
Dovepress
165
Dovepress
Lacoma et al B
A 1.4000
*
400.0000
1.0000
CRP [µg/mL]
PCT [ng/mL]
1.2000
0.8000
* *
0.6000
500.0000
0.4000
300.0000
200.0000
100.0000
0.2000 0.0000
0.0000 1 year
1 year
C
Neopterin [ng/mL]
125.0000
100.0000
*
75.0000
50.0000
25.0000
0.0000 1 year
Figure 4 Distribution of procalcitonin (PCT) (ng/mL) (A), C-reactive protein (CRP) (µg/mL) (B), and neopterin (ng/mL) (C) levels according to the time elapsed between the date of sample collection and the time of death, classified as: less than 1 month, 1 to 3 months, 3 to 6 months, 6 months to 1 year, and more than 1 year.
In addition, they found that PCT levels were not associated with bacterial sputum isolation, being also in accordance with our results. And secondly, PCT levels are significantly increased in proven bacterial infections, such as pneumonia, involving parenchymal damage and a marked inflammatory response,10 as occurs in COPD patients and shown in our results. Interestingly, we found that median CRP and PCT levels were high in those exacerbations with isolation of S. pneumoniae, S. aureus, and enterobacteria in comparison to patients with isolation of other pathogenic microorganisms. In fact, S. aureus and S. pneumoniae are able to trigger a significant inflammatory response during pulmonary infections.10,36,37 It has been suggested that CRP plays a role during bacterial exacerbations, since higher levels of this biomarker have been observed in exacerbations with mucopurulent expectoration and Anthonisen type I episodes.15,32,33,38 In our study, CRP levels were almost significant when mucopurulent sputum was present, although no correlation with Anthonisen criteria was found. Higher neopterin levels were found in the group of patients with normal flora or negative culture results, and these could reflect episodes of viral etiology.17 Given that
166
submit your manuscript | www.dovepress.com
Dovepress
viruses such as rhinovirus, influenza, and adenovirus play a role in stable COPD and in exacerbations episodes,1 it would have been interesting to examine their presence in our COPD population. Several factors have been associated with the overall prognosis of COPD.2,4 It has been suggested that novel biomarkers such as copeptin, pro-adrenomedullin, and pro-atrial natriuretic peptide in combination with the classical ones, such as CRP, are potentially capable of predicting short- and long-term outcomes in exacerbations of COPD.33,39,40 In our study, the mean number of exacerbations per year was 2.27, and none of the biomarker levels correlated significantly. Although no biomarker showed a relationship with the number of exacerbations in the following year, neopterin correlated significantly with the time to the next exacerbation. In addition, neopterin and age were the only predictive factors independently associated with 2-year survival. Patients who died in the first month after the sample was collected had significantly higher levels of PCT and neopterin. It is then reasonable to hypothesize that the punctual measurement of some biomarkers during an exacerbation episode might help
International Journal of COPD 2011:6
Dovepress A
Biomarkers in COPD B
80%
60%
40%
PCT quartiles 0.219 ng/mL
20%
100%
Proportion of patients surviving
Proportion of patients surviving
100%
0%
80%
60%
40% CRP quartiles 184.5 µg/mL
20%
0% 0
2
4
6
8
10 12
14 16
18 20
22 24
0
2
4
Time (months)
8
10 12
14 16
18 20
22 24
Time (months) 100%
Proportion of patients surviving
C
6
80%
60%
40% Neopterin quartiles 27.842 ng/mL
0% 0
2
4
6
8
10
12
14 16
18 20
22 24
Time (months) Figure 5 Kaplan–Meier curves showing the proportion of patients surviving according to procalcitonin (PCT) (A), C-reactive protein (CRP) (B), and neopterin (C) levels at admission. Values of P log-rank test are 0.323 for PCT, 0.65 for CRP, and 0.089 for neopterin.
in identifying severe patients with a higher risk of death in the short term, being useful for the identification of shortterm prognosis.
Limitations This study has some limitations. First, the low number of patients in some of the analysis subgroups is insufficient to draw robust conclusions. It is for this reason that further studies including a larger number of patients will be necessary. Second, we did not investigate for the presence of virus either by serological studies or molecular methods. And, finally, we did not take a second serum sample from all the exacerbated patients 1 month later. However, our study provides useful data about the usefulness of biomarkers in the field of COPD exacerbations.
Conclusion In summary, this study provides additional data on the use of systemic biomarkers in COPD patients. Biomarkers also vary depending on the COPD clinical status, when considering
International Journal of COPD 2011:6
patients individually. The identification of exacerbation etiology by means of circulating biomarkers is encouraging, but has as its main disadvantage the absence of a gold standard to definitely demonstrate its value. Nevertheless, interventional studies have already demonstrated the potential use of biomarkers for this purpose.35 Levels of biomarkers were higher in patients who died within 1 month, providing information on the short-term prognosis. It may be that the combination of serial biomarker measurements with clinical data could help in the understanding and management of COPD patients.
Acknowledgments We thank the nursing staff of the Pneumology Department, and Microbiology Laboratory technicians of the Hospital de Sant Boi and the Hospital Universitari Germans Trias i Pujol for technical assistance. J Domínguez is a researcher of the “Miguel Servet” programme of the Instituto de Salud Carlos III (Spain). The manuscript has been revised by a native English speaker who is both a professional translator
submit your manuscript | www.dovepress.com
Dovepress
167
Lacoma et al
and qualified philologist from “Unitat d’Assessorament Lingüístic i Traduccions Documents de Recerca” at the Universitat Autònoma de Barcelona. We are indebted to Oliver Hartman and Irma Casas for statistical assessment, to Dr Joaquim Gea for external critical review and to Oriol Martos for his kind technical assistance.
Financial support This study was supported by grants from Fundació La Marató TV3, Fondo de Investigaciones Sanitarias (CP03/00112), Societat Catalana de Pneumologia (SOCAP), Fundació Catalana de Pneumologia (FUCAP) and Sociedad Española de Neumologia y Cirugia Torácica (SEPAR).
Disclosure No company had a role in the design or conducting of the study, collection, management, or interpretation of the data, preparation, review, or approval of this manuscript. The authors have no conflict of interest, including specific financial interests or relationships or affiliations to the subject matter or materials discussed in the manuscript.
References
1. Sapey E, Stockley RA. COPD exacerbations. 2: aetiology. Thorax. 2006;61(3):250–258. 2. Donaldson GC, Seemungal TA, Bhowmik A, Wedzicha JA. Relationship between exacerbation frequency and lung function decline in chronic obstructive pulmonary disease. Thorax. 2002;57(10): 847–852. 3. Celli BR, Cote CG, Marin JM, et al. The body-mass index, airflow obstruction, dyspnea, and exercise capacity index in chronic obstructive pulmonary disease. N Engl J Med. 2004;350(10):1005–1012. 4. Agusti AG, Noguera A, Sauleda J, Sala E, Pons J, Busquets X. Systemic effects of chronic obstructive pulmonary disease. Eur Respir J. 2003; 21(2):347–360. 5. Seemungal TA, Hurst JR, Wedzicha JA. Exacerbation rate, health status and mortality in COPD – a review of potential interventions. Int J Chron Obstruct Pulmon Dis. 2009;4:203–223. 6. Barnes PJ, Chowdhury B, Kharitonov SA, et al. Pulmonary biomarkers in chronic obstructive pulmonary disease. Am J Respir Crit Care Med. 2006;174(1):6–14. 7. Lacoma A, Prat C, Andreo F, Dominguez J. Biomarkers in the management of COPD. Eur Respir Rev. 2009;18(112):96–104. 8. Bathoorn E, Liesker JJ, Postma DS, et al. Change in inflammation in out-patient COPD patients from stable phase to a subsequent exacerbation. Int J Chron Obstruct Pulmon Dis. 2009;4:101–109. 9. Karadag F, Karul AB, Cildag O, Yilmaz M, Ozcan H. Biomarkers of systemic inflammation in stable and exacerbation phases of COPD. Lung. 2008;186(6):403–409. 10. Prat C, Dominguez J, Andreo F, et al. Procalcitonin and neopterin correlation with aetiology and severity of pneumonia. J Infect. 2006; 52(3):169–177. 11. Muller B, Prat C. Markers of acute inflammation in assessing and managing lower respiratory tract infections: focus on procalcitonin. Clin Microbiol Infect. 2006;12(Suppl 9):8–16. 12. Tang H, Huang T, Jing J, Shen H, Cui W. Effect of procalcitonin-guided treatment in patients with infections: a systematic review and metaanalysis. Infection. 2009;37(6):497–507.
168
submit your manuscript | www.dovepress.com
Dovepress
Dovepress 13. Pepys MB, Hirschfield GM. C-reactive protein: a critical update. J Clin Invest. 2003;111(12):1805–1812. 14. De Torres JP, Cordoba-Lanus E, Lopez-Aguilar C, et al. C-reactive protein levels and clinically important predictive outcomes in stable COPD patients. Eur Respir J. 2006;27(5):902–907. 15. Weis N, Almdal T. C-reactive protein – can it be used as a marker of infection in patients with exacerbation of chronic obstructive pulmonary disease? Eur J Intern Med. 2006;17(2):88–91. 16. Berdowska A, Zwirska-Korczala K. Neopterin measurement in clinical diagnosis. J Clin Pharm Ther. 2001;26(5):319–329. 17. Ip M, Rainer TH, Lee N, et al. Value of serum procalcitonin, neopterin, and C-reactive protein in differentiating bacterial from viral etiologies in patients presenting with lower respiratory tract infections. Diagn Microbiol Infect Dis. 2007;59(2):131–136. 18. Barbera JA, Peces-Barba G, Agusti AG, et al. Clinical guidelines for the diagnosis and treatment of chronic obstructive pulmonary disease. Arch Bronconeumol. 2001;37(6):297–316. 19. Rodriguez-Roisin R. Toward a consensus definition for COPD exacerbations. Chest. 2000;117(5 Suppl 2):398S–401S. 20. Bartlett JG, Dowell SF, Mandell LA, File TM Jr, Musher DM, Fine MJ. Practice guidelines for the management of community-acquired pneumonia in adults. Infectious Diseases Society of America. Clin Infect Dis. 2000;31(2):347–382. 21. Isenberg HD. Clinical Microbiology Procedures Handbook. 2nd update ed. Washington: ASM Press; 2007. 22. Murray PR, Washington JA. Microscopic and baceriologic analysis of expectorated sputum. Mayo Clin Proc. 1975;50(6):339–344. 23. Andreo F, Ruiz-Manzano J, Prat C, et al. Utility of pneumococcal urinary antigen detection in diagnosing exacerbations in COPD patients. Respir Med. 2010;104(3):397–403. 24. Coonrod JD, Rytel MW. Detection of type-specific pneumococcal antigens by counterimmunoelectrophoresis. I. Methodology and immunologic properties of pneumococcal antigens. J Lab Clin Med. 1973; 81(5):770–777. 25. Dominguez J, Gali N, Blanco S, et al. Detection of Streptococcus pneumoniae antigen by a rapid immunochromatographic assay in urine samples. Chest. 2001;119(1):243–249. 26. Anthonisen NR, Manfreda J, Warren CP, Hershfield ES, Harding GK, Nelson NA. Antibiotic therapy in exacerbations of chronic obstructive pulmonary disease. Ann Intern Med. 1987;106(2):196–204. 27. Yanbaeva DG, Dentener MA, Creutzberg EC, Wesseling G, Wouters EF. Systemic effects of smoking. Chest. 2007;131(5):1557–1566. 28. de Kruif MD, Lemaire LC, Giebelen IA, et al. The influence of corticosteroids on the release of novel biomarkers in human endotoxemia. Intensive Care Med. 2008;34(3):518–522. 29. Perren A, Cerutti B, Lepori M, et al. Influence of steroids on procalcitonin and C-reactive protein in patients with COPD and communityacquired Pneumonia. Infection. 2008;36(2):163–166. 30. Sin DD, Anthonisen NR, Soriano JB, Agusti AG. Mortality in COPD: role of comorbidities. Eur Respir J. 2006;28(6):1245–1257. 31. Christ-Crain M, Muller B. Biomarkers in respiratory tract infections: diagnostic guides to antibiotic prescription, prognostic markers and mediators. Eur Respir J. 2007;30(3):556–573. 32. Hurst JR, Donaldson GC, Perera WR, et al. Use of plasma biomarkers at exacerbation of chronic obstructive pulmonary disease. Am J Respir Crit Care Med. 2006;174(8):867–874. 33. Stolz D, Christ-Crain M, Morgenthaler NG, et al. Copeptin, C-reactive protein, and procalcitonin as prognostic biomarkers in acute exacerbation of COPD. Chest. 2007;131(4):1058–1067. 34. Simon L, Gauvin F, Amre DK, Saint-Louis P, Lacroix J. Serum procalcitonin and C-reactive protein levels as markers of bacterial infection: a systematic review and meta-analysis. Clin Infect Dis. 2004; 39(2):206–217. 35. Stolz D, Christ-Crain M, Bingisser R, et al. Antibiotic treatment of exacerbations of COPD: a randomized, controlled trial comparing procalcitonin-guidance with standard therapy. Chest. 2007;131(1): 9–19.
International Journal of COPD 2011:6
Dovepress 36. Lowy FD. Staphylococcus aureus infections. N Engl J Med. 1998; 339(8):520–532. 37. Kadioglu A, Andrew PW. The innate inmune response to pneumococcal lung infection: the untold story. Trends Immunol. 2004; 25(3):143–149. 38. Bircan A, Gokirmak M, Kilic O, Ozturk O, Akkaya A. C-reactive protein levels in patients with chronic obstructive pulmonary disease: role of infection. Med Princ Pract. 2008;17(3):202–208.
Biomarkers in COPD 39. Stolz D, Christ-Crain M, Morgenthaler NG, et al. Plasma pro-adrenomedullin but not plasma pro-endothelin predicts survival in exacerbations of COPD. Chest. 2008;134(2):263–272. 40. Lacoma A, Prat C, Andreo F, et al. Usefulness of mid regional pro-atrial natriuretic peptide in the exacerbations of chronic obstructive pulmonary disease. Clin Chim Acta. 2010;412(5–6):470–475
Dovepress
International Journal of COPD
Publish your work in this journal The International Journal of COPD is an international, peer-reviewed journal of therapeutics and pharmacology focusing on concise rapid reporting of clinical studies and reviews in COPD. Special focus is given to the pathophysiological processes underlying the disease, intervention programs, patient focused education, and self management protocols.
This journal is indexed on PubMed Central, MedLine and CAS. The manuscript management system is completely online and includes a very quick and fair peer-review system, which is all easy to use. Visit http://www.dovepress.com/testimonials.php to read real quotes from published authors.
Submit your manuscript here: http://www.dovepress.com/international-journal-of-copd-journal
International Journal of COPD 2011:6
submit your manuscript | www.dovepress.com
Dovepress
169