Variable dose rate sprayer prototype for dose adjustment in tree crops according to canopy characteristics measured with ultrasonic and laser lidar sensors A. Escolà1, F. Camp2, F. Solanelles2, J. Llorens1, S. Planas2, J.R. Rosell1, F. Gràcia2, E. Gil3 and L. Val4. 1 Universitat de Lleida. Agriculture and Forestry Engineering Department. Rovira Roure, 191. 25198 Lleida (Spain). 2 Generalitat de Catalunya. Agriculture, Food and Rural Action Department. Centre de Mecanització Agrària. Rovira Roure, 191. 25198 Lleida (Spain). 3 Universitat Politècnica de Catalunya. Agro-alimentary Engineering an Biotechnology Department. Avda. Canal Olimpic, s/n. 08860 Castelldefels (Spain) 4 Universitat Politècnica de València. Mechanization and Agrarian Technology Department. Camino de Vera, s/n. 46022 Valencia (Spain)
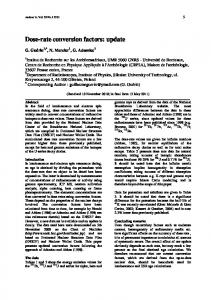
[email protected] Abstract One of the key issues in crop protection products to be applied in tree crops is the dose rate adjustment. An inappropriate dose selection could be responsible of the lack of efficacy due to under dosage and a loss in efficiency due to over dosage. Both situations imply economical losses and greater impacts on the environment. A better dose adjustment is possible from a variable rate technology approach by measuring the crown volume and adjusting the dose rate on-the-go according to the variation of the estimated vegetation volume. Tests have been done with a variable rate sprayer prototype and satisfactory results have been achieved. Key words: variable rate, sprayer, dose adjustment, plant protection products application Introduction A lot of work has been done since the 1980s to adapt the spraying techniques to the crops. Some more advances have been achieved in field crops due to its simplicity compared to tree and bush orchards. But the advances in sensors, actuators and in electronic controllers have facilitated the boarding of electronics in sprayers for tree and bush crops also. As described in Solanelles et al. (2006) and in Gil et al. (2006), advances in sprayers for tree crops started by interrupting the spray flow rate when no foliage was detected by means of ultrasonic or optical sensors and electric valves as described in Figure 1b. This could be done along the entire nozzle boom or by independent sections corresponding to different crop heights (Giles et al., 1989; Balsari & Tamagnone, 1998; Koch & Weisser, 2000; Doruchowski & Holownicki, 2000). The next step was matching the sprayed flow rate to the amount of foliage (Figure 1c). A first approach used ON/OFF electric solenoid valves and different hydraulic circuits to spray three discrete spray outputs per side: no flow, half rate and full rate (Moltó et al., 2001).
a
b
Flow rate
c
d
Flow rate
Figure 1. Spray flow rate adjustment models in tree crops. a) Conventional application. b) Selective application. c) Discrete variable rate application. d) Continuous variable rate application. The Agriculture and Forestry Engineering Department of the University of Lleida and the Centre of Agricultural Mechanization of the Agriculture, Food and Rural Action Department of the government of Catalonia (Spain) have been working together to develop a sprayer prototype for continuous variable dose adjustment on-the-go (Figure 1d). It was in 1996 when previous studies began (Rosell et al., 1996) and different technologies have been used since then. Ultrasonic sensors were first used to detect and quantify the vegetation (Escolà et al., 2002). After the adoption of laser lidar (light detection and ranging) sensors for measuring the canopy (Tumbo et al., 2002; Walklate et al., 2002; Sanz et al., 2004) tests has been done with one of them and the results are summarised in this paper. Materials and methods Prototype The prototype was mounted on a Ilemo-Hardi Arrow F 1000 sprayer with vertical deflectors (Figure 2) so that one side is able to perform as a variable rate sprayer. Modifications have been made to locate the crop measuring sensors in the front of the sprayer and into the hydraulic circuit of the sprayer in order to section the nozzle boom into 3 different heights. There have been done modifications such adding a new tank to make field tests quicker and easier, too. The system has been named Fluxpro. The prototype performs a software loop every 10 cm (with ultrasonic sensors) or 20 cm (lidar sensor) covered in the row direction. The difference is due to the longer it takes to transmit the information provided by the lidar. Each loop consists in 3 steps: data acquisition from the sensors, data processing (foliage volume estimation and flow rate calculation) and actuation (to set on the valve to spray the calculated flow rate). Target characterization First tests were done with ultrasonic sensors but on the last trial they have been replaced by a laser lidar sensor. Important differences are found in vertical resolution of measurements (Figure 3), measuring spot diameter, sampling frequency as well as costs. While ultrasonic sensors only measure the foliage in front of them, lidar sensors
Figure 2. View of the variable rate sprayer prototype with ultrasonic and laser lidar sensors in the front (left) and its modified hydraulic circuit (right). perform from 180 to 720 measurements in the vertical line. The spot diameter is clearly smaller for the lidar sensor (Table 1). The laser sensor definitively overcomes the ultrasonic in these two parameters, being able to estimate more precisely the canopy volume. Nonetheless, ultrasonic sensors can perform horizontal measurements while lidar sensors work in a radial way and can generate overestimated volumes due to shadows caused by large central branches. Ultrasonic sensors give higher sampling frequencies while frequencies in lidar sensors depend on the RS-232 communication rate with the controller and the amount of information gathered. Regarding the costs, a lidar sensor can be from 1.5 to 2.5 times more expensive than using 3 ultrasonic sensors per side. Dose determination Keeping the product concentration in the tank constant, the adjustment of the dose is done by modifying the sprayer output. After acquiring the data, the controller estimates the tree cross section. As lidar estimation is strongly smaller, the real value Top sensor
Middle sensor
a
b Bottom sensor
Figure 3. Canopy cross section estimation by means of a) 3 ultrasonic sensors and b) laser lidar sensor.
Table 1. Ultrasonic and laser spot diameters for different possible target distances according to manufacturer’s information. Distance to target (cm) 50 100 150 200
Ultrasonic spot diameter (cm) 4.36 8.72 13.09 17.45
Laser spot diameter (cm) 1.88 2.08 2.29 2.50
is increased by adjusting an external profile (Figure 4). The output flow rate is determined with Equation (1), where Q is the output flow rate, S is the estimated cross section, v is the forward speed and i is an application coefficient which express the needed volume of mixture per unit foliage volume. Q = S⋅ v⋅i
(1)
As the objective is an actuation every 10 or 20 cm (ultrasonic and lidar sensors applications respectively), the sprayed flow rate should be the needed for the foliage volume resulting of extruding the estimated cross section 10 or 20 cm respectively, until a new acquisition is performed. Actuation Last step before spraying through the nozzles is an electric proportional solenoid valve able to modify the output flow rate from 0 to 100 % according to an electric control signal from 0 to 10 V. The control signal is elaborated and sent to the valve by the controller according to an experimentally determined relation in order to match the flow rate of Equation (1). The working side of the prototype has a nozzle boom divided into 3 sections of 3 nozzles with a proportional valve in each section.
Figure 4. Foliage cross section estimation using laser lidar sensor from raw distance data (left) to external profile adjustment (right)
There is a limitation in this kind of valves which is the maximum differential pressure allowed to make closure possible. The model used stands a maximum of 0.8 MPa forcing the working pressure before the valve to be not more than 0.8 MPa. Field tests Field tests were performed in the facilities of the Experimental Station of Lleida that the IRTA has in Gimenells, Lleida, Spain (41.657058º N, 0.391934º E). Two tests with ultrasonic sensors were done in Malus communis L. cv. ‘Top Red’ and Pyrus communis L. cv. ‘Conference’ orchards (Figure 5) while one test using the lidar sensor was done in the latter. Spraying parameters are summarized in Table 2. Each test consisted in 3 different treatments (one of them at constant flow rate as reference) on the same vegetation using metal chelates as described in Murray et al. (2000). Composite foliage samples of 5 leaves were taken from 32 different zones (4 height, 2 sides, inner and outer, trunk and inter trunk) in 3 replicates. The parameter used to compare treatments is the application efficiency (Equation 2). E=
D ⋅ LAI TC ⋅ VA
(2)
Where E is the application efficiency, D is the average deposit, LAI is the Leaf Area Index, TC is the tracer concentration in the tank and VA is the application volume per unit ground area. Table 2. Spraying parameters for conventional, ultrasonic and lidar test. FIELD TEST Nozzle model & No. Droplet DV50 diameter (µm)* Forward speed (m s-1) PTO speed (r min-1) Air flow rate (m3 h-1) *
Variable rate + Variable rate + ultrasounds laser lidar ALBUZ ATR orange, 9 + 9 148.45 156.20 156.20 Same as VR 1.3 0.5 430 40000
Conventional
Measurements done in a Dantec Phase Doppler Particle Analyzer.
Figure 5. Orchards of Malus communis L. cv. ‘Top Red’ and Pyrus communis L. cv. ‘Conference’ in Gimenells where the field test were performed.
Results and discussion Test with ultrasonic sensors In Figure 6 there is an example of a graphical representation of an application to one side of the row in the Pyrus communis L. cv. ‘Conference’ orchard. Complete numerical results are summarized in Table 3. 16.00
0.600
Canopy volume (m3)
12.00 0.400
10.00
0.300
8.00 6.00
0.200
4.00 0.100
Sprayed volume (mL)
14.00
0.500
2.00
0.000
0.00 64
68
71
75
78
82
86
89
93
97
100
104
107
111
Time (s)
Figure 6. Canopy volume (green line), sprayed volume in conventional mode (red line) and in variable rate mode (blue line) for a treatment in Pyrus communis L. cv. ‘Conference’ orchard using ultrasonic sensors. Table 3. Results of tests done in Malus communis L. cv. ‘Top Red’ & Pyrus communis L. cv. ‘Conference’ orchards with ultrasonic sensors (Duncan test; α=0.05).
Application coefficient (L m-3) Application volume (L ha-1) Volume savings (%) Average deposit (µg cm-2) Deposit reduction (%) Efficiency increase (%)
‘Conference’ ‘Top Red’ ‘Conference’ ‘Top Red’ ‘Conference’ ‘Top Red’ ‘Conference’ ‘Top Red’ ‘Conference’ ‘Top Red’ ‘Conference’ ‘Top Red’
Variable rate 1 0.035 0.030 492 465 31.8 35.5 3.59b 3.52b 22.8 33.7 13.30 2.93
Variable rate 2 0.040 0.040 484 544 32.9 24.6 3.65b 3.46b 21.5 34.8 17.09 -13.52
Conventional 0.055 0.050 722 722 4.65a 5.31a -
The better behaviour in the pear orchard could be explained by the fewer foliage in front of the denser canopy of the apple orchard (Figure 5). Test with laser lidar sensor In Figure 7 there is an example of a graphical representationf an application to one side of the row in the Pyrus communis L. cv. ‘Conference’ orchard. Complete numerical results are summarized in Table 4.
10.00
0.45
9.00
0.40
8.00
0.35
7.00
0.30
6.00
0.25
5.00
0.20
4.00
0.15
3.00
0.10
2.00
0.05
1.00
0.00
Flow rate (L/min)
Canopy volume (m3)
0.50
0.00 0
2
4
6
8
10
12
14
16
18
20
22
24
26
28
30
32
34
36
38
40
Distance (m)
Figure 7. Canopy volume (green line), sprayed volume in conventional mode (red line) and in variable rate mode (blue line) for a treatment in Pyrus communis L. cv. ‘Conference’ orchard using a laser lidar sensor. Table 4. Results of tests done in Pyrus communis L. cv. ‘Conference’ orchards with the laser lidar sensor (Duncan test; α=0.05). -3
Application coefficient (L m ) Application volume (L ha-1) Volume savings (%) Average deposit (µg cm-2) Deposit reduction (%) Average efficiency increase (%) Trunk zone (%) Inter trunks zone (%)
Variable rate 0.151 887 44.33 6.90b 35.43 0.52 -22.74 42.82
Conventional 0.270 1594 10.68a -
Average efficiency is nearly the same but there are important differences in zones. Inter trunks efficiency is higher because not much product is needed. The application coefficient set point was 0.125 L m-3. The variable rate application keeps quite close to that. Verifications has been done to ensure the correct operation of the prototype: there is a strong relationship between the canopy volume and the sprayer output (R2 from 0.896 to 0.926 using the lidar sensor) and between the determined flow rate and the real output (R2 from 0.933 to 0.951 using the lidar sensor). Conclusions Results show optimistic trends in efficiency and operation of the prototype. Laser lidar sensor performs better in characterizing the canopy but is a bit slow for real time use. More tests have to been done in different canopy shapes and foliage densities to improve unexpected results.
Acknowledgments This research was supported by the Spanish Ministry of Education and Science, and is part of the funded AGL2002-04260-C04 Research Project. The authors wish to thank Estació Experimental de Lleida (IRTA) for the use of their orchards and to IlemoHardi, S.A. for the loan of the sprayer as well as all the staff of the CMA. References Balsari P., Tamagnone M., 1998. An ultrasonic airblast sprayer. In: proceedings of EurAgEng Conference. Paper 98A-017. Oslo, Norway. Doruchowski G., Holownicki R. 2000. Environmentally friendly spray techniques for tree crops. Crop Protection 19, 617–622. Escolà A., Solanelles F., Planas S., Rosell J.R. 2002. Electronic control system for proportional spray application to the canopy volume in tree crops. In: proceedings of EurAgEng Conference. Paper 02-AE-010. Budapest, Hungary. Gil E., Escolà A., Rosell J.R., Planas S., Val L. 2006. Variable rate application of plant protection products in vineyard using ultrasonic sensors. Crop Protection. In Press. Giles D.K., Delwiche M.J., Dodd R.B. 1989. Sprayer control by sensing orchard crop characteristics: orchard architecture and spray liquid savings. Journal of Agricultural Engineering Research 43, 271–289. Jaeken, P., Doruchowski, G., Holownicki, R., 1997. Use of sensors in selective spray application in orchards. In: Proceedings of V Symposium on Fruit, Nut and Vegetable Production Engineering. Davis (CA), USA. Koch H., Weisser P. 2000. Sensor equipped orchard spraying-efficacy, savings and drift reduction. Aspects of Applied Biology 57, 357–362. Moltó E., Martin, B., Gutiérrez, A., 2001. Pesticide loss reduction by automatic adaptation of spraying on globular trees. Journal of Agricultural Engineering Research 78 (1), 35–41. Murray R.A., Cross J.V., Ridout M.S. 2000. The measurement of multiple spray deposits by sequential application of metal chelate tracers. Ann. Appl. Biol. 137, 245–252. Rosell J.R., Nogués A., Planas S. 1996. An experimental selective orchard spraying system based on the electronic control of applied flow rate. In: proceedings of EurAgEng Conference. Paper 96A-120. Madrid, Spain. Sanz R., Palacín J., Sisó J.M., Ribes-Dasi M., Masip J., Arnó J., Llorens J., Vallés J.M., Rosell J.R. 2004. Advances in the measurement of structural characteristics of plants with a LIDAR scanner. In: proceedings of EurAgEng Conference. Paper 277. Leuven, Belgium. Solanelles F., Escolà A., Planas S., Rosell J.R., Camp F., Gràcia F. 2006. An electronic control system for pesticide application proportional to the canopy width of tree crops. Biosystems Engineering 95(4), 473–481. Tumbo S.D., Salyani M., Whitney J.D., Wheaton T.A., Miller W.M. 2002. Investigation of laser and ultrasonic ranging sensors for measurements of citrus canopy volume. Applied Engineerig in Agriculture 18(3), 367–372. Walklate P., Cross J., Richardson G., Murray R., Baker D. 2002. Comparison of different spray volume deposition models using LIDAR measurements of apple orchards. Biosystems Engineering 82(3), 253–267.