Physiology & Behavior 150 (2015) 69–77
Contents lists available at ScienceDirect
Physiology & Behavior journal homepage: www.elsevier.com/locate/phb
Variable impact of chronic stress on spatial learning and memory in BXD mice Chloe J.A. Shea a, Kimberly A.K. Carhuatanta a,b, Jessica Wagner a, Naomi Bechmann a,c, Raquel Moore a,c, James P. Herman d, Ryan Jankord a,⁎ a
Applied Neuroscience, 711th Human Performance Wing, Air Force Research Laboratory, Wright–Patterson AFB, OH 45433, United States Research Associate Program, National Research Council, National Academies of Science, Washington DC 20001, United States Infoscitex, Inc., Dayton, OH 45435, United States d Department of Psychiatry and Behavioral Neuroscience, University of Cincinnati, Cincinnati, OH 45267, United States b c
H I G H L I G H T S • • • •
Genetic loci identified that predict spatial memory performance The effect of stress on spatial memory performance was unique to genetic strain. Stress exposure reveals unique genetic predictors for spatial memory performance. Spatial learning ability is a consequence of genes and chronic stress history.
a r t i c l e
i n f o
Article history: Received 14 October 2014 Received in revised form 4 June 2015 Accepted 11 June 2015 Available online 14 June 2015 Keywords: BXD QTL Stress Spatial learning Spatial memory Genetics
a b s t r a c t The effects of chronic stress on learning are highly variable across individuals. This variability stems from gene– environment interactions. However, the mechanisms by which stress affects genetic predictors of learning are unclear. Thus, we aim to determine whether the genetic pathways that predict spatial memory performance are altered by previous exposure to chronic stress. Sixty-two BXD recombinant inbred strains of mice, as well as parent strains C57BL/6J and DBA/2J, were randomly assigned as behavioral control or to a chronic variable stress paradigm and then underwent behavioral testing to assess spatial memory and learning performance using the Morris water maze. Quantitative trait loci (QTL) mapping was completed for average escape latency times for both control and stress animals. Loci on chromosomes 5 and 10 were found in both control and stress environmental populations; eight additional loci were found to be unique to either the control or stress environment. In sum, results indicate that certain genetic loci predict spatial memory performance regardless of prior stress exposure, while exposure to stress also reveals unique genetic predictors of training during the memory task. Thus, we find that genetic predictors contributing to spatial learning and memory are susceptible to the presence of chronic stress. Published by Elsevier Inc.
1. Introduction Stress has a complex relationship with learning and cognitive performance, and stress can create both positive and negative effects depending on duration, stressor, and environment. While many studies have focused on acute stress, a period of chronic stress derived from varying psychological and/or physiological stressors in an unpredictable pattern can also impact cognitive performance [12,21,42]. Furthermore, the response to chronic stress in both humans and rodents
⁎ Corresponding author at: 711thHuman Performance Wing, Wright–Patterson AFB, OH 45433, United States. E-mail address:
[email protected] (R. Jankord).
http://dx.doi.org/10.1016/j.physbeh.2015.06.022 0031-9384/Published by Elsevier Inc.
demonstrates tremendous variability in performance. Studies vary as to the effects of chronic unpredictable stress on spatial learning and memory as characterized by the Morris water maze; some studies have demonstrated increased latency to platform times [21,42], while others have shown decreased times due to a change in search strategies [12]. Additionally, chronic variable stress modulates hippocampal longterm potentiation, a mechanism that is associated with performance on water maze performance in rodents [6,8,25,35]. Response greatly varies across individuals as well, indicating a strong genetic component. Gene–environment interactions have been identified for the presence of stress and the development of PostTraumatic Stress Disorder [10,18] and fear learning [3]. However, the interactions of genes and chronic stress on spatial learning and memory have yet to be elucidated. To study the unique interactions between
70
C.J.A. Shea et al. / Physiology & Behavior 150 (2015) 69–77
gene and environment on cognitive performance, we have used the behavioral genetics model of BXD recombinant inbred mice, derived from C57BL/6J and DBA/2J parent strains [25,30,39]. In this model, individual differences in behavioral phenotype are correlated to variations in stretches of DNA through quantitative trait loci (QTL) analysis [7,9,25, 39]. These chromosomal regions of DNA are then further analyzed to identify genes contributing to the phenotypic trait analyzed. In this study, we assess spatial learning and memory in 62 BXD strains and C57BL/6J and DBA/2J parental strains via Morris water maze (MWM) performance. QTL mapping identified unique genetic loci and candidate genes associated with spatial learning performance in control and chronic stress conditions. Our results indicate that a chronic stress environment alters the genetic predictors of spatial learning, revealing an environment–gene interaction.
which occurred overnight. The stressors were as follows: novel overnight housing, in which the mouse was singly housed in a novel rat cage with ad libitum access to food and water; hypoxia, in which for 30 min the mice were placed in a low oxygen environment (8–12% oxygen); open field, in which the mice were singly housed in an open cage (10.5″ × 19″ × 8″) in a well-lit area for 30 min; cold room, in which the mice were placed at 4 °C for 15 min in a cage devoid of bedding, singly housed; and constant motion, in which the mice were placed on an orbital shaker at 100 rpm for 1 h. Each stressor was repeated five times throughout the experiment with the exception of novel overnight housing, which was repeated three times. The combination and sequence of stressors changed each week to prevent predictability and limit habituation. 2.4. Morris water maze
2. Materials and methods 2.1. Subjects A total of 610 mice were obtained from Jackson Laboratories (Bar Harbor, ME, USA). Parent strains C57BL/6J and DBA/2J (n = 9–10 mice each) and 62 BXD strains (n = 6–10 of each strain) were subjected to 4 weeks of behavioral testing starting at age 9 weeks. Mice were singly-housed, provided standard chow and water ad libitum, and kept on a 12 h light/dark cycle. Room temperature and humidity were maintained between 18–24 °C and 30–70%, respectively, with average temperature and humidity remaining at 21 °C and 35%. All procedures were approved by the Wright–Patterson Air Force Base (WPAFB) Institutional Animal Care and Use Committee and performed in accordance with the National Institute of Health standards and the Guide for the Care and Use of Laboratory Animals [1]. 2.2. Experimental design Ten cohorts of 50–66 animals were utilized. Strains utilized within each cohort were assigned randomly. Two littermates per strain were tested in a cohort: one was designated behavioral control (BC), and the other placed through a chronic variable stress (CVS) paradigm. Control animals (n = 305) underwent behavioral testing for three weeks, while CVS animals (n = 305) were placed through the CVS paradigm for one week prior to starting the three week behavioral testing period (elevated plus maze, MWM, and fear conditioning) (Fig. 1). Analysis of emotional behavior during elevated plus maze and fear conditioning is reported in Carhuatanta, [3]. Animals completed an elevated plus maze test the day prior to starting the MWM test. The CVS stressors continued throughout behavioral testing. Cages were changed and body weights measured on a weekly basis. The entirety of testing was conducted over the course of 13 months. 2.3. Chronic variable stress Animals in the Stress population underwent CVS treatment for four consecutive weeks, starting one week prior to the three week behavioral testing period. Five stressors were presented in random order with one stressor presented in the morning (0700–1100) and one in the afternoon (1300–1700), with the exception of novel overnight housing,
The MWM tests the spatial navigation and memory of the mouse, as measured through the latency to find the hidden platform [2,6,26,35]. MWM training was conducted using a 90 cm diameter round basin filled to a water depth of 42 cm. Water was mixed with small quantities of nontoxic white tempera paint until opaque. Temperature was maintained at 19.5–24 °C, with an average temperature of 21 °C. A clear platform (6 cm diameter) was located approximately 0.5 cm below the water in the southwest quadrant. Five training days were completed, each with four 60 s trials with a randomized starting position (North, South, East, or West). On the first training day, if the animal did not reach the platform within 40 s a visible cue was placed on the platform. Five days of training was followed by a 30 s probe trial (24 h post last training session), in which the platform was removed. Immediately following probe trials, mice began a 2 day reversal period, in which the platform was moved from the southwest quadrant to the northeast quadrant (4 trials/day). Mouse swim path, position, speed, and latency to platform were recorded using EthoVision XT 7.0.418 cameras and software (Noldus Information Technology, Wageningen, The Netherlands). Here we assess latency to platform averaged across all trials, training trials, and reversal trials as a measure of learning and memory. Additionally, number of entries into the platform region of the maze during probe was assessed as an index of memory. 2.5. Statistical analysis Performance was assessed as average latency to platform for all trials, training trials, and reversal trials as well as the number of entries into the platform area during probe. Stress-effect was calculated as the difference in performance between control and CVS littermates (CVS minus control). Mixed model analysis was then performed using lme4 and lme Test packages in R (fixed variables: stress, strain, and month of testing; random variable: cohort). A non-linear mixed effect test was performed followed by ANOVA to determine fixed variable main effects. Pearson product–moment correlations (R) and Spearman rank order correlations (rho) across latency to platform time intervals were computed using GeneNetwork for the Control population, Stress population, and Stress-Effect. Heritability of latency to platform average time for control and CVS populations was calculated for both broad- and narrow-sense variability following the Hegmann and Possidente method [14]. Narrow-sense
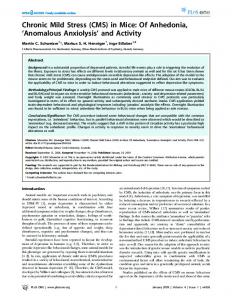
Fig. 1. Experimental design. Control animals underwent three weeks of behavioral testing starting on day 14, while animals designated as Chronic Variable Stress first underwent one week of the stress paradigm and began behavioral testing on day 21.
C.J.A. Shea et al. / Physiology & Behavior 150 (2015) 69–77
heritability is defined as h2 = ½VA / (½VA + VW), where VA = variance among strains and Vw = variance within strains. Variance within strains represents the environmental component of the variance, while variance among strains represents the genetic factors [29]. Broad-sense heritability, H2, was defined as VA / VT, where VT = total population variance. The GeneNetwork suite of web tools (www.genenetwork.org) was used for QTL mapping. GeneNetwork links differences in phenotype to genomic regions using 89 BXD recombinant inbred strains that have been assessed using 3806 genomic markers to identify suggestive and significant QTLs with likelihood ratio statistics with genome-wide probabilities of 0.67 and 0.05, respectively (GeneNetwork.org, [41]). QTLs identified in this study are described by their greatest LRS value, significance threshold passed, and confidence interval (determined via the 1LOD drop method [17]). Candidate genes were identified as genes within the confidence interval of each QTL that have a human homologue and/or have cisexpression. Cis-expression in various brain tissues (amygdala, brain, cerebellum, hippocampus, hypothalamus, midbrain, neocortex, nucleus accumbens, and prefrontal cortex) was determined using the QTLminer tool of GeneNetwork. Genes were further assessed via literary search using PubMed for established relationships to stress, learning, memory, and anxiety.
71
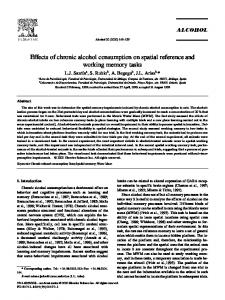
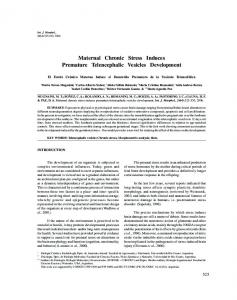
3. Results 3.1. MWM performance in BXD mice An average of the latency to platform of all trials, training trials and reversal trials was assessed for all 62 BXD strains and parental strains (Fig. 2). Great variability was seen across strains in each time period, resulting in 2.4 fold (all trials — Control) to 3.9 fold (reversal trials — Stress) differences. Averages of all mice in Control and Stress populations during each trial are depicted in Fig. 3a. Both populations displayed a reduction in latency to platform signifying learning. On average, mice subjected to CVS stress displayed shorter LTP times throughout the task, however, the effect of stress varied greatly across strains. Number of entries into the platform area during the probe trial (on Day 6 prior to reversal trials) is shown in Fig. 3b. Average frequency of entry per strain spanned from 0 to 2.25 entries for Control, and 0 to 3.4 for Stress. Of note, 58% and 47% of mice failed to enter platform region during the probe in Control and Stress populations, respectively. Moreover, the Stress-effect on probe performance (Stress-Control, within littermate) resulted in no difference in 65% of littermate pairs. The latency to platform averages was tested for correlation in both the control environment (Table 1) and stress (Table 2) environment. Latency to platform was strongly correlated across all time periods in both control and stress conditions. The difference in latency to platform (Stress–Control: Stress Effect) across all trials and during training trials
Fig. 2. Spatial learning performance of BXD strains. Mean ± SEM latency to platform for Control (left), Stress (middle), and mean ± SEM difference in latency to platform (Stress minus Control; Stress-Effect, right) of the average of A) all, B) training, and C) reversal trials during the MWM. Panels C and D indicate the locations of parental strains C57BL/6 and DBA/2 among the rankings, respectively.
72
C.J.A. Shea et al. / Physiology & Behavior 150 (2015) 69–77
Fig. 3. A). Latency to platform during the MWM for the control and chronic stress populations. Mean ± SEM latencies to platform were averaged across all animals for each trial (error bars too small to be seen). B). MWM probe performance. Mean ± SEM number of entries into hidden platform region for Control (left), Stress (middle), and mean ± SEM difference in number of entries (Stress minus Control; Stress-Effect, right) during probe test of MWM. Panels C and D indicate the locations of parental strains C57BL/6 and DBA/2 among the rankings, respectively.
Table 1 Correlation summary of LTP averages in Control population. Spearman rank correlation (rho)
Pearson r
*
All LTP SE All LTP Tr LTP SE Tr LTP Rev LTP SE Rev. LTP Probe f SE Probe f
All LTP
SE All LTP
Tr LTP
SE Tr LTP
Rev LTP
SE Rev. LTP
Probe f
SE Probe f
n = 64 −0.307 0.968* −0.295 0.867* −0.171 −0.447 −0.081
−0.315 n = 64 −0.276 0.909* −0.308 0.65 0.088 −0.143
0.958* −0.265 n = 64 −0.334 0.713* −0.025 −0.435 −0.087
−0.314 0.904* −0.334 n = 64 −0.16 0.286 0.11 −0.177
0.877* −0.307 0.722* −0.164 n = 64 −0.427 −0.385 −0.053
−0.213 0.627 −0.059 0.278 −0.451 n = 64 0.029 −0.016
−0.515 0.11 −0.502 0.131 −0.417 0.101 n = 64 −0.467
−0.042 −0.115 −0.025 −0.139 −0.083 −0.008 −0.505 n = 64
indicate a strength of correlation of greater than 0.5.
were significantly correlated, while a trend was seen relating all the trials and reversal trails in both control and stress conditions. 3.2. Heritability of MWM performance Broad-sense heritability and narrow-sense heritability were calculated to determine the proportion of variance across strains
attributable to genetic variance (Table 3). A strong genetic influence on a trait is determined by h2 ≥ 0.25. Strong heritability was seen in the average of the overall and training periods of both Control and Stress populations. Of note, the stress effect of each performance trait was found to have weak heritability (h 2 = 0.09–0.12). Traits that did not meet the requirement for strong heritability (h2 ≥ 0.25) were not assessed further.
C.J.A. Shea et al. / Physiology & Behavior 150 (2015) 69–77
73
Table 2 Correlation summary of LTP averages in Stress population. Spearman Rank Correlation (rho)
Pearson r
*
All LTP SE All LTP Tr LTP SE Tr LTP Rev LTP SE Rev. LTP Probe f SE Probe f
All LTP
SE All LTP
Tr LTP
SE Tr LTP
Rev LTP
SE Rev. LTP
Probe f
SE Probe f
n = 64 0.388 0.971* 0.337 0.865* 0.28 −0.524 −0.177
0.415 n = 64 0.431 0.909* 0.22 0.65 −0.071 −0.143
0.959* 0.472 n = 64 0.438 0.72 0.2 −0.53 −0.213
0.358 0.904* 0.47 n = 64 0.058 0.286 −0.092 −0.177
0.825* 0.221 0.655 0.074 n = 64 0.395 −0.407 −0.061
0.247 0.627 0.174 0.278 0.345 n = 64 0.008 −0.016
−0.51 −0.072 −0.478 −0.071 −0.428 0.027 n = 64 0.631
−0.118 −0.115 −0.141 −0.139 −0.022 −0.008 0.524 n = 64
indicate a strength of correlation of greater than 0.5.
3.3. Main effects of Stress, Strain, and Month of testing on latency to platform in the MWM A non-linear mixed-effect test followed by ANOVA was run to determine the effects of Strain, Stress, and Month of testing for each trait measured (Table 4). Effects of stress and strain were seen for latency to platform across all trials and during training, supporting the use of QTL mapping using this population and indicating that the unique genetic background of each strain contributed to the averages in each time period. Lastly, no effect for Month of testing was seen in averages of latency to platform of all trials and training trials, indicating that time of year (month) did not contribute significantly to variance observed across cohorts.
3.4. QTL mapping of MWM latency to platform Significant QTLs were found for average latency to platform in all trials and training trials for the Stress population (Fig. 4). QTLs with suggestive LRS scores were found for average latency to platform across all trials and during training in both the Control and Stress populations (Fig. 4). A heatmap depicting the genetic mapping (Fig. 5) reveals the overlap of peaks identified to allow comparison across phenotypic traits and the presence of stress. QTLs unique to the Control population were located on Chromosomes 3, 7, and 10 for all trials and Chromosome 19 for all trials and during training. Peaks only found in the Stress population were identified on Chromosomes 1, 2, and 18 for all trials and training trials, and on Chromosome 8 for Training trials. Of interest, two peaks were found in both populations for average latency to platform across all trials and during training (on Chromosomes 5 and 10). Table 5 provides a summary of each of these peaks.
3.5. Candidate gene analysis Genes within each QTL's confidence interval (determined by 1LOD drop method) were assessed for human homologues and cisregulation to achieve a list of candidate genes Tables 6 and 7).
Table 3 Heritability of MWM performance.
All Training Reversal Probe (f)
Control H2/h2
Stress H2/h2
SE H2/h2
0.52/0.28 0.49/0.26 0.41/0.20 0.26/0.12
0.53/0.30 0.51/0.29 0.42/0.21 0.35/0.18
0.24/0.11 0.26/0.12 0.19/0.09 0.23/0.10
Broad-sense (H2)/Narrow-sense (h2) heritability of latency to platform within Control and Chronic Stress (Stress) populations and Stress-Effect (SE, Stress minus Control). Broadsense: Va / Vt; Narrow-sense: ½Va / (½Va + Vw); Va = variance among strains, Vt = variance across total population Vw = variance within strains.
4. Discussion We have assessed the spatial learning performance of 62 BXD strains and C57Bl/6J and DBA 2A parental strains in the presence and absence of a chronic stress environment. The purpose of this study was to determine whether the predictive relationship between genetic background and spatial memory performance would be unique to environmental context with exposure to chronic stress. Our results show that unique genetic maps were found in our Control and Stress populations. Of interest, novel QTLs associated with spatial learning in the chronic stress environment were identified (see Table 7). Stress treatment elicited significant varied effects on latency to platform during the MWM (all trials and training trials). These effects can be seen in the varied average latencies to platform across each strain (Fig. 1), our mixed-model analysis findings identifying main effects due to chronic stress (Table 2), and, lastly, in the genetic loci identified associates with mouse spatial memory performance unique to Control and Stress populations (Figs. 3 and 4). Although latency to platform was the primary measure of spatial learning in this study it is possible that further investigations on other MWM measures, such as swim path, could provide addition information. Several of the QTLs reported here, especially those found in the Stress population, have not been found previously. Of note, no QTLs achieved significant LRS scores in the Control population; however, some did correspond with significant QTLs in the Stress population. Here we discuss QTLs that reached a significant LRS level. 4.1. QTLs and candidate genes for spatial learning within a chronic stress environment Significant peaks unique for chronic stress on spatial learning performance were found on Chromosomes 1, 2, and 18 (Fig. 3). QTL 18 is a novel QTL for spatial performance that was unique to the Stress population for average latency to platform during all and training trials. This genetic region contains Cdh2 and Dsc1, each contributing to cadherin's role synapse formation and maintaining neuronal circuits ([32,43]). Additionally, the cis-regulated candidate gene, Ttr (transthyretin) is found within this region. This gene is of particular interest for our studies, because the Ttr protein has been associated with both protective and degenerative effects on brain function. In response to physiological insult, including aging and chronic stress, Ttr is expressed and circulates in the cerebrospinal fluid to act as a scavenger of Aβ peptide [20,23]. Nonetheless, mutant forms of Ttr are associated with Alzheimer's disease. Lastly, knockout of Ttr results in decreased spatial learning in the Table 4 Summary of One-way ANOVA results following linear mixed model fit.
All Training
Strain P, F, df
Stress P, F, df
Month P, F, df
b0.0001, 7.14, 63 b0.0001, 6.27, 63
b0.0001, 20.86, 1 b0.0001, 24.51, 1
1, 0.01, 9 1, 0.02, 9
74
C.J.A. Shea et al. / Physiology & Behavior 150 (2015) 69–77
Fig. 4. Individual QTL maps of spatial learning. QTL maps of latency to platform during A) all and B) training trials for the Control (right) and Chronic Stress (left) populations.
MWM that is not subject to further decrement with aging [34]. The relationship of Ttr with performance and its change in expression due to stress suggest a strong linkage of this gene as a contributor to our data set. QTL 1 was significant for latency to platform in both all and training trials. This region has been previously identified for swimming speed and latency to platform over various trials [15,25]. Correlation of our
averages across all and training trials to Milhaud's resulted in a significant correlation (Spearman's rho = 0.82, P b 0.001) [25]; GeneNetwork). Of interest, this QTL resides within what has been described as the emotionality locus of Chromosome 1 [38]. Several candidate genes within this locus have established relationships with stress and anxiety (Fcer1g, Ppox, Cadm3, Atp1a2). Fcer1g encodes for a high affinity IgG receptor. Expression of Fcer1g and Ppox is modulated by
Fig. 5. Heatmap of QTL mapping of latency to platform during all and training trials containing significant and/or suggestive peaks. Dark red represents significant likelihood ratio score associated with DBA/2J genotype. Dark blue represents significant likelihood ratio score of trait associated with C57BL/6J genotype. Abbreviations in legend: All trials (A), Training trials (T), control (C), and chronic stress (S).
C.J.A. Shea et al. / Physiology & Behavior 150 (2015) 69–77 Table 5 QTLs identified for latency to platform.
Table 7 Gene list, QTLs for latency to platform times in high-stress environment.
QTL Chromosome Trait
Group Location
Peak LRS
Peak marker
1 1 1 1 2 2 2 2 3 3 5 5 5 5 5 5 5 5 7 7 8 8 10a 10 10b 10 10b 10
All Training All Training All All Training All Training All Training All All Training
CVS CVS CVS CVS BC BC BC CVS CVS BC CVS BC BC BC
18.787 22.301 16.054 18.463 11.646 12.589 14.415 17.743 22.376 11.841 11.12 10.599 11.158 10.711
NES13029525 NES13029525 CEL-2_135876979 CEL-2_135876979 rs3668064 rs3656989 rs3656989 rs3657916 rs3657916 rs4226520 rs3666069 D10Mit28 rs13480657 rs13480653
10b 10b 18 18 19
All Training All Training All
CVS CVS CVS CVS BC
14.21 13.901 19.218 22.497 12.373
rs13480650 rs13480653 rs6358426 rs6358426 rs3653886
10 10 18 18 19
171.9–175.4 171.7–175.5 131.6–139.6 131.6–139.2 7.7–10.1 63.3–66.8 63.4–69.5 60.6–66.8 60.6–68.0 28.2–31.2 93.1–98.7 0–14.7 73.0–78.8 73.2–79.8 66.7–67.8, 68.8–78.9 72.3–78.5 16.1–24.2 16.1–24.1 33.5–38.1
chronic mild stress [20] and footshock stress, respectively [4,5]. Knockout of the cell adhesion molecule, Cadm3 results in an increase in anxiety and aggression [37]. Genetic manipulation of Atp1a2, a P-type
Chr Mapping location (Mb)
Gene list
1
171.7–175.5
2
131.6–139.2
5
60.6–68.0
8
93.1–98.7
10
66.7–67.8; 68.8–78.9
18
16.1–24.1
Hsd17b7, Ddr2*, Uap1, Uhmk1, Olfml2b, Atf6, Dusp12, Fcgr2b, Fcgr3*, 1700009P17Rik*, Sdhc*, Mpz, Pcp4l1*, Nr1i3*, Tomm40l*, Apoa2*, Fcer1g*, Ndufs2*, Adamts4*, B4galt3*, Ppox*, Usp21, Ufc1*, Dedd*, Nit1*, Pfdn2*, Pvrl4*, Arhgap30*, Usf1*, F11r*, B930036N10Rik*, Refbp2*, Itln1*, Cd244, Ly9, Slamf7*, Cd48, Slamf1, Cd84*, Slamf6*, Vangl2*, Nhlh1, Ncstn*, Copa*, Pex19*, Atp1a4*, Wdr42a*, Pea15a*Casq1*, Atp1a2*, Igsf8*, Kcnj9*, Kcnj10*, Pigm*, Slamf9*, Igsf9*, Tagln2, Ccdc19*, Vsig8*, Slamf8*, Fcrl6*, Dusp23*, Crp, Apcs,Fcer1a, Darc*, Cadm3*, Aim2* Prnp, Prnd, Rassf2*, Slc23a2, Pcna, Cds2, Chgb, Mcm8, 2900022B07Rik*, Bmp2, Hao1, Plcb1*, Plcb4*, Pak7*, BC034902*, Ankrd5, Snap25, Mkks, Jag1, Btbd3 Centd1, 0610040J01Rik*, Rell1*, Pgm1*, Tbc1d1*, Gm1683*, Klf3*, C230096K16Rik*, Tlr1*, Tlr6*, 9130005N14Rik*, Klhl5*, Wdr19, Rfc1*, Rpl9*, Lias, Ugdh*, 1110003E01Rik*, Ube2k*, N4bp2, Rhoh, Chrna9, Nsun7*, Apbb2*, Uchl1*, Limch1*,Phox2b*, Tmem33*, Slc30a9*, Atp8a1* Chd9*, Rb12*, Aktip*, Rpgrip1l*, Fto*, Irx3*, D230002A01Rik*, 4933436C20Rik*, Irx5*, Irx6, Mmp2*, Lpcat2*, Capns2*, Slc6a2, Ces1, Gnao1, Amfr, Bbs2, Mt4, Mt3, Nup93, Slc12a3, Herpud1, Nlrc5*, Tmem28, AI451557*, Cpne2*, Arl2bp, Cc122, Cx3cl1*, 1700121C10Rik*, Ccl17*, Ciapin1*, Coq9*, Polr2c, Dok4*, Gpr114*, Gpr56*, Gpr97*, Katnb1*, Kifc3*, Cngb1, Zfp319*, AA960436*, Mmp15*, Gtl3, Csnk2a2*, 4933406B17Rik*, Gins3*, Ndrg4*, Cnot1, Slc38a7*, Got2 Nrbf2*, Egr2, Zfp365*, Rtkn2*, Arid5b*; Ank3*, Ccdc6, Slc16a9, Phyhipl, Bicc1, Tfam, Ube2d1, Ipmk, Zwint*, Pcdh15, Rtdr1, Gnaz, Rab36, Bcr, Adora2a, Upb1, Snrpd3, Ggt1, Ggtla1, Susd2, Cabin1, Ddt, Gstt1, Gstt2*, Mif, Derl3, Smarcb1, Mmp11,Ndg2*, Gm867*, Vpreb3, S100b, Mcm3ap, Lss, Ftcd, Col6a2, Col6a1, Pcbp3, Slc19a1, Col18a1, Pofut2, Adarb1*, Itgb2, Pttg1ip, Sumo3, Ube2g2, Krtap12-1, Lrrc3, Trpm2, Pfkl, Aire, Dnmt3l, Tmem1, Agpat3, Cstb, Pdxk*, Ilvbl, Casp14, Slc1a6 Cdh2*, Dsc3, Dsc2, Dsc1, Dsg1b*, Dsg4, Dsg3, Dsg2*, Ttr, B4galt6, Rnf125, Rnf138*, Mep1b, Gm944*, Klhl14, 4921517O11Rik*, Asxl3*, Nol4*, Dtna*, Mapre2*, Znf24
Table 6 Gene list, QTLs for latency to platform times in control environment. Chr
3 5
7
10a
Mapping location (Mb)
Gene List
7.7–10.1 63.3–66.8
Stmn2*, Hey1, Mrps28, Tpd52*, Zbtb10, Zfp704*, Pag1, Fabp5* 0610040J01Rik*, Rell1*, Pgm1*, Tbc1d1*, Gm168*, Klf3*, C230096K16Rik*, Tlr1*, Tlr6*, 9130005N14Rik*, Klhl5*, Wdr19, Rfc1*, Rpl9*, Lias, Ugdh*, 1110003E01Rik*, Ube2k*, C030017G13Rik*, N4bp2, Rhoh, Chrna9, Nsun7*, Apbb2*, Uchl1*, Limch1*, Phox2b*, Tmem33*, Slc30a9*, C330024D21Rik*, Atp8a1* Blvrb,Sertad3,Sertad1, Prx, Hipk4*, Pld3*, Akt2*, Map3k10, Zfp59*,Psmc4, Fbl*, Dyrk1b,Dll3*, Timm50, Supt5h, Rps16*, Plekhg2, Zfp36, Gmfg, Lrfn1*, Il28a, Il28b,1190020J12Rik*, Pak4, Fbxo27*, Fbxo17,Mrps12, Sars2, Nfkbib, Sirt2, Zfp420*, Ech1, Lgals4, Lgals7*, Capn12, Actn4*, Map4k1, Ryr1,Rasgrp4*, Ggn, Psmd8, Kcnk6, Yif1b, Spint2, Ppp1r14a, Dpf1, 2310022K01Rik*, Zfp84*, Zfp30*, Zfp790*, BC027344*, 2900035I09Rik*, Zfp27*, Zfp74*, Zfp568*, Zfp14*, Zfp82*, Zfp566*, Zfp260*, Zfp382*, Zfp146*, EG330503*, Cox7a1*, Capns1*, Polr2i*, Thap8*, Clip3*, Alkbh6*, AI4289*, 0610010E21Rik*, Lrfn3, Tyrobp* Cnksr3*, Oprm1*, Rgs17*, Mtrf1l*, Fbxo5, Vip, Myct1, Syne1*, Esr1, Zbtb2, Akap12, Mthfd1l*, Iyd*, Ppp1r14c*, Lrp11*, Pcmt1*, Nup43*, Lats1, Katna1*, Ppil4*, Zc3h12d*, Map3k7ip2, Ust*, Sash1*, Sand5*, Stxbp5*, 9130014G24Rik*, Rab32*, Grm1, Shprh*, Fbxo30, Epm2a, Utrn*, B230208H11Rik*, Stx11*, Sf3b5*, Plagl1*, Ltv1*, Phactr2*, Fuca2*, Pex3*, Adat2*, Aig1*, 6430706H07Rik*, A230061C15Rik*, Hivep2*, Gpr126*, 9030203C11Rik*, Vta1*, Nmbr*, Cited2, Heca*, Reps1, Cccdc28a*, Nhsl1*, Hebp2*, D10Bwg1379c*, Perop* Pcdh15, Rtdr1, Gnaz, Rab36, Bcr, Adora2a, Upb1, Snrpd3, Ggt1, Ggtla1, Susd2, Cabin1, Ddt, Gstt1, Gstt2*, Mif, Derl3, Smarcb1, Mmp11, Ndg2*, Gm867*, Vpreb3, S100b, Mcm3ap, Lss, Ftcd, Col6a2, Col6a1, Pcbp3, Slc19a1, Col18a1, Pofut2, Adarb1*, Itgb2, Pttg1ip, Sumo3, Ube2g2, Krtap12-1, Lrrc3, Trpm2, Pfkl, Aire, Dnmt3l, Tmem1, Agpat3, Cstb, Pdxk*, Ilvbl, Casp14, Slc1a6 Lipf, Ankrd22, Acta2, Fas, Ch25h*, Lipa, Ifit3, Ifit1, Slc16a12, Pank1, Mphosph1, Htr7, Rpp30, Ankrd1, Pcgf5, Hectd2*, Ppp1r3c, Tnka2, Btaf1*, Cpeb3*, Ide, Kif11, Hhex*, Cyp26c1, Cyp26a1, Fer1l3
28.2–31.2
0–18.8
10b 73.0–78.8
19
33.5–38.1
75
Bolded genes are those from QTL regions which overlap between traits (ie. All, Training, Reversal).
Bolded genes are those from QTL regions which overlap between traits (ie. All, Training, Reversal).
ATPase, results in increased fear, anxiety, and impaired learning [13]. A downregulation of Atp1a2 in heterozygous animals impairs spatial learning and locomotor activity, while increasing anxiety [27]. Mutations of this gene found in humans result in migraines and impaired nonverbal learning [31]. Taken together, these results suggest that Fcer1g, Ppox and Cadm3 may be markers for the presence of stress, while Atp1a2 may mark spatial learning performance within a stressful context. A novel QTL found on chromosome 2 was identified in the Stress population. A region nearby (130.8 Mb) to our locus (131.6– 139.2 Mb) has been identified previously for latency to platform [25] and location recognition crossovers in platform location during probe [40]. Our peak may overlap with these previous findings as fewer strains were used in Wehner [40], which can affect resolution of QTL mapping. Within QTL 2, genes for phospholipase C β (Plcb1 and Plcb4) reside. Both Plcb1 and Plcb4 are associated with anxiety [22,33,16]. Plcb1 is downregulated following chronic mild stress and repeated stress ([28,44], single and repeated stress-induced modulation of phospholipase C catalytic activity and expression: role in LH behavior). Knockout of Plcb1 is used as a model for schizophrenia and shows deficits in location recognition and memory, while object recognition remains intact, indicating a deficit in hippocampal dependent learning [16,22,24]. Our experiments confirm a relationship of phospholipase C β with hippocampal-dependent cognitive performance and stress.
76
C.J.A. Shea et al. / Physiology & Behavior 150 (2015) 69–77
4.2. QTLs and candidate genes for spatial learning in either control or chronic stress environment QTLs appearing for spatial learning performance in both Control and Stress populations were found on Chromosomes 5 and 10 (Fig. 3). The QTL on Chromosome 5 achieved significant LRS scores in the chronic stress population while only the suggestive level in the Control population. Interestingly, genes associated with neuronal plasticity were identified (Pgm1, Uchl1, and Atp8a1) [11,19,36], supporting our hypothesis that genes within this region would be responsible for spatial learning regardless of the environmental context. Of interest, Uchl1 expression rescues contextual memory in β amyloid models of Alzheimer disease [11]. Additionally, a deficiency of Atp8a1 results in alterations of activity and decreased performance on the MWM [19]. These results indicate that the locus of QTL 5 contains genes important for hippocampal dependent learning in either control or chronic stress environments.
5. Conclusions In summary, our results identified genetic loci for spatial learning in control and chronic stress environments. Several of these loci are novel for spatial learning performance and should be studied in future experiments. Nonetheless, within these loci are candidate genes that likely contribute to spatial learning performance in their respective environmental contexts. Our results indicate that performance on spatial learning tasks is influenced by both genetic background and chronic stress history.
Acknowledgments This work was completed with the help of TSgt Laura Bass, Dr. Megan Durbin, TSgt Andrew Jimenez, Dr. Catherine Harrison, Dr. Erica Johnson, Dr. Tom Lamkin, 1st Lt Danielle McCarty and 1st Lt Wilson Tucker. This work was supported by the Air Force Office of Scientific Research/Air Force Research Laboratory (AFOSR/AFRL) (14RH08COR). Distribution A: approved for public release: distribution unlimited. 88ABW-2013-4761.
References [1] Guide for the Care and Use of Laboratory Animals: Eighth Edition (2011), The National Academies Press, Washington, D.C. [2] R. Brandeis, Y. Brandys, S. Yehuda, The use of the Morris water maze in the study of memory and learning, Int. J. Neurosci. 48 (1989) 29–69. [3] K.A. Carhuatanta, C.A. Shea, J.P. Herman, R. Jankord, Unique genetic loci identified for emotional behavior in control and chronic stress conditions, Front. Behav. Neurosci. 8 (2014). [4] X. Chen, S. Li, G.J. Kirouac, Blocking of corticotrophin releasing factor receptor-1 during footshock attenuates context fear but not the upregulation of prepro-orexin mRNA in rats, Pharmacol. Biochem. Behav. 120 (2014) 1–6. [5] X. Chen, H. Wang, Z. Lin, S. Li, Y. Li, H.T. Bergen, M.E. Vrontakis, G.J. Kirouac, Orexins (hypocretins) contribute to fear and avoidance in rats exposed to a single episode of footshocks, Brain Struct. Funct. (2013). [6] R. D'Hooge, P.P. De Deyn, Applications of the Morris water maze in the study of learning and memory, Brain Res. Rev. 36 (2001) 60–90. [7] D.L. Di Curzio, D. Goldowitz, The genetic basis of adrenal gland weight and structure in BXD recombinant inbred mice, Mamm. Genome 22 (2011) 209–234. [8] D.M. Diamond, A.M. Campbell, C.R. Park, J. Halonen, P.R. Zoladz, The temporal dynamics model of emotional memory processing: a synthesis on the neurobiological basis of stress-induced amnesia, flashbulb and traumatic memories, and the Yerkes– Dodson law, Neural Plast. 2007 (2007) 60803. [9] H. Dong, M.V. Martin, J. Colvin, Z. Ali, L. Wang, L. Lu, R.W. Williams, G.D. Rosen, J.G. Csernansky, J.M. Cheverud, Quantitative trait loci linked to thalamus and cortex gray matter volumes in BXD recombinant inbred mice, Heredity 99 (2007) 62–69. [10] S.J. Glatt, D.S. Tylee, S.D. Chandler, J. Pazol, C.M. Nievergelt, C.H. Woelk, D.G. Baker, J.B. Lohr, W.S. Kremen, B.T. Litz, M.T. Tsuang, Blood-based geneexpression predictors of PTSD risk and resilience among deployed marines: a pilot study, American Journal of Medical Genetics. Part B, Neuropsychiatric Genetics: The Official Publication of the International Society of Psychiatric Genetics 162B (2013) 313–326.
[11] B. Gong, Z. Cao, P. Zheng, O.V. Vitolo, S. Liu, A. Staniszewski, D. Moolman, H. Zhang, M. Shelanski, O. Arancio, Ubiquitin hydrolase Uch-L1 rescues beta-amyloid-induced decreases in synaptic function and contextual memory, Cell 126 (2006) 775–788. [12] A.M. Gouirand, L. Matuszewich, The effects of chronic unpredictable stress on male rats in the water maze, Physiol. Behav. 86 (2005) 21–31. [13] S.M. Gritz, R.A. Radcliffe, Genetic effects of ATP1A2 in familial hemiplegic migraine type II and animal models, Hum. Genomics 7 (2013) 8. [14] J.P. Hegmann, B. Possidente, Estimating genetic correlations from inbred strains, Behav. Genet. 11 (1981) 103–114. [15] G. Kempermann, F.H. Gage, Genetic determinants of adult hippocampal neurogenesis correlate with acquisition, but not probe trial performance, in the water maze task, Eur. J. Neurosci. 16 (2002) 129–136. [16] H.Y. Koh, D. Kim, J. Lee, S. Lee, H.S. Shin, Deficits in social behavior and sensorimotor gating in mice lacking phospholipase Cbeta1, Genes Brain Behav. 7 (2008) 120–128. [17] E.S. Lander, D. Botstein, Mapping mendelian factors underlying quantitative traits using RFLP linkage maps, Genetics 121 (1989) 185–199. [18] B.R. Lawford, C.P. Morris, C.D. Swagell, I.P. Hughes, R.M. Young, J. Voisey, NOS1AP is associated with increased severity of PTSD and depression in untreated combat veterans, J. Affect. Disord. 147 (2013) 87–93. [19] K. Levano, V. Punia, M. Raghunath, P.R. Debata, G.M. Curcio, A. Mogha, S. Purkayastha, D. McCloskey, J. Fata, P. Banerjee, Atp8a1 deficiency is associated with phosphatidylserine externalization in hippocampus and delayed hippocampus-dependent learning, J. Neurochem. 120 (2012) 302–313. [20] P. Lisowski, M. Wieczorek, J. Goscik, G.R. Juszczak, A.M. Stankiewicz, L. Zwierzchowski, A.H. Swiergiel, Effects of chronic stress on prefrontal cortex transcriptome in mice displaying different genetic backgrounds, J. Mol. Neurosci. 50 (2013) 33–57. [21] D. Liu, Z. Wang, Z. Gao, K. Xie, Q. Zhang, H. Jiang, Q. Pang, Effects of curcumin on learning and memory deficits, BDNF, and ERK protein expression in rats exposed to chronic unpredictable stress, Behav. Brain Res. 271 (2014) 116–121. [22] E.E. Manning, M.I. Ransome, E.L. Burrows, A.J. Hannan, Increased adult hippocampal neurogenesis and abnormal migration of adult-born granule neurons is associated with hippocampal-specific cognitive deficits in phospholipase C-beta1 knockout mice, Hippocampus 22 (2012) 309–319. [23] A. Martinho, I. Goncalves, M. Costa, C.R. Santos, Stress and glucocorticoids increase transthyretin expression in rat choroid plexus via mineralocorticoid and glucocorticoid receptors, J. Mol. Neurosci. 48 (2012) 1–13. [24] C.E. McOmish, E.L. Burrows, M. Howard, A.J. Hannan, PLC-beta1 knockout mice as a model of disrupted cortical development and plasticity: behavioral endophenotypes and dysregulation of RGS4 gene expression, Hippocampus 18 (2008) 824–834. [25] J.M. Milhaud, H. Halley, J.M. Lassalle, Two QTLs located on chromosomes 1 and 5 modulate different aspects of the performance of mice of the B × D Ty RI strain series in the Morris navigation task, Behav. Genet. 32 (2002) 69–78. [26] R. Morris, Developments of a water-maze procedure for studying spatial learning in the rat, J. Neurosci. Methods 11 (1984) 47–60. [27] A.E. Moseley, M.T. Williams, T.L. Schaefer, C.S. Bohanan, J.C. Neumann, M.M. Behbehani, C.V. Vorhees, J.B. Lingrel, Deficiency in Na,K-ATPase alpha isoform genes alters spatial learning, motor activity, and anxiety in mice, J. Neurosci. 27 (2007) 616–626. [28] M. Orsetti, F. Di Brisco, P.L. Canonico, A.A. Genazzani, P. Ghi, Gene regulation in the frontal cortex of rats exposed to the chronic mild stress paradigm, an animal model of human depression, Eur. J. Neurosci. 27 (2008) 2156–2164. [29] E. Petretto, J. Mangion, N.J. Dickens, S.A. Cook, M.K. Kumaran, H. Lu, J. Fischer, H. Maatz, V. Kren, M. Pravenec, N. Hubner, T.J. Aitman, Heritability and tissue specificity of expression quantitative trait loci, PLoS Genet. 2 (2006) e172. [30] V.M. Philip, S. Duvvuru, B. Gomero, T.A. Ansah, C.D. Blaha, M.N. Cook, K.M. Hamre, W.R. Lariviere, D.B. Matthews, G. Mittleman, D. Goldowitz, E.J. Chesler, High-throughput behavioral phenotyping in the expanded panel of BXD recombinant inbred strains, Genes Brain Behav. 9 (2009) 129–159. [31] B. Podesta, E. Briatore, A. Boghi, D. Marenco, S. Calzolari, Transient nonverbal learning disorder in a child suffering from Familial Hemiplegic Migraine, Cephalalgia 31 (2011) 1497–1502. [32] C. Schrick, A. Fischer, D.P. Srivastava, N.C. Tronson, P. Penzes, J. Radulovic, Ncadherin regulates cytoskeletally associated IQGAP1/ERK signaling and memory formation, Neuron 55 (2007) 786–798. [33] J. Shin, G. Gireesh, S.W. Kim, D.S. Kim, S. Lee, Y.S. Kim, M. Watanabe, H.S. Shin, Phospholipase C beta 4 in the medial septum controls cholinergic theta oscillations and anxiety behaviors, J. Neurosci. 29 (2009) 15375–15385. [34] J.C. Sousa, F. Marques, E. Dias-Ferreira, J.J. Cerqueira, N. Sousa, J.A. Palha, Transthyretin influences spatial reference memory, Neurobiol. Learn. Mem. 88 (2007) 381–385. [35] D. Steinberger, D.S. Reynolds, P. Ferris, R. Lincoln, S. Datta, J. Stanley, A. Paterson, G.R. Dawson, J. Flint, Genetic mapping of variation in spatial learning in the mouse, J. Neurosci. 23 (2003) 2426–2433. [36] R. Sultana, D. Boyd-Kimball, J. Cai, W.M. Pierce, J.B. Klein, M. Merchant, D.A. Butterfield, Proteomics analysis of the Alzheimer's disease hippocampal proteome, J. Alzheimers Dis. 11 (2007) 153–164. [37] Y. Tanabe, E. Fujita, Y.K. Hayashi, X. Zhu, H. Lubbert, Y. Mezaki, H. Senoo, T. Momoi, Synaptic adhesion molecules in Cadm family at the neuromuscular junction, Cell Biol. Int. 37 (2013) 731–736. [38] S. Thifault, S. Ondrej, Y. Sun, A. Fortin, E. Skamene, R. Lalonde, J. Tremblay, P. Hamet, Genetic determinants of emotionality and stress response in AcB/BcA recombinant congenic mice and in silico evidence of convergence with cardiovascular candidate genes, Hum. Mol. Genet. 17 (2008) 331–344. [39] X. Wang, K. Mozhui, Z. Li, M.K. Mulligan, J.F. Ingels, X. Zhou, R.T. Hori, H. Chen, M.N. Cook, R.W. Williams, L. Lu, A promoter polymorphism in the Per3 gene is
C.J.A. Shea et al. / Physiology & Behavior 150 (2015) 69–77 associated with alcohol and stress response, Transl Psychiatry 2 (2011) 71 (2012). [40] J.M. Wehner, S. Sleight, M. Upchurch, Hippocampal protein kinase C activity is reduced in poor spatial learners, Brain Res. 523 (1990) 181–187. [41] Williams, R., Yan, L., Sloan, Z. & Centeno, A. (2001) GeneNetwork WebQTL. [42] Y. Xu, J. Pan, J. Sun, L. Ding, L. Ruan, M. Reed, X. Yu, J. Klabnik, D. Lin, J. Li, L. Chen, C. Zhang, H. Zhang, J.M. O'Donnell, Inhibition of phosphodiesterase 2 reverses impaired cognition and neuronal remodeling caused by chronic stress, Neurobiol. Aging 36 (2015) 955–970.
77
[43] C. Zhang, L. Wang, Q. Liao, L. Zhang, L. Xu, C. Chen, H. Ye, X. Xu, M. Ye, S. Duan, Genetic associations with hypertension: meta-analyses of six candidate genetic variants, Genet. Test. Mol. Biomarkers 17 (2013) 736–742. [44] Y. Dwivedi, A.C. Mondal, H.S. Rizavi, P.K. Shukla, G.N. Pandey, Single and repeated stress-induced modulation of phospholipase C catalytic activity and expression: role in LH behavior, Neuropsychopharmacology 30 (2005) 473–483.