Aug 6, 2015 - Narrow-line Seyfert 1 Galaxy WPVS 007: an Origin in the Torus. 1 .... change in the absorption: in addition to the mini-BALs, a broad absorption line with ... and S III, do not vary, suggesting that they originate in a separate ...
arXiv:1508.01257v1 [astro-ph.GA] 6 Aug 2015
Variable Reddening and Broad Absorption Lines in the Narrow-line Seyfert 1 Galaxy WPVS 007: an Origin in the Torus1 Karen M. Leighly Homer L. Dodge Department of Physics and Astronomy, The University of Oklahoma, 440 W. Brooks St., Norman, OK 73019 Erin Cooper Homer L. Dodge Department of Physics and Astronomy, The University of Oklahoma, 440 W. Brooks St., Norman, OK 73019 Dirk Grupe Department of Earth and Space Science, Morehead State University, 235 Martindale Drive, Morehead, KY 40351 Donald M. Terndrup Department of Astronomy, The Ohio State University, 140 W. 18th Ave., Columbus, OH 43210 S. Komossa Max-Planck Institut f¨ ur Radioastronmie, Auf dem H¨ ugel 69, 53121, Bonn, Germany Received
;
accepted
Accepted for publication in ApJ Letters
–2– ABSTRACT
We report the discovery of an occultation event in the low-luminosity narrowline Seyfert 1 galaxy WPVS 007 in 2015 February and March. In concert with longer timescale variability, these observations place strong constraints on the nature and location of the absorbing material. Swift monitoring has revealed a secular decrease since ∼ 2010 accompanied by flattening of the optical and UV photometry that suggests variable reddening. Analysis of four Hubble Space Telescope COS observations since 2010, including a Director’s Discretionary time observation during the occultation, shows that the broad-absorption-line velocity offset and the C IV emission-line width both decrease as the reddening increases. The occultation dynamical timescale, the BAL variability dynamical timescale, and the density of the BAL gas show that both the reddening material and the broad-absorption-line gas are consistent with an origin in the torus. These observations can be explained by a scenario in which the torus is clumpy with variable scale height, and the BAL gas is blown from the torus material like spray from the crest of a wave. As the obscuring material passes into our line of sight, we alternately see high-velocity broad absorption lines and a clear view to the central engine, or low-velocity broad absorption lines and strong reddening. WPVS 007 has a small black hole mass, and correspondingly short timescales, and so we may be observing behavior that is common in BALQSOs, but is not typically observable. Subject headings: quasars: absorption lines — quasars: individual (WPVS 007)
–3– 1.
Introduction
Many quasars exhibit broad (width ∆v > 2000 km s−1 ), blue-shifted absorption lines in their rest-frame UV spectra that are evidence for winds emerging from the central engine (e.g., Weymann et al. 1991); these objects are called broad absorption-line quasars (BALQs). These winds are an essential part of quasars: they carry away angular momentum and thus facilitate accretion, they distribute chemically enriched gas through the intergalactic medium (Cavaliere et al. 2002), and they may inject kinetic energy into the host galaxy, influencing its evolution (e.g., Scannapieco & Oh 2004). Despite the ubiquity of quasar winds, our understanding of the mass outflow rate, geometry, and driving mechanism is limited. Line variability provides a powerful tool for studying the absorbing gas. Modest variability on time scales of a year or less is common, seen in about one-third of BALQs (e.g., Gibson et al. 2008; Capellupo et al. 2011; Filiz Ak et al. 2013). Variability is typically limited to changes in line equivalent width, sometimes in a single component and often at higher velocities, but occasionally dramatic appearances or disappearances of components occur (e.g., Leighly et al. 2009; Hall et al. 2011; Filiz Ak et al. 2012). Another type of absorption phenomenon, occultation of the X-ray emitting region, has recently been observed. One example is NGC 1365, which showed occultation in the broad-line region and transitioned between reflection-dominated and Compton-thin X-ray spectra in four days, indicating a compact X-ray emission region (Risaliti et al. 2007); many 1
Based on observations made with the NASA/ESA Hubble Space Telescope, which is
operated by the Association of Universities for Research in Astronomy, Inc., under NASA contract NAS 5-26555. These observations are associated with programs 11733, 13015, and 14058.
–4– other examples are known (for a review, Bianchi et al. 2012). Thus, it appears that active galactic nucleus (AGN) obscuration is more complicated than the simple unified model for the Seyfert 1/2 dichotomy. WPVS 007 is a low luminosity (MV ≈ −19.7), nearby (z = 0.02882) narrow-line Seyfert 1 galaxy (Grupe et al. 1995) with peculiar UV properties. In a 1996 Hubble Space Telescope FOS spectrum, it showed moderately narrow absorption lines that classified it as a mini-BAL quasar. A FUSE spectrum from 2003 showed evidence for a dramatic change in the absorption: in addition to the mini-BALs, a broad absorption line with Vmax ∼ 6, 000 km s−1 had appeared (Leighly et al. 2009). We present Swift UV photometric monitoring, which reveals the first UV occultation event ever observed. We also discuss four HST COS spectroscopic observations, including one during the occultation, that indicate a correlation between the BAL outflow properties and the reddening. Analysis of timescales suggests that the variability has a common origin in the torus, and we suggest a scenario to explain the observations. Full details of the observations, reduction, and analysis will follow in E. Cooper et al. (2015 in preparation).
2. 2.1.
Observations Swift Observations
WPVS 007 has been monitored with Swift since 2005 (Grupe et al. 2007, 2008, 2013) with the UV-optical telescope (UVOT, Roming et al. 2005) using its six filters spanning the near UV and optical bands. Grupe et al. (2013) reported observations through 2013 July 13. Monitoring continued using UVM2 (rest effective wavelength λeff = 2159˚ A) through the remainder of 2013 and 2014. A secular decrease since ∼ 2010 is seen Fig. 1, and the UV continuum flux dropped significantly following the observation on 2014 November 29.
–5– A six-filter observation on 2015 February 28 showed that the spectrum had become much redder, so we obtained observations with approximately weekly cadence to the present time using all filters. We used the six-point photometry to quantify the spectral variability. The 147 spectra were fit simultaneously to a power law plus SMC reddening (Pei 1992), with the power law index held constant. The results are shown in Fig. 1. We estimate that the continuum was occulted for about 60 days based on the magnitude and E(B − V ) variability (Fig. 1 inset). Color-magnitude plots shown in Fig. 1 display the spectral variability, and superimposed lines show that the color and brightness changes are consistent with variable reddening. Intrinsic optical/UV spectral variability is not a favored explanation for the observed behavior. Principally, the recent event has a characteristic occultation profile, as seen in other astronomical objects such as Cataclysmic Variables. Additionally, Kokubo et al. (2014) show that the typical intrinsic-variability difference spectrum is a power law, but that model does not fit the color/magnitude variability as well as SMC reddening (Fig. 1).
2.2.
HST Observations
WPVS 007 has been observed using HST five times; the four more recent observations are marked on Fig. 1. Spectra in 2010 and 2013 sample the secular decrease, and the most recent observation in 2015 occurred during the occultation. We display the HST spectra and averages of the Swift photometry near the HST observations in Fig. 2 (left). Fig. 2 (right) shows the C IV spectral region, consisting of the deep mini-BAL and the higher-velocity broad absorption lines. The mini-BALs, also present in Si IV, Lyα, N V, and S III, do not vary, suggesting that they originate in a separate large-scale component, unassociated with the BALs; a discussion of their properties is deferred to Cooper et al.
–6– (2015, in preparation). The spectra reveal several model-independent properties. The broad absorption lines show dramatic variability. The C IV BAL depth is never lower than the continuum level of the 1996 spectrum, and the bottoms of the 2013 spectra are flat. This suggests the presence of a non-variable continuum component that is not absorbed by the BALs. The origin of this is not clear; some of it is likely to be intrinsic line emission. The BAL velocity offsets appear to be correlated with the flux. The variability is most clearly observed in the 2010 high-state spectrum, which shows higher Vmax and Vmin compared with the others. There is also evidence that the low-state spectrum has weaker high-velocity absorption: the 2013-minus-2015 difference spectrum (Fig. 3) shows the Lyα line in 2015 has a red wing not present in the 2013 spectra. This suggests that the Lyα line was absorbed by the high-velocity component of the N V broad absorption line in 2013, but that component is weak or absent in the 2015 spectrum. The C IV emission-line width decreases as the reddening increases (Fig. 3). The difference between earlier spectra and the low-state spectrum shows positive residuals bracketing the rest wavelength. This is most clearly seen in the 2010 spectrum, where the large BAL Vmin leaves the blue wing of the emission line intact, but it can also be seen in the red wing in the 2013 spectra. Spectral fitting confirms the FWHM variability: FWHM(C IV)= 3275 km s−1 in 2010, ∼ 1850 km s−1 in 2013, and = 1450 km s−1 in 2015. This suggests that the same reddening/occultation causing the continuum spectral variability also covers the inner broad-line region. All of the HST spectra were fit simultaneously using Sherpa (Freeman et al. 2001). There is structure in the continuum that is most prominent in the 2015 spectrum where the AGN continuum is most absorbed. Since the 2013 minus 2015 difference spectra are smooth, we suggest that this structure is weak line emission; there is moderate Fe II emission
–7– at longer wavelengths. We created a constant continuum component by modeling the 2015 spectrum empirically with broad features, subtracting the model from the spectrum, then fitting the residuals with a high-order spline, and adding the model to a constant; see Cooper et al. in prep. for details. The AGN central engine continuum was modeled with a broken power law. The emission lines were modeled using Lorentzian profiles. The mini-BALs were modeled using four sets of gaussian optical-depth absorption lines, and assumed to absorb emission lines and both continua. The BALs were modeled using gaussian optical-depth absorption lines absorbing the AGN continuum and emission lines, but not the constant continuum component. The BAL offsets and widths were tied together among the C IV, Si IV, and N V lines for the 2013 and 2015 spectra. The resulting fit is shown in Fig. 3.
3.
Discussion
Our new observations of WPVS 007 confirm its unique nature among AGN. Swift observations of short-timescale optical/UV spectral changes reveal the first occultation event observed in the UV. Long timescale reddening changes appear to be correlated with unusual changes in the broad absorption-line velocities and the broad emission-line widths observed by HST . In this section, we argue that the occulting material and absorbing gas have their origin in the torus, and present a scenario that can explain the variability behavior.
3.1.
Size Scales in WPVS 007
Fig. 4 shows radii and size scales for WPVS 007 as a function of plausible black hole mass. Leighly et al. (2009) estimated the black hole mass is 4.1 × 10⁶ M⊙ .
–8– Vestergaard & Peterson (2006) estimated that masses derived from scaling relations are uncertain to 0.43 dex, so we consider masses between 1.5 × 10⁶ and 1.1 × 10⁷ M⊙ . Leighly et al. (2009) performed photoionization analysis of the FUSE spectrum, using an X-ray-weak spectral energy distribution with αox = −1.9, inferred from the hard X-ray detection in a long observation by Swift (Grupe et al. 2008). Scaling this SED with the 1996 HST spectrum indicates a bolometric luminosity of 5.2 × 1043 erg s−1 . We use a sum-of-blackbodies accretion disk with η = 0.1 (e.g., Frank et al. 2002) to estimate the radii characteristic of continuum emission at 1550˚ A (R1550 , under C IV), 2150˚ A (R2150 , rest-frame λeff for the UVM2 filter), and 3350˚ A (R3350 , rest-frame λeff for the U filter). Leighly et al. (2009) estimated that the Hβ emission region size (RHβ ) is 9.7 × 10⁻³ pc, based on the 1996 HST spectrum and the relations from Bentz et al. (2006). Grupe et al. (2013) found a smaller value of 4.2 × 10⁻³ pc based on the Swift photometry and using Kaspi et al. (2000). The Hβ line width is 1190 km s−1 (Leighly et al. 2009). The C IV line width varies, becoming narrower in the low state, which we attribute to reddening of the inner broad-line region by the same material responsible for the long-term secular decrease. To estimate the inner BLR radius RCIV , we simultaneously fit the low-state spectrum with a single Lorentzian profile, and the other three with broad and narrow Lorentzian components. The width of the broad component is found to be 4170 km s−1 . We estimate RCIV to be between 3.4 × 10⁻⁴ and 7.9 × 10⁻⁴ pc by scaling with RHβ and assuming that the BLR is virialized. The torus is estimated to lie between the dust sublimation radius and the radius of its peak emission at 12µm. The dust sublimation radius can be estimated to be the K-band reverberation radius RT K (Kishimoto et al. 2011). Using Eq. 1 of Kishimoto et al. (2011) and the 5500˚ A flux density from the 1996 HST spectrum yields RT K = 0.036 pc. The
–9– 12µm half-light radius is best measured by interferometry; however, R1/2 (12µm) does not have a clear luminosity scaling relationship like RT K (Burtscher et al. 2013). We estimate a plausible range for R1/2 (12µm) by comparing the WPVS 007 bolometric luminosity with those in Burtscher et al. (2013) Table 6, estimating that R1/2 (12µm) may be between 0.3 and 2 pc. The ratio of our estimated R1/2 (12µm) and RT K ranges from 8 to 56, consistent with the value of ∼ 30 generally observed (Netzer 2015, their Fig. 4). The BAL absorbing gas radius is estimated using the S IVλ1063 and S IV*λ1073 broad absorption lines from the FUSE spectrum (Leighly et al. 2009). Knowing that the excited-state population increases with density, we follow the standard method (e.g., Arav et al. 2013; Borguet et al. 2013) and find the gas density lies between log(n) = 4.9 and 5.1[cm−3 ] depending on whether partial covering is accounted for (see Cooper et al. 2015 in preparation for details). The absorber distance depends on the photoionization parameter through U = Q/4π R2 ne c; Leighly et al. (2009) showed log U ≥∼ −0.3. The upper limit cannot be determined with the spectra in hand; very high ionization lines characteristic of log U > 0 lie in the extreme UV (e.g., Hamann et al. 1998; Arav et al. 2013). However, the presence of P V in the FUSE spectrum indicates a high column density (e.g., Hamann 1998). A higher ionization parameter would drive the P +4 zone deeper into the gas, increasing the inferred NH and associated kinetic luminosity. Assuming that the ratio of the kinetic luminosity to bolometric luminosity is implausibly large if ≥ 20%, and a global covering fraction Ω = 0.2 (e.g., Dunn et al. 2010), we estimate a rough upper limit on the ionization parameter. These constraints yield RBAL between 0.17 and 1.47 parsec, consistent with the torus.
– 10 – 3.2.
The Occulting Cloud Location is in the Torus
We estimate the distance of the occulting cloud from the central engine using the occultation timescale of T = 60 days (§2.1), V = Rλ /T , and the Keplerian velocity. We approximate the occulting-cloud size to be the radius of the continuum emission region (i.e., the cloud does not fully cover the source), since we observe residual continuum in the low-state spectrum. We perform the calculation for the three continuum-emitting radii computed in §3.1 (R1550 , R2150 , R3350 ), yielding RAbs(1550) , RAbs(2150) , and RAbs(3350) (Fig. 4). The occultation is characterized by changes in reddening, and for dust to be present, the occulting cloud should lie at R > RT K . This criterion is obeyed for RAbs(2150) and RAbs(1550) , but not RAbs(3350) , and therefore the occulting cloud can largely cover the inner continuum emission region, but not the outer. It seems plausible that the occulting material is a clump embedded in a larger region of dusty gas responsible for the longer timescale reddening changes, and both are associated with the torus.
3.3.
The Broad Absorption Line Gas Originates in the Torus
To fully understand BAL variability, we ideally need frequent HST spectroscopic monitoring. While we do not have that, our observations, although sparse, were fortuitously placed, sampling the long-term secular decrease and increase in reddening between 2010 and 2015. The apparent correlation between BAL velocity offsets, reddening, and C IV emission-line width suggest they all have a common origin. While we have already estimated RBAL , based on the absorbing gas density, and it is consistent with an origin in the torus, we also estimate a dynamical radius for inner-BLR occultation RABS(CIV ) for consistency. A very rough estimate is obtained if we assume that the BAL variability timescale is the same as the C IV line-width variability timescale, and require that the BAL absorber cover RCIV . The timescale should be longer than the separation between the two 2013
– 11 – observations (190 days), because we see little difference between those spectra, but no longer than the separation between the 2013 December observation and the 2015 March observation (473 days). The derived range of radii RABS(CIV ) using the timescale of 473 days is also consistent with an origin in the torus, as well as RBAL (Fig. 4).
3.4.
A Scenario for the Spectral Variability in WPVS 007
Typical BAL variability has been attributed to several causes (e.g., Capellupo et al. 2012). Coordinated variability in multiple troughs, for example, can be attributed to ionization changes (e.g., Hamann et al. 2011). We have seen, however, that the variability in emission-line width, BAL velocity, and continuum reddening in WPVS 007 are unlike that seen in other AGN. Moreover, we have shown that the absorption and the reddening are plausibly associated with the torus. It seems likely that all of these unusual features have a common cause, and we suggest a scenario that can explain them. We suppose that the torus is not uniform but clumpy, a picture now widely accepted (e.g., Netzer 2015, for a review), and that the torus scale height is not constant with azimuth (Fig. 5). If our view to the central engine in WPVS 007 skims the edge of the torus, rotation of the (clumpy) variable-scale-height material can naturally explain the short and long timescale reddening variability. We suppose further that the torus may be the source of the BAL gas. This is not a new idea; Krolik & Kriss (2001) suggest an origin of warm absorbers from evaporation of the inner edge of the torus. Perhaps the dusty gas is ablated from the torus by the continuum radiation like wind ablates spray from the crest of a wave. Dust has a high absorption opacity that may help accelerate the gas, and we might expect the outflow velocity to be larger farther above the torus (Fig. 5). When a low-scale-height region orbits into our line
– 12 – of sight, we see through higher-velocity gas and less reddening. When a high-scale-height place orbits into our line of sight, we see more reddening and a lower-velocity outflow. This scenario also explains the emission-line-width variability if the absorber also covers the inner broad-line region.
4.
Summary
Recent improvement in monitoring capabilities reveals that occultation events are not uncommon in the X-ray band (e.g., Bianchi et al. 2012). What is new here is the observation of the first UV occultation event, and the association of the BAL variability with reddening changes, supporting an origin of the BAL gas in the torus, a natural source of gas in the outer central engine of an AGN or quasar. Why do we observe this unusual variability in WPVS 007 and not in other BAL line quasars? WPVS 007 has an anomalously low luminosity and associated black hole mass, size and time scales for a BALQ (Leighly et al. 2009). Therefore it is possible that we observe behavior in WPVS 007 that is common in BALQs but cannot usually be observed on human timescales. For example, in Leighly et al. (2009), we compare WPVS 007 with LBQS 1212+1445, a more typical BAL quasar that has a similar far-UV spectrum, but is 100× more luminous, with 10× longer timescales. So, a similar occultation event in such a luminous object might last 600 days, while the secular decrease might last 100 years. While our scenario is attractive, it needs further testing. The Swift monitoring reveals that WPVS 007 is emerging from its occultation event. If our scenario is correct, an increase in flux and associated decrease in reddening would be associated with an increase in BAL Vmax and broadening of the C IV line as the central engine is again revealed to our line of sight.
– 13 – We would like to thank Neil Gehrels for approving our Swift ToO requests, and STScI for granting the Director’s Discretionary time request for the 2015 spectrum. D. G. acknowledges support from SAO grant DD5-16074X, and K. M.L. from HST-GO-14058.001A. K.M.L. acknowledges useful discussions with S. Gallagher.
5.4×10⁴
5.5×10⁴
5.6×10⁴
5.7×10⁴
MJD
0.4 Mar−Apr 2015 May−July 2015
−0.8 −0.6 −0.2
0
0
0.2
Jun 2010 Dec 2013 Jun 2013
SMC Reddening Intrinsic αν=0.08
−1
U−V UVW1−U UVW2−UVW1 (3442A,5410A) (2486A,3442A) (1991A,2486A)
15 14.5 0.2 0.25
15
14.5
5.7×10⁴ 5.71×10⁴ 5.72×10
0.2 0.1
E(B−V)
UVM2 (2246A)
14
Facilities: HST(COS), Swift
15
14.5 UVM2 (2221A)
14
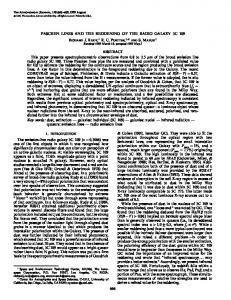
Fig. 1.— Left: long timescale UV variability of WPVS 007 using Swift filter UVM2. The upper panel shows a secular decrease since ∼ 2010; the HST observations are marked by vertical dashed lines. The lower panel shows the variable E(B − V ) derived from fitting the photometry. The inset shows the occultation event; the vertical bars demarcate the 60-day minimum. Right: color-magnitude plots. The gray lines show the best fit for SMC reddening (solid) and intrinsic spectral variability (dashed line; best-fitting power-law difference spectrum index αν = 0.08, Kokubo et al. 2014).
1.5 1
0.5
Jun 2010 Dec 2013 Jun 2013 Mar, Apr
1996 (no broad abs. line) Jun 2010 (vmax~12,900 km/s) Dec 2013 (vmax~8,700 km/s) Jun 2013 (vmax~8,700 km/s) Mar 2015 (weak broad line)
0.5
V
Fλ (10−14 erg s−1 cm−2 A−1)
B
1
U
0.2 1996 FOS
0
0.1
Fλ (10−14 erg s−1 cm−2 A−1)
2
UVW2 UVW1 UVM2
2
– 14 –
2000 5000 Observed Wavelength (Angstroms)
1450 1500 1550 1600 Rest Wavelength (Angstroms)
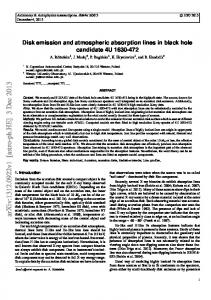
Fig. 2.— Left: the five HST spectra, plus the Swift photometry during the four recent observations. The spectral variability resembles variable reddening. Right: the dramatic variability of the C IV BAL in WPVS 007. The persistent mini-BAL near 1550 ˚ A originates in a separate component lying at large distances from the central engine (Leighly et al. 2009). The maximum velocity of the broad absorption line appears inversely correlated with the continuum flux. The broad lines do not go below the continuum in the 1996 dim state, and the 2013 BALs have approximately flat, saturated troughs, implying the presence of a non-variable continuum component.
1450
1500 1550 Rest Wavelength (Angstroms)
−1
0
NV
HST2−HST4 HST3−HST4
−2
Difference Spectrum
Lyα
1200
1220 1240 Rest Wavelength (Angstroms)
1996 March 2015 Dec 2013 June 2013 0 2 4 6 0 2 4 6 0 2 4 6 0 2 4 6
0 −0.5
Difference Spectrum
CIV HST1−HST4 HST2−HST4 HST3−HST4
June 2010 0 0.5 1 1.5 0 0.5 1 1.5 0 0.5 1 1.5 0 0.5 1 1.5 0 0.5 1 1.5
– 15 –
1200 1230
1200
1300
1400
1500
Rest Wavelength (Angstroms)
Fig. 3.— Left panel: difference spectra illustrate the emission-line and absorption-line variability; relevant lines’ restframe wavelengths are shown by vertical dashed lines. The difference between the 2010 and 2013 spectra and the 2015 spectrum are normalized to zero-flux continuum by subtracting a constant. The broader C IV line in the earlier spectra is seen in the positive residuals bracketing the miniBAL (top). The Lyα red wing in the low-state spectrum is seen in the negative residuals in the lower panel. Right panel: the spectra (Fλ ; 10−14 erg s−1 cm−2 ˚ A−1 ) (black) overlaid with the best fitting model (red) and the intrinsic continuum plus emission lines (blue).
– 16 –
Torus Continuum Broad Line Region
Fig. 4.— Size scales in WPVS 007 as a function of plausible black hole mass. See text for details. The dynamical radius of the occultor, e.g., RAbs(2150) , the dynamical radius for the inner BLR variability RABS(CIV ) , and the radius of the BAL gas based on physical properties RBAL are all consistent with an origin in the torus (between the inner edge, RT K and emission peak R12µm ).
– 17 –
a)
Outflow
b)
2010 2013 2015
Accretion Disk Torus
Fig. 5.— A simplified illustration of the scenario presented in §3.4. a) An example of a torus with variable scale height; realistically, the amplitude and azimuthal scale of the variation would be much smaller. b) An illustration of BAL winds, accelerated from the torus material like spray from the crest of a wave, with velocity increasing with distance beyond the torus. Our effective line of sight changes as material with different scale heights orbits into and out of our line of sight, naturally producing high velocity lines with low reddening and vice versa.
– 18 – REFERENCES Arav, N., Borguet, B., Chamberlain, C., Edmonds, D., & Danforth, C. 2013, MNRAS, 436, 3286 Bentz, M. C., Peterson, B. M., Pogge, R. W., Vestergaard, M., & Onken, C. A. 2006, ApJ, 644, 133 Bianchi, S., Maiolino, R., & Risaliti, G. 2012, Advances in Astronomy, 2012, 17 Borguet, B. C. J., Arav, N., Edmonds, D., Chamberlain, C., & Benn, C. 2013, ApJ, 762, 49 Burtscher, L., Meisenheimer, K., Tristram, K. R. W., et al. 2013, A&A, 558, A149 Capellupo, D. M., Hamann, F., Shields, J. C., Rodr´ıguez Hidalgo, P., & Barlow, T. A. 2011, MNRAS, 413, 908 —. 2012, MNRAS, 422, 3249 Cavaliere, A., Lapi, A., & Menci, N. 2002, ApJ, 581, L1 Dunn, J. P., Bautista, M., Arav, N., et al. 2010, ApJ, 709, 611 Filiz Ak, N., Brandt, W. N., Hall, P. B., et al. 2012, ApJ, 757, 114 —. 2013, ApJ, 777, 168 Frank, J., King, A., & Raine, D. J. 2002, Accretion Power in Astrophysics: Third Edition, Cambridge University Press Freeman, P., Doe, S., & Siemiginowska, A. 2001, in Society of Photo-Optical Instrumentation Engineers (SPIE) Conference Series, Vol. 4477, Society of Photo-Optical Instrumentation Engineers (SPIE) Conference Series, ed. J.-L. Starck & F. D. Murtagh, 76–87
– 19 – Gibson, R. R., Brandt, W. N., Schneider, D. P., & Gallagher, S. C. 2008, ApJ, 675, 985 Grupe, D., Beuerman, K., Mannheim, K., Thomas, H.-C., Fink, H. H., & de Martino, D., 1995, A&A, 300L, 21 Grupe, D., Komossa, S., Scharw¨achter, J., et al. 2013, AJ, 146, 78 Grupe, D., Leighly, K. M., & Komossa, S. 2008, AJ, 136, 2343 Grupe, D., Schady, P., Leighly, K. M., et al. 2007, AJ, 133, 1988 Hall, P. B., Anosov, K., White, R. L., et al. 2011, MNRAS, 411, 2653 Hamann, F. 1998, ApJ, 500, 798 Hamann, F., Cohen, R. D., Shields, J. C., et al. 1998, ApJ, 496, 761 Hamann, F., Kanekar, N., Prochaska, J. X., et al. 2011, MNRAS, 410, 1957 Kaspi, S., Smith, P. S., Netzer, H., et al. 2000, ApJ, 533, 631 Kishimoto, M., H¨onig, S. F., Antonucci, R., et al. 2011, A&A, 536, A78 Kokubo, M., Morokuma, T., Minezaki, T., et al. 2014, ApJ, 783, 46 Krolik, J. H., & Kriss, G. A. 2001, ApJ, 561, 684 Leighly, K. M., Hamann, F., Casebeer, D. A., & Grupe, D. 2009, ApJ, 701, 176 Netzer, H. 2015, ArXiv e-prints 1505.00811 Pei, Y. C. 1992, ApJ, 395, 130 Risaliti, G., Elvis, M., Fabbiano, G., et al. 2007, ApJ, 659, L111 Roming, P. W. A., Kennedy, T. E., Mason, K. O., et al. 2005, Space Sci. Rev., 120, 95
– 20 – Scannapieco, E., & Oh, S. P. 2004, ApJ, 608, 62 Vestergaard, M., & Peterson, B. M. 2006, ApJ, 641, 689 Weymann, R. J., Morris, S. L., Foltz, C. B., & Hewett, P. C. 1991, ApJ, 373, 23
This manuscript was prepared with the AAS LATEX macros v5.2.